 Figure 40.3
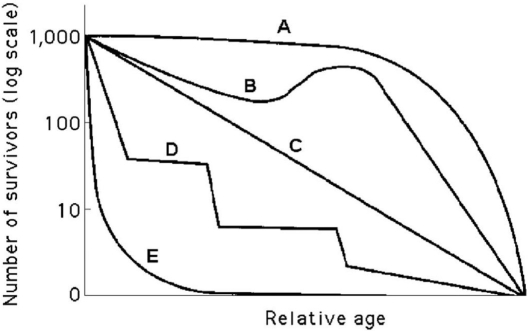
-Which statement best explains survivorship curve B?
A) It is likely a species that provides little postnatal care but lots of midlife care for offspring.
B) This curve is likely a species that produces lots of offspring,but few are expected to survive.
C) There was a mass emigration of young to middle-aged individuals in this cohort.
D) Survivorship can only decrease;therefore,this curve could not happen in nature.
Correct Answer:
Verified
Q50: Use the survivorship curves in Figure 53.1
Q78: Q79: Please use the following information to answer Q80: Figure 40.2 shows a generalized cross section Q82: A population's carrying capacity Q84: Imagine you are managing a large game Q85: Please use the following information to answer Q86: According to the logistic growth equation![]()
A)may change as environmental
[&*frac*{dN}{dt}|=|rN|thn|*frac*{(K|-|N)}{K}&]
A)the number
Unlock this Answer For Free Now!
View this answer and more for free by performing one of the following actions

Scan the QR code to install the App and get 2 free unlocks

Unlock quizzes for free by uploading documents