TABLE 16-13
A local store developed a multiplicative time-series model to forecast its revenues in future quarters, using quarterly data on its revenues during the 4-year period from 2005 to 2009. The following is the resulting regression equation:

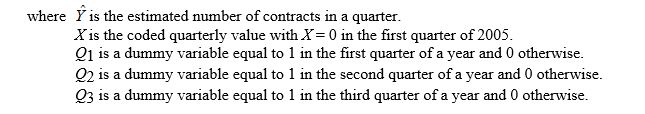
-Referring to Table 16-13, the best interpretation of the coefficient of Q3 (0.098) in the regression equation is:
A) the revenues in the third quarter of a year is approximately 9.8% higher than the average over all 4 quarters.
B) the revenues in the third quarter of a year is approximately 9.8% higher than it would be during the fourth quarter.
C) the revenues in the third quarter of a year is approximately 25.31% higher than the average over all 4 quarters.
D) the revenues in the third quarter of a year is approximately 25.31% higher than it would be during the fourth quarter.
Correct Answer:
Verified
Q122: TABLE 16-13
A local store developed a multiplicative
Q123: TABLE 16-13
A local store developed a multiplicative
Q124: TABLE 16-13
A local store developed a multiplicative
Q125: TABLE 16-13
A local store developed a multiplicative
Q126: TABLE 16-13
A local store developed a multiplicative
Q128: TABLE 16-13
A local store developed a multiplicative
Q129: TABLE 16-13
A local store developed a multiplicative
Q130: TABLE 16-13
A local store developed a multiplicative
Q131: TABLE 16-13
A local store developed a multiplicative
Q132: TABLE 16-13
A local store developed a multiplicative
Unlock this Answer For Free Now!
View this answer and more for free by performing one of the following actions

Scan the QR code to install the App and get 2 free unlocks

Unlock quizzes for free by uploading documents