The theoretical distribution of ______ is represented by ______ because ______. 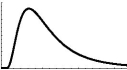 Figure A
 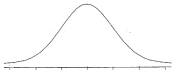 Figure B
A) F-ratios; Figure A; they can only be positive
B) t-tests; Figure A; they can be both positive or negative
C) F-ratios; Figure B; they can be both positive or negative
D) t-tests; Figure B; they can only be positive
Correct Answer:
Verified
Q18: A research study hypothesized that people who
Q19: A researcher hypothesizes that voters who identify
Q20: _ variability may also be thought of
Q21: The F-ratio is calculated by _.
A) dividing
Q22: A researcher collects data from five groups
Q24: Arnold compares the means of three groups
Q25: A researcher collects data from six groups
Q26: The _ of the F-ratio (_ variability)
Q27: A researcher collects data from four groups
Q28: Instead of being a bell-curve shape, the
Unlock this Answer For Free Now!
View this answer and more for free by performing one of the following actions

Scan the QR code to install the App and get 2 free unlocks

Unlock quizzes for free by uploading documents