Use the following graph to answer questions 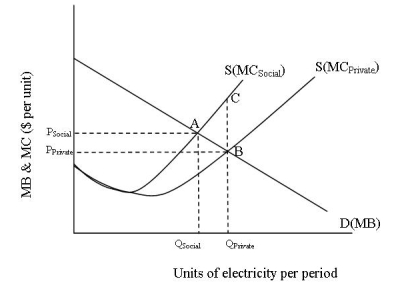
-Consider the graph that illustrates the production of electricity where not all of the costs of production are captured in the private costs.Which of the following statements is true?
A) An output of QPrivate provides an optimal allocation of resources to the market.
B) An output of QPrivate provides an efficient allocation of resources to the market.
C) An output of QSocial provides an optimal allocation of resources to the market.
D) An output of QPrivate minus QSocial provides an efficient allocation of resources to the market.
Correct Answer:
Verified
Q18: Pollution is defined as
A)the contamination of the
Q19: The optimal level of pollution is where
A)total
Q20: Which of the following is a true
Q21: Use the following graph to answer questions
Q22: Policy response to pollution that involves direct
Q24: The government sells permits that allow producers
Q25: Under cap and trade systems
A)an upper limit
Q26: When a resource has no direct price
A)overuse
Q27: A negative to the command-and-control approaches to
Q28: Describe the consequences to the market when
Unlock this Answer For Free Now!
View this answer and more for free by performing one of the following actions

Scan the QR code to install the App and get 2 free unlocks

Unlock quizzes for free by uploading documents