The diagram below shows two production possibilities boundaries for Country X. 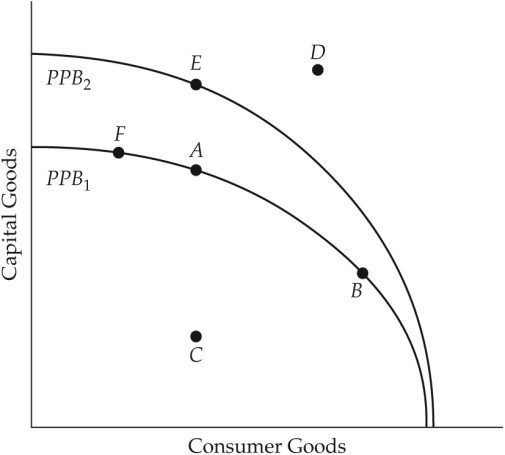 FIGURE 1-4 Refer to Figure 1-4.If Country X were producing at point C,
A) the opportunity cost of moving to point A is to give up an increase in the production of consumer goods.
B) the opportunity cost of moving to point A is zero.
C) the opportunity cost of moving to point A is to give up some capital goods.
D) this is the maximum output possible from given resources.
E) it is not possible to move to any point on PPB1 or PPB2 without technological progress.
Correct Answer:
Verified
Q67: Q68: Q69: On a diagram of a production possibilities Q70: A straight-line production possibilities boundary differs from Q71: The diagram below shows two production possibilities Q73: The diagram below shows two production possibilities Q74: On a diagram of a production possibilities Q75: The diagram below shows two production possibilities Q76: The diagram below shows two production possibilities Q77: The diagram below shows two production possibilities![]()
![]()
Unlock this Answer For Free Now!
View this answer and more for free by performing one of the following actions

Scan the QR code to install the App and get 2 free unlocks

Unlock quizzes for free by uploading documents