The table below shows the approximate value of Canada's crude oil and natural gas exports over a 5-year period.The amounts shown are billions of dollars. 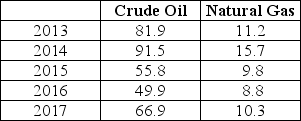 TABLE 2-7 Refer to Table 2-7.Assume that 2013 is the base year,with an index number = 100.What is the percentage change in the value of exports of crude oil from 2016 to 2017?
A) 0.34%
B) 34%
C) -0.34%
D) -34%
E) -18%
Correct Answer:
Verified
Q79: The table below shows the approximate value
Q80: The table below shows hypothetical data for
Q81: The table below shows the approximate value
Q82: Consider the following equation: Y = 10
Q83: The mathematical expression of a relationship between
Q85: What is the best way to display
Q86: An economist has data showing Canadian disposable
Q87: Data collected repeatedly over successive periods of
Q88: Data collected of several variables but for
Q89: An economist has data showing household income
Unlock this Answer For Free Now!
View this answer and more for free by performing one of the following actions

Scan the QR code to install the App and get 2 free unlocks

Unlock quizzes for free by uploading documents