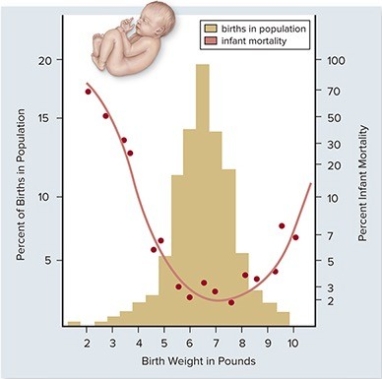
 In the graph above,how can the change in infant mortality be explained as birth weight increases from 2 to 7 pounds?
A) A larger baby will have more developed organs and thus have greater fitness.
B) A baby closer to 7 pounds will not be able to be delivered safely and thus have higher mortality.
C) A baby closer to 7 pounds will have more developed organs and thus have higher mortality.
D) A baby closer to 7 pounds will have more developed organs and thus have lower mortality.
E) A baby closer to 2 pounds will not be able to be delivered safely and thus have lower mortality.
Correct Answer:
Verified
Q3: In the Hardy-Weinberg equations,the frequencies of 2
Q4: Natural selection for a certain phenotype will
Q5: Q6: The genetic preservation of the features that Q7: When fisheries managers move fish from one Q9: A restriction in genetic variability caused by Q10: Sometimes,one gene pair will interfere with the Q11: Two parents who do not have sickle Q12: The presence of the disease sickle cell Q12: By evaluating and selecting mates with superior![]()
Unlock this Answer For Free Now!
View this answer and more for free by performing one of the following actions

Scan the QR code to install the App and get 2 free unlocks

Unlock quizzes for free by uploading documents