TABLE 14-17
Given below are results from the regression analysis where the dependent variable is the number of weeks a worker is unemployed due to a layoff (Unemploy)and the independent variables are the age of the worker (Age)and a dummy variable for management position (Manager: 1 = yes,0 = no).
The results of the regression analysis are given below: 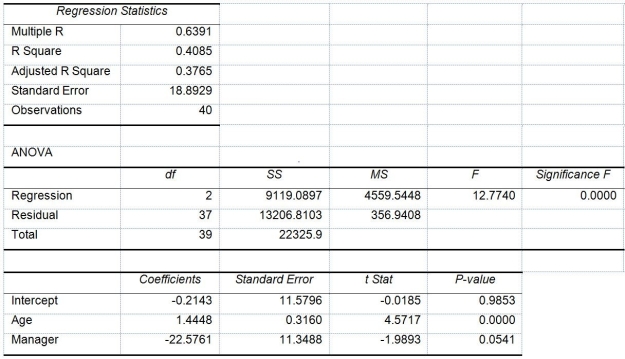
-Referring to Table 14-17,what are the lower and upper limits of the 95% confidence interval estimate for the effect of a one year increase in age on the mean number of weeks a worker is unemployed due to a layoff after taking into consideration the effect of all the other independent variables?
Correct Answer:
Verified
Q290: TABLE 14-17
Given below are results from the
Q291: TABLE 14-17
Given below are results from the
Q292: TABLE 14-17
Given below are results from the
Q293: TABLE 14-17
Given below are results from the
Q294: TABLE 14-17
Given below are results from the
Q296: TABLE 14-17
Given below are results from the
Q297: TABLE 14-18
A logistic regression model was estimated
Q298: TABLE 14-17
Given below are results from the
Q299: TABLE 14-17
Given below are results from the
Q300: TABLE 14-17
Given below are results from the
Unlock this Answer For Free Now!
View this answer and more for free by performing one of the following actions

Scan the QR code to install the App and get 2 free unlocks

Unlock quizzes for free by uploading documents