TABLE 18-2
A political pollster randomly selects a sample of 100 voters each day for 8 successive days and asks how many will vote for the incumbent.The pollster wishes to construct a p chart to see if the percentage favoring the incumbent candidate is too erratic. 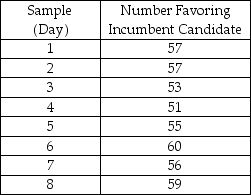
-Referring to Table 18-2,what is the numerical value of the upper control limit for the p chart?
A) 0.92
B) 0.89
C) 0.71
D) 0.62
Correct Answer:
Verified
Q6: The control chart
A)focuses on the time dimension
Q12: Which of the following situations suggests a
Q13: Variation due to the inherent variability in
Q14: TABLE 18-2
A political pollster randomly selects a
Q17: TABLE 18-2
A political pollster randomly selects a
Q17: A process is said to be out
Q20: TABLE 18-1
A local newspaper has 10 delivery
Q21: TABLE 18-4
A factory supervisor is concerned that
Q22: TABLE 18-3
A quality control analyst for a
Q23: TABLE 18-4
A factory supervisor is concerned that
Unlock this Answer For Free Now!
View this answer and more for free by performing one of the following actions

Scan the QR code to install the App and get 2 free unlocks

Unlock quizzes for free by uploading documents