Table 15-1 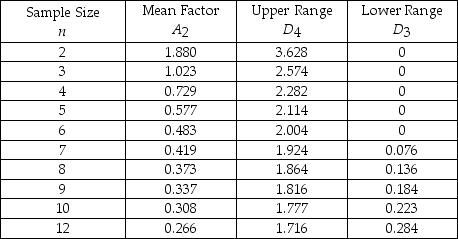
-Refer to Table 15-1.The average range of a process for packaging cereal is 1.1 ounces.If the sample size is 10,find the lower control chart limit for the range chart.
A) 0.245
B) 1.955
C) 1.777
D) 0.223
E) None of the above
Correct Answer:
Verified
Q25: Table 15-1 Q26: The U.S.government award for quality achievement is Q27: A company believes a process monitored by Q28: The p-chart would be useful when we Q29: Table 15-1 Q31: The R-chart would be useful when we Q32: A p-chart is based on which of Q33: Bags of pretzels are sampled to ensure Q34: Control charts that are used to monitor Q35: Table 15-1 Unlock this Answer For Free Now! View this answer and more for free by performing one of the following actions Scan the QR code to install the App and get 2 free unlocks Unlock quizzes for free by uploading documents![]()
A)took![]()
A)took![]()

