The following graph is a ________. 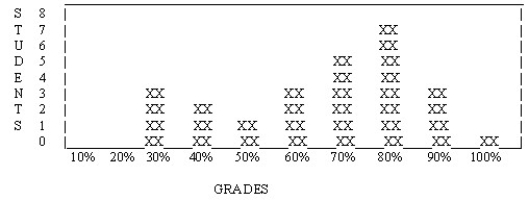
A) frequency polygon
B) skewed distribution
C) frequency histogram
D) normal distribution
Correct Answer:
Verified
Q38: The tendency of measurements to cluster around
Q39: A store owner wishes to determine which
Q40: The arithmetical average is also called the
Q41: A line graph showing a frequency distribution
Q42: In a frequency histogram, frequency is usually
Q44: A bar graph showing a frequency distribution
Q46: We say that a curve is skewed
Q47: If you know that the mean is
Q48: The following distribution is _. 
Q54: The scores gather at one end of
Unlock this Answer For Free Now!
View this answer and more for free by performing one of the following actions

Scan the QR code to install the App and get 2 free unlocks

Unlock quizzes for free by uploading documents