Use the sales data given below to determine:
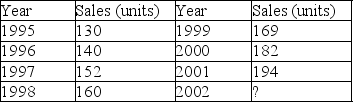 (a)The least squares trend line.
(b)The predicted value for 2002 sales.
(c)The MAD.
(d)The unadjusted forecasting MSE.
Correct Answer:
Verified
View Answer
Unlock this answer now
Get Access to more Verified Answers free of charge
Q97: Use simple exponential smoothing with α =
Q98: Daily humidity in the city of Houston
Q99: Daily high temperatures in the city of
Q100: The following table shows the number of
Q101: In general terms, describe what qualitative forecasting
Q103: Given the following data and seasonal index:
Q104: For the data below: Q105: What is the basic additive decomposition model Q106: For the data below: Q107: Briefly describe the structure of a scatter
![]()
![]()
Unlock this Answer For Free Now!
View this answer and more for free by performing one of the following actions

Scan the QR code to install the App and get 2 free unlocks

Unlock quizzes for free by uploading documents