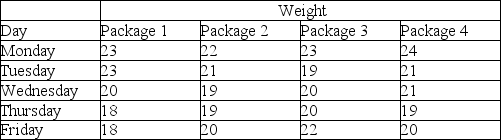
A quality analyst wants to construct a sample mean chart for controlling a packaging process. He knows from past experience that when the process is operating as intended, packaging weight is normally distributed with a mean of twenty ounces, and a process standard deviation of two ounces. Each day last week, he randomly selected four packages and weighed each. The data from that activity appears below.
 (a) If he sets an upper control limit of 21 and a lower control limit of 19 around the target value of twenty ounces, what is the probability of concluding that this process is out of control when it is actually in control?
(b) With the UCL and LCL of part a, what do you conclude about this process-is it in control?
Correct Answer:
Verified
View Answer
Unlock this answer now
Get Access to more Verified Answers free of charge
Q67: Repeated sampling of a certain process shows
Q70: The defect rate for a product has
Q87: A bank's manager has videotaped 20 different
Q125: The specifications for a manifold gasket that
Q133: If μ = 9 ounces, σ =
Q134: McDaniel Shipyards wants to develop control charts
Q135: Pierre's Motorized Pirogues and Mudboats is setting
Q140: A small, independent amusement park collects data
Q148: A retail store manager is trying to
Q150: A retail store manager is trying to
Unlock this Answer For Free Now!
View this answer and more for free by performing one of the following actions

Scan the QR code to install the App and get 2 free unlocks

Unlock quizzes for free by uploading documents