Use the table below to answer the following questions.
Table 1A.4.2 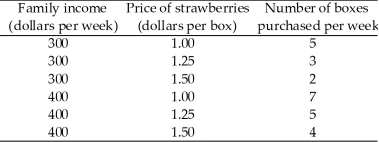
-Table 1A.4.2 shows that
A) the number of boxes of strawberries purchased is negatively related to the price of strawberries,holding income constant.
B) the number of boxes of strawberries purchased is negatively related to income,holding the price of strawberries constant.
C) the price of strawberries is negatively related to family income,holding purchases of strawberries constant.
D) there is no relationship between the price of strawberries and the number of boxes purchased.
E) there is no relationship between family income and the number of boxes of strawberries purchased.
Correct Answer:
Verified
Q180: To graph a relationship among three variables
Q181: Given the data in Table 1A.4.2,holding income
Q182: If the equation of a straight line
Q183: Use the figure below to answer the
Q184: Use the figure below to answer the
Q186: Use the figure below to answer the
Q187: Use the figure below to answer the
Q188: The equation of a line is y
Q189: Use the figure below to answer the
Q190: The equation of a line is y
Unlock this Answer For Free Now!
View this answer and more for free by performing one of the following actions

Scan the QR code to install the App and get 2 free unlocks

Unlock quizzes for free by uploading documents