Use the figure below to answer the following question. 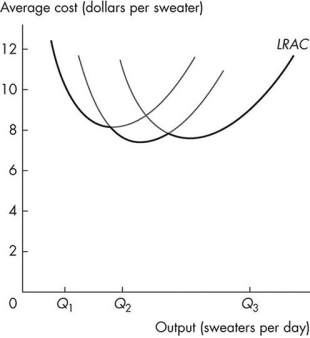 Figure 10.4.3
-Refer to Figure 10.4.3 which shows a firm's long-run average total cost curve.When production increases from Q1 to Q2 sweaters per day,the firm experiences
A) a decrease in fixed costs.
B) economies of scale.
C) diseconomies of scale.
D) constant total costs.
E) constant returns to scale.
Correct Answer:
Verified
Q134: Economies of scale are present when
A)the LRAC
Q135: If diseconomies of scale are present,
A)average total
Q136: The production function is the relationship between
Q137: Use the table below to answer the
Q138: A firm will want to increase its
Q140: Use the table below to answer the
Q141: The minimum efficient scale is the smallest
Q142: A firm experiences _ when its _
Q143: Economies of scale refer to the range
Q144: One reason for diseconomies of scale is
Unlock this Answer For Free Now!
View this answer and more for free by performing one of the following actions

Scan the QR code to install the App and get 2 free unlocks

Unlock quizzes for free by uploading documents