(Figure and Table: Indifference Curve Map) Use Figure and Table An Indifference Curve Map.Combination _____ is preferred to combination _____. 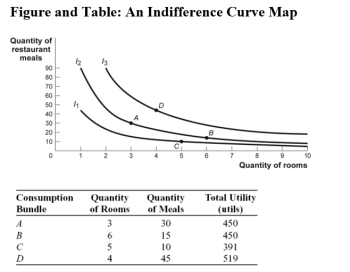
A) A;B
B) B;D
C) C;A
D) B;C
Correct Answer:
Verified
Q10: When Laurie asks Matt if he wants
Q11: Use the following to answer question:
Q12: An indifference curve is a line showing
Q13: Consumption bundles that yield equal levels of
Q14: Combinations of two goods that yield equal
Q16: Higher indifference curves represent:
A)less utility than lower
Q17: In terms of indifference curves,an increase in
Q18: If a consumer moves downward along an
Q19: Higher total utility is represented by _
Q20: Higher indifference curves represent _ lower curves.
A)less
Unlock this Answer For Free Now!
View this answer and more for free by performing one of the following actions

Scan the QR code to install the App and get 2 free unlocks

Unlock quizzes for free by uploading documents