Use the following to answer question: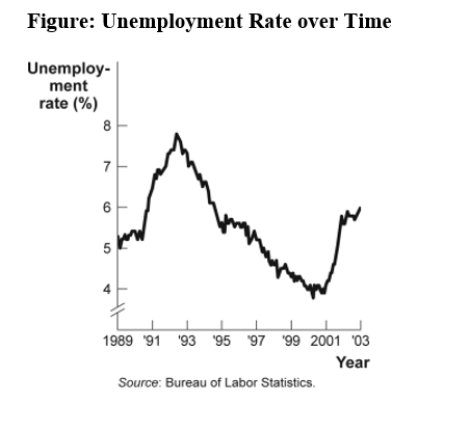
-(Figure: Unemployment Rate over Time) Use Figure: Unemployment Rate over Time.In the time-series graph,as we move from 1991 to 1993,we see that the unemployment rate has _____ from approximately _____% to approximately _____%.
A) decreased;5;4
B) increased;5.5;7
C) decreased;7.8;5
D) increased;4;6.3
Correct Answer:
Verified
Q43: Use the following to answer question:
Q44: Professor Macro wants to use a numerical
Q45: A linear curve has the same slope
Q46: A scatter diagram shows:
A)how far apart dependent
Q47: Use the following to answer question:
Q49: The owner of the Dismal Philosopher,one of
Q50: The fact that two variables always move
Q51: In looking at a chart of the
Q52: A bar graph:
A)is useful when showing what
Q53: A positive relationship between swimsuits purchased and
Unlock this Answer For Free Now!
View this answer and more for free by performing one of the following actions

Scan the QR code to install the App and get 2 free unlocks

Unlock quizzes for free by uploading documents