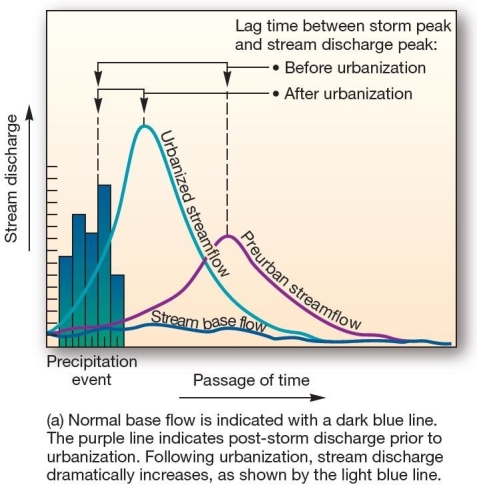
 This graph,showing the effects of urbanization on streamflow over time,is an example of a
A) water budget.
B) hydrograph.
C) climograph.
D) hydrological cycle.
E) cladogram.
Correct Answer:
Verified
Q21: _streams have some groundwater input,but only flow
Q22: Hydraulic action is highest
A)near the surface in
Q23: If a stream originates in a humid
Q24: Erosion in which boulders and gravel moving
Q25: A drainage system that maintains its original
Q27: Turbulent flow is likely to be least
Q28: In most river basins in humid regions,discharge
Q29: _streams flow year-round,fed by snowmelt,rainfall,groundwater,or a combination
Q30: The river with the greatest discharge is
Q31: Erosion performed by flowing water alone is
Unlock this Answer For Free Now!
View this answer and more for free by performing one of the following actions

Scan the QR code to install the App and get 2 free unlocks

Unlock quizzes for free by uploading documents