Deck 17: Reading, Understanding, and Creating Graphs
ملء الشاشة (f)
سؤال
Exhibit 2A-1 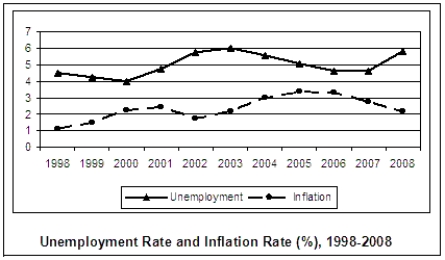
Exhibit 2A-1 is an example of a
A) bar chart.
B) scatter diagram.
C) pie chart.
D) time-series plot.
E) dual-scale diagram
Exhibit 2A-1 is an example of a
A) bar chart.
B) scatter diagram.
C) pie chart.
D) time-series plot.
E) dual-scale diagram
سؤال
Exhibit 2A-2 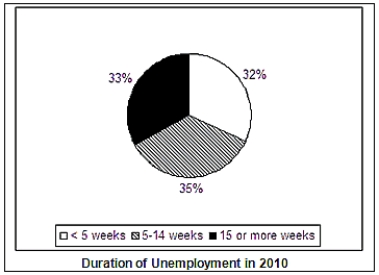
An inverse relationship between two variables indicates a
A) causation.
B) constant slope.
C) positive slope.
D) negative slope.
An inverse relationship between two variables indicates a
A) causation.
B) constant slope.
C) positive slope.
D) negative slope.
سؤال
Exhibit 2A-5 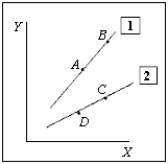
According to Exhibit 2A-5, the slope of line 1 may be 1.25, whereas the slope of line 2 may be .75.
According to Exhibit 2A-5, the slope of line 1 may be 1.25, whereas the slope of line 2 may be .75.
سؤال
Exhibit 2A-1
According to Exhibit 2A-1, in 2008 the
A) inflation rate was close to 5 percent, and the unemployment rate was about 7 percent.
B) unemployment rate and the inflation rate were equal.
C) inflation rate was close to 6 percent, and the unemployment rate was above 2 percent.
D) inflation rate was close to 2 percent, and the unemployment rate was close to 6 percent.
E) inflation rate was above 10 percent, and the unemployment rate was close to 2 percent.
سؤال
Exhibit 2A-3 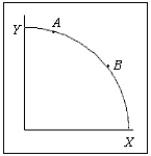
In Exhibit 2A-3, the curve shows
A) a constant relationship.
B) a direct relationship.
C) a straight-line relationship.
D) an inverse relationship.
E) normative economics.
In Exhibit 2A-3, the curve shows
A) a constant relationship.
B) a direct relationship.
C) a straight-line relationship.
D) an inverse relationship.
E) normative economics.
سؤال
Exhibit 2A-2
The slope of an inverse relationship
A) must be positive.
B) is calculated by dividing the variable on the horizontal axis by the variable on the vertical axis.
C) must be negative.
D) can never be measured.
E) must be constant everywhere along the curve.
The slope of an inverse relationship
A) must be positive.
B) is calculated by dividing the variable on the horizontal axis by the variable on the vertical axis.
C) must be negative.
D) can never be measured.
E) must be constant everywhere along the curve.
سؤال
Exhibit 2A-2
The type of chart shown in Exhibit 2A-2 is referred to as a
A) dual-scale diagram.
B) time-series graph.
C) bar chart.
D) pie chart.
E) scatter diagram.
The type of chart shown in Exhibit 2A-2 is referred to as a
A) dual-scale diagram.
B) time-series graph.
C) bar chart.
D) pie chart.
E) scatter diagram.
سؤال
Exhibit 2A-2
Suppose in 2010, on average, 10 million people were unemployed. According to Exhibit 2A-2, how many of these people had been unemployed for less than five weeks?
A) 3.2 million
B) 3.3 million
C) 3.5 million
D) 32 million
E) 33 million
Suppose in 2010, on average, 10 million people were unemployed. According to Exhibit 2A-2, how many of these people had been unemployed for less than five weeks?
A) 3.2 million
B) 3.3 million
C) 3.5 million
D) 32 million
E) 33 million
سؤال
Exhibit 2A-4 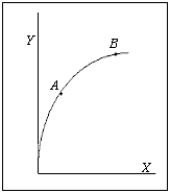
-Refer to Exhibit 2A-4. The slope of the relationship between X and Y is
A) positive.
B) negative.
C) zero.
D) infinity.
E) less than -1.
-Refer to Exhibit 2A-4. The slope of the relationship between X and Y is
A) positive.
B) negative.
C) zero.
D) infinity.
E) less than -1.
سؤال
سؤال
سؤال
سؤال
Exhibit 2A-5
Refer to Exhibit 2A-5. The movement from C to B is called a
A) change in dimension.
B) shift in the relationship between X and Y.
C) movement along the curve.
D) parallel change.
E) constant.
Refer to Exhibit 2A-5. The movement from C to B is called a
A) change in dimension.
B) shift in the relationship between X and Y.
C) movement along the curve.
D) parallel change.
E) constant.
سؤال
سؤال
سؤال
Exhibit 2A-5
Refer to Exhibit 2A-5. The movement from A to B is called a
A) change in dimension.
B) shift in the curve.
C) movement along the curve.
D) change in the intercept.
E) change in the slope.
Refer to Exhibit 2A-5. The movement from A to B is called a
A) change in dimension.
B) shift in the curve.
C) movement along the curve.
D) change in the intercept.
E) change in the slope.
سؤال
Exhibit 2A-3
In Exhibit 2A-3, the curve has a
A) positive slope with decreasing absolute value.
B) negative slope with decreasing absolute value.
C) negative slope with increasing absolute value.
D) constant negative slope.
E) positive slope with increasing absolute value.
In Exhibit 2A-3, the curve has a
A) positive slope with decreasing absolute value.
B) negative slope with decreasing absolute value.
C) negative slope with increasing absolute value.
D) constant negative slope.
E) positive slope with increasing absolute value.
سؤال
Exhibit 2A-4
The curve in Exhibit 2A-4 represents a(n)
A) negative slope.
B) slope that is constant and positive.
C) slope that is not constant and positive.
D) inverse relationship.
E) slope that is constant.
The curve in Exhibit 2A-4 represents a(n)
A) negative slope.
B) slope that is constant and positive.
C) slope that is not constant and positive.
D) inverse relationship.
E) slope that is constant.
سؤال
سؤال
Exhibit 2A-4
Refer to Exhibit 2A-4. Which of the following statements is true?
A) The slope at point B is greater than the slope at point A.
B) The slope at point A is less than the slope at point B.
C) The slope at point A is greater than the slope at point B.
D) The slope at point B is the same as the slope at point A.
E) The slope at point A is negative, whereas the slope at point B is positive.
سؤال
سؤال
Refer to the table below, which shows data for the United States. 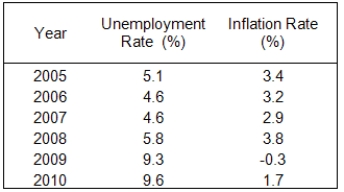

سؤال
Exhibit 2A-8 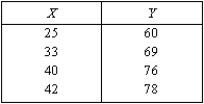
There is a linear relationship between X and Y in Exhibit 2A-8.
There is a linear relationship between X and Y in Exhibit 2A-8.
سؤال
سؤال
Exhibit 2A-5
Refer to Exhibit 2A-5. Which of the following would best explain the shift from line 1 to line 2?
A) An increase in X
B) A decline in Y
C) A decrease in X
D) A change in a third variable, Z, which affects the relationship between Y and X
E) An increase in the slope
Refer to Exhibit 2A-5. Which of the following would best explain the shift from line 1 to line 2?
A) An increase in X
B) A decline in Y
C) A decrease in X
D) A change in a third variable, Z, which affects the relationship between Y and X
E) An increase in the slope
سؤال
The table below shows the inflation rate for the period 2005 through 2010. Suppose you wanted to show that there was not much variation in the inflation rate over this period. How would you represent this table in a graph? Suppose you wanted to show that there was a large amount of variation during this period. How would you represent this table in a graph? 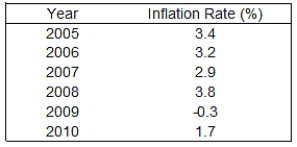
سؤال
Graph the relationship between X and Y such that the relationship between X and Y is linear and positive.

سؤال
سؤال
سؤال
Refer to the table below. Analyze the data on the number of meals served at small and large restaurants. The number of meals served will vary with the number of cooks employed at the restaurant. 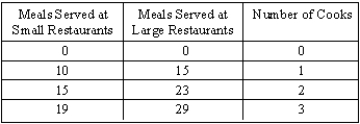

سؤال
Consider a ratio for the total number of miles traveled by car divided by the total number of drivers.

سؤال
سؤال
Explain the purpose of each of the following types of graphs:

سؤال
Exhibit 2A-6 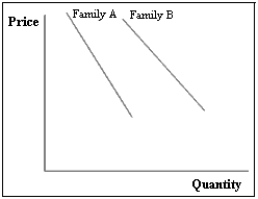
Exhibit 2A-6 shows the relationship between the price of sodas and the quantities that two families are willing to buy. Suppose that both families are willing to buy more sodas while the soda price remain constant. Which of the following is correct?
A) A shift of both curves to the right
B) A shift of both curves to the left
C) A shift of the curve for Family A to the right and a shift of the curve for Family B to the left
D) A shift of the curve for Family B to the right and a shift of the curve for Family A to the left
E) A movement along each of the two curves
سؤال
Exhibit 2A-7 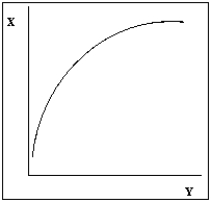
-Exhibit 2A-7 shows the relationship between X and Y. The slope of the relationship is
A) positive, and the slope increases with Y.
B) positive, and the slope decreases with Y.
C) equal to -1.
D) negative, and the slope increases with Y.
E) negative, and the slope decreases with Y.
-Exhibit 2A-7 shows the relationship between X and Y. The slope of the relationship is
A) positive, and the slope increases with Y.
B) positive, and the slope decreases with Y.
C) equal to -1.
D) negative, and the slope increases with Y.
E) negative, and the slope decreases with Y.

فتح الحزمة
قم بالتسجيل لفتح البطاقات في هذه المجموعة!
Unlock Deck
Unlock Deck
1/35
العب
ملء الشاشة (f)
Deck 17: Reading, Understanding, and Creating Graphs
1
Exhibit 2A-1
Exhibit 2A-1 is an example of a
A) bar chart.
B) scatter diagram.
C) pie chart.
D) time-series plot.
E) dual-scale diagram
Exhibit 2A-1 is an example of a
A) bar chart.
B) scatter diagram.
C) pie chart.
D) time-series plot.
E) dual-scale diagram
time-series plot.
2
Exhibit 2A-2
An inverse relationship between two variables indicates a
A) causation.
B) constant slope.
C) positive slope.
D) negative slope.
An inverse relationship between two variables indicates a
A) causation.
B) constant slope.
C) positive slope.
D) negative slope.
negative slope.
3
Exhibit 2A-5
According to Exhibit 2A-5, the slope of line 1 may be 1.25, whereas the slope of line 2 may be .75.
According to Exhibit 2A-5, the slope of line 1 may be 1.25, whereas the slope of line 2 may be .75.
True
4
Exhibit 2A-1
According to Exhibit 2A-1, in 2008 the
A) inflation rate was close to 5 percent, and the unemployment rate was about 7 percent.
B) unemployment rate and the inflation rate were equal.
C) inflation rate was close to 6 percent, and the unemployment rate was above 2 percent.
D) inflation rate was close to 2 percent, and the unemployment rate was close to 6 percent.
E) inflation rate was above 10 percent, and the unemployment rate was close to 2 percent.
فتح الحزمة
افتح القفل للوصول البطاقات البالغ عددها 35 في هذه المجموعة.
فتح الحزمة
k this deck
5
Exhibit 2A-3
In Exhibit 2A-3, the curve shows
A) a constant relationship.
B) a direct relationship.
C) a straight-line relationship.
D) an inverse relationship.
E) normative economics.
In Exhibit 2A-3, the curve shows
A) a constant relationship.
B) a direct relationship.
C) a straight-line relationship.
D) an inverse relationship.
E) normative economics.
فتح الحزمة
افتح القفل للوصول البطاقات البالغ عددها 35 في هذه المجموعة.
فتح الحزمة
k this deck
6
Exhibit 2A-2
The slope of an inverse relationship
A) must be positive.
B) is calculated by dividing the variable on the horizontal axis by the variable on the vertical axis.
C) must be negative.
D) can never be measured.
E) must be constant everywhere along the curve.
The slope of an inverse relationship
A) must be positive.
B) is calculated by dividing the variable on the horizontal axis by the variable on the vertical axis.
C) must be negative.
D) can never be measured.
E) must be constant everywhere along the curve.
فتح الحزمة
افتح القفل للوصول البطاقات البالغ عددها 35 في هذه المجموعة.
فتح الحزمة
k this deck
7
Exhibit 2A-2
The type of chart shown in Exhibit 2A-2 is referred to as a
A) dual-scale diagram.
B) time-series graph.
C) bar chart.
D) pie chart.
E) scatter diagram.
The type of chart shown in Exhibit 2A-2 is referred to as a
A) dual-scale diagram.
B) time-series graph.
C) bar chart.
D) pie chart.
E) scatter diagram.
فتح الحزمة
افتح القفل للوصول البطاقات البالغ عددها 35 في هذه المجموعة.
فتح الحزمة
k this deck
8
Exhibit 2A-2
Suppose in 2010, on average, 10 million people were unemployed. According to Exhibit 2A-2, how many of these people had been unemployed for less than five weeks?
A) 3.2 million
B) 3.3 million
C) 3.5 million
D) 32 million
E) 33 million
Suppose in 2010, on average, 10 million people were unemployed. According to Exhibit 2A-2, how many of these people had been unemployed for less than five weeks?
A) 3.2 million
B) 3.3 million
C) 3.5 million
D) 32 million
E) 33 million
فتح الحزمة
افتح القفل للوصول البطاقات البالغ عددها 35 في هذه المجموعة.
فتح الحزمة
k this deck
9
Exhibit 2A-4
-Refer to Exhibit 2A-4. The slope of the relationship between X and Y is
A) positive.
B) negative.
C) zero.
D) infinity.
E) less than -1.
-Refer to Exhibit 2A-4. The slope of the relationship between X and Y is
A) positive.
B) negative.
C) zero.
D) infinity.
E) less than -1.
فتح الحزمة
افتح القفل للوصول البطاقات البالغ عددها 35 في هذه المجموعة.
فتح الحزمة
k this deck
10
A curve shows that every time family income increases by $1, spending increases by $.75. This curve would
A) have a negative slope with decreasing absolute value.
B) have a positive slope with increasing absolute value.
C) have a negative slope with increasing absolute value.
D) have a positive slope with decreasing absolute value.
E) be a straight line with a positive slope.
A) have a negative slope with decreasing absolute value.
B) have a positive slope with increasing absolute value.
C) have a negative slope with increasing absolute value.
D) have a positive slope with decreasing absolute value.
E) be a straight line with a positive slope.
فتح الحزمة
افتح القفل للوصول البطاقات البالغ عددها 35 في هذه المجموعة.
فتح الحزمة
k this deck
11
A two-dimensional diagram can be represented by the
A) depth of this page.
B) length of this page.
C) surface of this page.
D) volume of a book.
E) width of this page.
A) depth of this page.
B) length of this page.
C) surface of this page.
D) volume of a book.
E) width of this page.
فتح الحزمة
افتح القفل للوصول البطاقات البالغ عددها 35 في هذه المجموعة.
فتح الحزمة
k this deck
12
A relationship showing that exam grades are positively related to hours of study can be described by a curve that
A) slopes downward.
B) is horizontal.
C) has a negative slope with increasing absolute value.
D) slopes upward.
E) has a negative slope with decreasing absolute value.
A) slopes downward.
B) is horizontal.
C) has a negative slope with increasing absolute value.
D) slopes upward.
E) has a negative slope with decreasing absolute value.
فتح الحزمة
افتح القفل للوصول البطاقات البالغ عددها 35 في هذه المجموعة.
فتح الحزمة
k this deck
13
Exhibit 2A-5
Refer to Exhibit 2A-5. The movement from C to B is called a
A) change in dimension.
B) shift in the relationship between X and Y.
C) movement along the curve.
D) parallel change.
E) constant.
Refer to Exhibit 2A-5. The movement from C to B is called a
A) change in dimension.
B) shift in the relationship between X and Y.
C) movement along the curve.
D) parallel change.
E) constant.
فتح الحزمة
افتح القفل للوصول البطاقات البالغ عددها 35 في هذه المجموعة.
فتح الحزمة
k this deck
14
Suppose a curve shows that every time family income increases by $1, spending increases by $.75. If spending increases by $500, then income increased by
A) $667.
B) $500.
C) $375.
D) $125.
A) $667.
B) $500.
C) $375.
D) $125.
فتح الحزمة
افتح القفل للوصول البطاقات البالغ عددها 35 في هذه المجموعة.
فتح الحزمة
k this deck
15
According to Exhibit 2A-3, which of the following is true?
A) The magnitude of the slope at point B is the same as it is at point A.
B) The magnitude of the slope at point A is less than the magnitude of the slope at point B.
C) The slope at point A is negative, whereas the slope at point B is positive.
D) The magnitude of the slope at point B is less than the magnitude of the slope at point A.
E) The magnitude of the slope at point A is greater than the magnitude of the slope at point B.
فتح الحزمة
افتح القفل للوصول البطاقات البالغ عددها 35 في هذه المجموعة.
فتح الحزمة
k this deck
16
Exhibit 2A-5
Refer to Exhibit 2A-5. The movement from A to B is called a
A) change in dimension.
B) shift in the curve.
C) movement along the curve.
D) change in the intercept.
E) change in the slope.
Refer to Exhibit 2A-5. The movement from A to B is called a
A) change in dimension.
B) shift in the curve.
C) movement along the curve.
D) change in the intercept.
E) change in the slope.
فتح الحزمة
افتح القفل للوصول البطاقات البالغ عددها 35 في هذه المجموعة.
فتح الحزمة
k this deck
17
Exhibit 2A-3
In Exhibit 2A-3, the curve has a
A) positive slope with decreasing absolute value.
B) negative slope with decreasing absolute value.
C) negative slope with increasing absolute value.
D) constant negative slope.
E) positive slope with increasing absolute value.
In Exhibit 2A-3, the curve has a
A) positive slope with decreasing absolute value.
B) negative slope with decreasing absolute value.
C) negative slope with increasing absolute value.
D) constant negative slope.
E) positive slope with increasing absolute value.
فتح الحزمة
افتح القفل للوصول البطاقات البالغ عددها 35 في هذه المجموعة.
فتح الحزمة
k this deck
18
Exhibit 2A-4
The curve in Exhibit 2A-4 represents a(n)
A) negative slope.
B) slope that is constant and positive.
C) slope that is not constant and positive.
D) inverse relationship.
E) slope that is constant.
The curve in Exhibit 2A-4 represents a(n)
A) negative slope.
B) slope that is constant and positive.
C) slope that is not constant and positive.
D) inverse relationship.
E) slope that is constant.
فتح الحزمة
افتح القفل للوصول البطاقات البالغ عددها 35 في هذه المجموعة.
فتح الحزمة
k this deck
19
Suppose a curve shows that every time family income increases by $1, spending increases by $.75. If family income increases by $500, then spending will increase by
A) $667.
B) $125.
C) $375.
D) $500.
A) $667.
B) $125.
C) $375.
D) $500.
فتح الحزمة
افتح القفل للوصول البطاقات البالغ عددها 35 في هذه المجموعة.
فتح الحزمة
k this deck
20
Exhibit 2A-4
Refer to Exhibit 2A-4. Which of the following statements is true?
A) The slope at point B is greater than the slope at point A.
B) The slope at point A is less than the slope at point B.
C) The slope at point A is greater than the slope at point B.
D) The slope at point B is the same as the slope at point A.
E) The slope at point A is negative, whereas the slope at point B is positive.
فتح الحزمة
افتح القفل للوصول البطاقات البالغ عددها 35 في هذه المجموعة.
فتح الحزمة
k this deck
21
Consider a straight line with a slope of +1 that intersects the origin. It dissects the positive X-Y quadrant. Select any point on the line. What must be true about the distance between the origin and the X coordinate and between the origin and the Y coordinate?
فتح الحزمة
افتح القفل للوصول البطاقات البالغ عددها 35 في هذه المجموعة.
فتح الحزمة
k this deck
22
Refer to the table below, which shows data for the United States.
فتح الحزمة
افتح القفل للوصول البطاقات البالغ عددها 35 في هذه المجموعة.
فتح الحزمة
k this deck
23
Exhibit 2A-8
There is a linear relationship between X and Y in Exhibit 2A-8.
There is a linear relationship between X and Y in Exhibit 2A-8.
فتح الحزمة
افتح القفل للوصول البطاقات البالغ عددها 35 في هذه المجموعة.
فتح الحزمة
k this deck
24
A positive relationship represents a situation where an increase in one variable is associated with an increase in the other variable. Draw three graphs that represent a positive relationship.
فتح الحزمة
افتح القفل للوصول البطاقات البالغ عددها 35 في هذه المجموعة.
فتح الحزمة
k this deck
25
Exhibit 2A-5
Refer to Exhibit 2A-5. Which of the following would best explain the shift from line 1 to line 2?
A) An increase in X
B) A decline in Y
C) A decrease in X
D) A change in a third variable, Z, which affects the relationship between Y and X
E) An increase in the slope
Refer to Exhibit 2A-5. Which of the following would best explain the shift from line 1 to line 2?
A) An increase in X
B) A decline in Y
C) A decrease in X
D) A change in a third variable, Z, which affects the relationship between Y and X
E) An increase in the slope
فتح الحزمة
افتح القفل للوصول البطاقات البالغ عددها 35 في هذه المجموعة.
فتح الحزمة
k this deck
26
The table below shows the inflation rate for the period 2005 through 2010. Suppose you wanted to show that there was not much variation in the inflation rate over this period. How would you represent this table in a graph? Suppose you wanted to show that there was a large amount of variation during this period. How would you represent this table in a graph?
فتح الحزمة
افتح القفل للوصول البطاقات البالغ عددها 35 في هذه المجموعة.
فتح الحزمة
k this deck
27
Graph the relationship between X and Y such that the relationship between X and Y is linear and positive.
فتح الحزمة
افتح القفل للوصول البطاقات البالغ عددها 35 في هذه المجموعة.
فتح الحزمة
k this deck
28
A two-dimensional graph cannot be used to show what will happen to the relationship between X and Y if any of the ceteris paribus assumptions change.
فتح الحزمة
افتح القفل للوصول البطاقات البالغ عددها 35 في هذه المجموعة.
فتح الحزمة
k this deck
29
Suppose the value of one variable rises while the value of another variable falls; then the slope of the relationship between the two variables is between 0 and 1.
فتح الحزمة
افتح القفل للوصول البطاقات البالغ عددها 35 في هذه المجموعة.
فتح الحزمة
k this deck
30
Refer to the table below. Analyze the data on the number of meals served at small and large restaurants. The number of meals served will vary with the number of cooks employed at the restaurant.
فتح الحزمة
افتح القفل للوصول البطاقات البالغ عددها 35 في هذه المجموعة.
فتح الحزمة
k this deck
31
Consider a ratio for the total number of miles traveled by car divided by the total number of drivers.
فتح الحزمة
افتح القفل للوصول البطاقات البالغ عددها 35 في هذه المجموعة.
فتح الحزمة
k this deck
32
The slope of the relationship between X and Y is positive in Exhibit 2A-8.
فتح الحزمة
افتح القفل للوصول البطاقات البالغ عددها 35 في هذه المجموعة.
فتح الحزمة
k this deck
33
Explain the purpose of each of the following types of graphs:
فتح الحزمة
افتح القفل للوصول البطاقات البالغ عددها 35 في هذه المجموعة.
فتح الحزمة
k this deck
34
Exhibit 2A-6
Exhibit 2A-6 shows the relationship between the price of sodas and the quantities that two families are willing to buy. Suppose that both families are willing to buy more sodas while the soda price remain constant. Which of the following is correct?
A) A shift of both curves to the right
B) A shift of both curves to the left
C) A shift of the curve for Family A to the right and a shift of the curve for Family B to the left
D) A shift of the curve for Family B to the right and a shift of the curve for Family A to the left
E) A movement along each of the two curves
فتح الحزمة
افتح القفل للوصول البطاقات البالغ عددها 35 في هذه المجموعة.
فتح الحزمة
k this deck
35
Exhibit 2A-7
-Exhibit 2A-7 shows the relationship between X and Y. The slope of the relationship is
A) positive, and the slope increases with Y.
B) positive, and the slope decreases with Y.
C) equal to -1.
D) negative, and the slope increases with Y.
E) negative, and the slope decreases with Y.
-Exhibit 2A-7 shows the relationship between X and Y. The slope of the relationship is
A) positive, and the slope increases with Y.
B) positive, and the slope decreases with Y.
C) equal to -1.
D) negative, and the slope increases with Y.
E) negative, and the slope decreases with Y.
فتح الحزمة
افتح القفل للوصول البطاقات البالغ عددها 35 في هذه المجموعة.
فتح الحزمة
k this deck
فتح الحزمة
افتح القفل للوصول البطاقات البالغ عددها 35 في هذه المجموعة.


