Deck 3: Numerical Descriptive Measures
ملء الشاشة (f)
سؤال
سؤال
سؤال
The formula for a z-score is 
سؤال
سؤال
سؤال
سؤال
سؤال
سؤال
سؤال
سؤال
سؤال
سؤال
سؤال
سؤال
سؤال
سؤال
سؤال
سؤال
سؤال
سؤال
سؤال
سؤال
سؤال
سؤال
سؤال
سؤال
سؤال
سؤال
The table below gives the deviations of a portfolio's annual total returns from its benchmark's annual returns,for a 6-year period ending in 2011.  The arithmetic mean return and median return are the closest to _______.
A) mean = -2.00% and median = -4.28%.
B) mean = -2.00% and median = -1.67%.
C) mean = -1.67% and median = -0.56%.
D) mean = -1.67% and median = 0.56%
The arithmetic mean return and median return are the closest to _______.A) mean = -2.00% and median = -4.28%.
B) mean = -2.00% and median = -1.67%.
C) mean = -1.67% and median = -0.56%.
D) mean = -1.67% and median = 0.56%
سؤال
سؤال
سؤال
سؤال
سؤال
سؤال
سؤال
سؤال
سؤال
سؤال
سؤال
سؤال
سؤال
سؤال
سؤال
سؤال
سؤال
سؤال
An analyst gathered the following information about the net profit margins of companies in two industries: 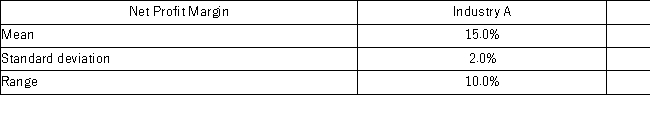 Compared with the other industry,the relative dispersion of net profit margins is smaller for Industry ___________________________________________.
A) B,because it has a smaller mean deviation.
B) B,because it has a smaller range of variation.
C) A,because it has a smaller standard deviation.
D) A,because it has a smaller coefficient of variation.
Compared with the other industry,the relative dispersion of net profit margins is smaller for Industry ___________________________________________.A) B,because it has a smaller mean deviation.
B) B,because it has a smaller range of variation.
C) A,because it has a smaller standard deviation.
D) A,because it has a smaller coefficient of variation.
سؤال
سؤال
سؤال
سؤال
سؤال
سؤال
سؤال
سؤال
سؤال
سؤال
سؤال
سؤال
سؤال
سؤال
سؤال
سؤال
سؤال
سؤال
سؤال
سؤال
سؤال
سؤال
The following table summarizes selected statistics for two portfolios for a 10-year period ending in 2006.Assume that the risk-free rate is 4% over this period. 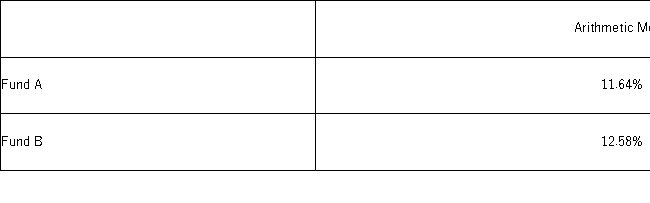 As measured by the Sharpe ratio,the fund with the superior risk-adjusted performance during this period is _________________________________________________________.
A) Fund A because it has a lower positive Sharpe ratio than Fund B
B) Fund B because it has a lower positive Sharpe ratio than Fund A
C) Fund A because it has a higher positive Sharpe ratio than Fund B
D) Fund B because it has a higher positive Sharpe ratio than Fund A
As measured by the Sharpe ratio,the fund with the superior risk-adjusted performance during this period is _________________________________________________________.A) Fund A because it has a lower positive Sharpe ratio than Fund B
B) Fund B because it has a lower positive Sharpe ratio than Fund A
C) Fund A because it has a higher positive Sharpe ratio than Fund B
D) Fund B because it has a higher positive Sharpe ratio than Fund A
سؤال
سؤال
سؤال
سؤال
سؤال
سؤال
A college professor collected data on the number of hours spent by his 100 students over the weekend to prepare for Monday's Business Statistics exam.He processed the data by Excel and the following incomplete output is available.  The median is most likely to be ________________.
A) about 7 hours
B) less than 7 hours
C) greater than 7 hours
D) Cannot tell from the information provided
The median is most likely to be ________________.A) about 7 hours
B) less than 7 hours
C) greater than 7 hours
D) Cannot tell from the information provided
سؤال
سؤال
The table below gives statistics relating to a hypothetical 10-year record of two portfolios.Assume other statistics relating to these portfolios are the same and the risk-free rate is 3.5%.Using the coefficient of variation and the Sharpe ratio,the fund that is preferred in terms of relative risk and return per unit of risk is: ________________________________________.  Using the coefficient of variation and the Sharpe ratio,the fund that is preferred in terms of relative risk and return per unit of risk is ______________________________________________.
A) Portfolio A becauseit has a higher coefficient of variation and a lower Sharpe ratio
B) Portfolio A because it has a lower coefficient of variation and a higher Sharpe ratio
C) Portfolio B because it has a higher coefficient of variation and a lower Sharpe ratio
D) Portfolio B because it has a lower coefficient of variation and a higher Sharper ratio
Using the coefficient of variation and the Sharpe ratio,the fund that is preferred in terms of relative risk and return per unit of risk is ______________________________________________.A) Portfolio A becauseit has a higher coefficient of variation and a lower Sharpe ratio
B) Portfolio A because it has a lower coefficient of variation and a higher Sharpe ratio
C) Portfolio B because it has a higher coefficient of variation and a lower Sharpe ratio
D) Portfolio B because it has a lower coefficient of variation and a higher Sharper ratio
سؤال
سؤال
سؤال
A college professor collected data on the number of hours spent by his 100 students over the weekend to prepare for Monday's Business Statistics exam.He processed the data by Excel and the following incomplete output is available. 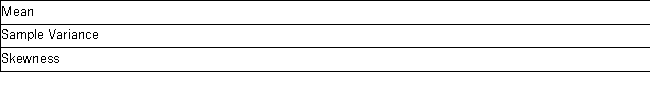 The coefficient of variation in the data is ______.
A) 40%
B) 90%
C) 111%
D) 243%
The coefficient of variation in the data is ______.A) 40%
B) 90%
C) 111%
D) 243%

فتح الحزمة
قم بالتسجيل لفتح البطاقات في هذه المجموعة!
Unlock Deck
Unlock Deck
1/151
العب
ملء الشاشة (f)
Deck 3: Numerical Descriptive Measures
1
The empirical rule is only applicable for approximately bell-shaped data.
True
2
The variance and standard deviation are the most widely used measures of central location.
False
3
The formula for a z-score is
False
4
The variance is an average squared deviation from the mean.
فتح الحزمة
افتح القفل للوصول البطاقات البالغ عددها 151 في هذه المجموعة.
فتح الحزمة
k this deck
5
The median is not always the 50th percentile.
فتح الحزمة
افتح القفل للوصول البطاقات البالغ عددها 151 في هذه المجموعة.
فتح الحزمة
k this deck
6
Outliers are extreme values above or below the mean that require special consideration.
فتح الحزمة
افتح القفل للوصول البطاقات البالغ عددها 151 في هذه المجموعة.
فتح الحزمة
k this deck
7
Z-scores can always be used to detect outliers.
فتح الحزمة
افتح القفل للوصول البطاقات البالغ عددها 151 في هذه المجموعة.
فتح الحزمة
k this deck
8
Mark's grade on the recent business statistics test was an 85 on a scale of 0-100.Based onthis information we canconclude that Mark's grade was in the 85th percentile in his class.
فتح الحزمة
افتح القفل للوصول البطاقات البالغ عددها 151 في هذه المجموعة.
فتح الحزمة
k this deck
9
Mean-variance analysis suggests that investments with lower average returns are also associated with higher risks.
فتح الحزمة
افتح القفل للوصول البطاقات البالغ عددها 151 في هذه المجموعة.
فتح الحزمة
k this deck
10
The standard deviation is the positive square root of the variance.
فتح الحزمة
افتح القفل للوصول البطاقات البالغ عددها 151 في هذه المجموعة.
فتح الحزمة
k this deck
11
Chebyshev's theorem is only applicable for sample data.
فتح الحزمة
افتح القفل للوصول البطاقات البالغ عددها 151 في هذه المجموعة.
فتح الحزمة
k this deck
12
The geometric mean is a multiplicative average of a data set.
فتح الحزمة
افتح القفل للوصول البطاقات البالغ عددها 151 في هذه المجموعة.
فتح الحزمة
k this deck
13
The arithmetic mean is the middle value of a data set.
فتح الحزمة
افتح القفل للوصول البطاقات البالغ عددها 151 في هذه المجموعة.
فتح الحزمة
k this deck
14
The coefficient of variation is a unit-free measure of dispersion.
فتح الحزمة
افتح القفل للوصول البطاقات البالغ عددها 151 في هذه المجموعة.
فتح الحزمة
k this deck
15
A box plot is useful when comparing similar information gathered at different places or times.
فتح الحزمة
افتح القفل للوصول البطاقات البالغ عددها 151 في هذه المجموعة.
فتح الحزمة
k this deck
16
Approximately 60% of the observations in a data set fall below the 60th percentile.
فتح الحزمة
افتح القفل للوصول البطاقات البالغ عددها 151 في هذه المجموعة.
فتح الحزمة
k this deck
17
In a data set,an outlier is a large or small value regarded as an extreme value in the data set.
فتح الحزمة
افتح القفل للوصول البطاقات البالغ عددها 151 في هذه المجموعة.
فتح الحزمة
k this deck
18
The terms central location or central tendency refer to the way quantitative data tend to cluster around some middle or central value.
فتح الحزمة
افتح القفل للوصول البطاقات البالغ عددها 151 في هذه المجموعة.
فتح الحزمة
k this deck
19
The Sharpe ratio measures the extra reward per unit of risk.
فتح الحزمة
افتح القفل للوصول البطاقات البالغ عددها 151 في هذه المجموعة.
فتح الحزمة
k this deck
20
The mean absolute deviation (MAD)is a less effective measure of variation when compared with the average deviation from the mean.
فتح الحزمة
افتح القفل للوصول البطاقات البالغ عددها 151 في هذه المجموعة.
فتح الحزمة
k this deck
21
Which five values are graphed on a box plot?
A) Min,Quintile 1,Mean,Quintile 3,Max
B) Min,Quartile 1,Mean,Quartile 3,Max
C) Min,Quintile 1,Median,Quintile 3,Max
D) Min,Quartile 1,Median,Quartile 3,Max
A) Min,Quintile 1,Mean,Quintile 3,Max
B) Min,Quartile 1,Mean,Quartile 3,Max
C) Min,Quintile 1,Median,Quintile 3,Max
D) Min,Quartile 1,Median,Quartile 3,Max
فتح الحزمة
افتح القفل للوصول البطاقات البالغ عددها 151 في هذه المجموعة.
فتح الحزمة
k this deck
22
The median is defined asthe______________.
A) middle point in a data set.
B) geometric average of a data set.
C) arithmetic average of a data set.
D) most common value of a data set.
A) middle point in a data set.
B) geometric average of a data set.
C) arithmetic average of a data set.
D) most common value of a data set.
فتح الحزمة
افتح القفل للوصول البطاقات البالغ عددها 151 في هذه المجموعة.
فتح الحزمة
k this deck
23
What is the interquartile range?
A) Q3 - Q1
B) Max - Min
C) Mean - Median
D) All values between Q1 and Q3
A) Q3 - Q1
B) Max - Min
C) Mean - Median
D) All values between Q1 and Q3
فتح الحزمة
افتح القفل للوصول البطاقات البالغ عددها 151 في هذه المجموعة.
فتح الحزمة
k this deck
24
How do we find the median if the number of observations in a data set is odd?
A) By averaging the first and the third quartile
B) By taking the middle value in the sorted data set
C) By averaging the minimum and maximum values
D) By taking the middle value in the sorted data set after eliminating outliers
A) By averaging the first and the third quartile
B) By taking the middle value in the sorted data set
C) By averaging the minimum and maximum values
D) By taking the middle value in the sorted data set after eliminating outliers
فتح الحزمة
افتح القفل للوصول البطاقات البالغ عددها 151 في هذه المجموعة.
فتح الحزمة
k this deck
25
The owner of a company has recently decided to raise the salary of one employee,who was already making the highest salary,by 20%.Which of the following is(are)expected to be affected by this raise?
A) Mean only
B) Median only
C) Mean and median only
D) Mean,median,and mode
A) Mean only
B) Median only
C) Mean and median only
D) Mean,median,and mode
فتح الحزمة
افتح القفل للوصول البطاقات البالغ عددها 151 في هذه المجموعة.
فتح الحزمة
k this deck
26
Geometric mean is greater than the arithmetic mean.
فتح الحزمة
افتح القفل للوصول البطاقات البالغ عددها 151 في هذه المجموعة.
فتح الحزمة
k this deck
27
Is it possible for a data set to have more than one mode?
A) No,there must always be a single mode,or else there is no mode.
B) Yes,if two or more values in a data set occur the same number of times.
C) Yes,if there are at least two different values in a data set,there is always more than one mode.
D) Yes,if two or more values in a data set occur with the most frequency and the frequency is greater than one.
فتح الحزمة
افتح القفل للوصول البطاقات البالغ عددها 151 في هذه المجموعة.
فتح الحزمة
k this deck
28
Is it possible for a data set to have no mode?
A) Yes,if two observations occur twice.
B) No,unless there is an odd number of observations.
C) No,if the data set is nonempty,there is always a mode.
D) Yes,if there are no observations that occur more than once.
A) Yes,if two observations occur twice.
B) No,unless there is an odd number of observations.
C) No,if the data set is nonempty,there is always a mode.
D) Yes,if there are no observations that occur more than once.
فتح الحزمة
افتح القفل للوصول البطاقات البالغ عددها 151 في هذه المجموعة.
فتح الحزمة
k this deck
29
The table below gives the deviations of a portfolio's annual total returns from its benchmark's annual returns,for a 6-year period ending in 2011. The arithmetic mean return and median return are the closest to _______.
A) mean = -2.00% and median = -4.28%.
B) mean = -2.00% and median = -1.67%.
C) mean = -1.67% and median = -0.56%.
D) mean = -1.67% and median = 0.56%
The arithmetic mean return and median return are the closest to _______.A) mean = -2.00% and median = -4.28%.
B) mean = -2.00% and median = -1.67%.
C) mean = -1.67% and median = -0.56%.
D) mean = -1.67% and median = 0.56%
فتح الحزمة
افتح القفل للوصول البطاقات البالغ عددها 151 في هذه المجموعة.
فتح الحزمة
k this deck
30
The Boom company has recently decided to raise the salaries of all employees by 10%.Which of the following is(are)expected to be affected by this raise?
A) Mean and mode only
B) Mean and median only
C) Mode and median only
D) Mean,median,and mode
A) Mean and mode only
B) Mean and median only
C) Mode and median only
D) Mean,median,and mode
فتح الحزمة
افتح القفل للوصول البطاقات البالغ عددها 151 في هذه المجموعة.
فتح الحزمة
k this deck
31
In quality control settings,businesses prefer a larger standard deviation,which is an indication of more consistency in the process.
فتح الحزمة
افتح القفل للوصول البطاقات البالغ عددها 151 في هذه المجموعة.
فتح الحزمة
k this deck
32
As of September 30,2011,the earnings per share,EPS,of five firms in the beverages industry are as follows: 1.13 2.41 1.52 1.40 0.41 The 25th percentile and the 75th percentile of the EPS are the closest to __________.
A) 0.77 and 1.97
B) 0.91 and 1.77
C) 1.77 and 0.91
D) 1.97 and 0.77
A) 0.77 and 1.97
B) 0.91 and 1.77
C) 1.77 and 0.91
D) 1.97 and 0.77
فتح الحزمة
افتح القفل للوصول البطاقات البالغ عددها 151 في هذه المجموعة.
فتح الحزمة
k this deck
33
The mode is defined as the _____________.
A) middle point in a data set.
B) geometric average of a data set.
C) arithmetic average of a data set.
D) most frequent value in a data set.
A) middle point in a data set.
B) geometric average of a data set.
C) arithmetic average of a data set.
D) most frequent value in a data set.
فتح الحزمة
افتح القفل للوصول البطاقات البالغ عددها 151 في هذه المجموعة.
فتح الحزمة
k this deck
34
Calculate the interquartile range from the following data: 1,2,4,5,10,12,18.
A) 5
B) 6
C) 10
D) 17
A) 5
B) 6
C) 10
D) 17
فتح الحزمة
افتح القفل للوصول البطاقات البالغ عددها 151 في هذه المجموعة.
فتح الحزمة
k this deck
35
In what way(s)is(are)the concept of geometric mean useful?
A) In evaluating investment returns
B) In calculating average growth rates
C) In assessing the dispersion of the data
D) Both in evaluating investment returns and in calculating average growth rates
A) In evaluating investment returns
B) In calculating average growth rates
C) In assessing the dispersion of the data
D) Both in evaluating investment returns and in calculating average growth rates
فتح الحزمة
افتح القفل للوصول البطاقات البالغ عددها 151 في هذه المجموعة.
فتح الحزمة
k this deck
36
Which of the following is the most influenced by outliers?
A) Mode
B) Median
C) 75th percentile
D) Arithmetic mean
A) Mode
B) Median
C) 75th percentile
D) Arithmetic mean
فتح الحزمة
افتح القفل للوصول البطاقات البالغ عددها 151 في هذه المجموعة.
فتح الحزمة
k this deck
37
When working with grouped data,the class median is the value in the middle of the class and can be found by taking the average of the endpoints for each class.
فتح الحزمة
افتح القفل للوصول البطاقات البالغ عددها 151 في هذه المجموعة.
فتح الحزمة
k this deck
38
Which of the following statements is most accurate when defining percentiles?
A) The pth percentile divides a data set into equal parts.
B) Approximately p% of the observations are greater than the pth percentile.
C) Approximately (100 - p)% of the observations are less than the pth percentile.
D) Approximately (100 - p)% of the observations are greater than the pth percentile.
فتح الحزمة
افتح القفل للوصول البطاقات البالغ عددها 151 في هذه المجموعة.
فتح الحزمة
k this deck
39
Consider the following data: 1,2,4,5,10,12,18.The 30th percentile is the closest to ____.
A) 2.0
B) 2.4
C) 2.8
D) 5.0
A) 2.0
B) 2.4
C) 2.8
D) 5.0
فتح الحزمة
افتح القفل للوصول البطاقات البالغ عددها 151 في هذه المجموعة.
فتح الحزمة
k this deck
40
The z-score has no units even though the original values will normally be expressed in units such as dollars,years,pounds,or calories.
فتح الحزمة
افتح القفل للوصول البطاقات البالغ عددها 151 في هذه المجموعة.
فتح الحزمة
k this deck
41
Consider a population with data values of 12 8 28 22 12 30 14.
The mode is ____.
A) 12
B) 14
C) 18
D) 22
The mode is ____.
A) 12
B) 14
C) 18
D) 22
فتح الحزمة
افتح القفل للوصول البطاقات البالغ عددها 151 في هذه المجموعة.
فتح الحزمة
k this deck
42
The sample data below shows the number of hours spent by five students over the weekend to prepare for Monday's Business Statistics exam. 3 12 2 3 5.
The interquartile range of the data is the closest to ________.
A) 4 hours
B) 6 hours
C) 10 hours
D) 12 hours
The interquartile range of the data is the closest to ________.
A) 4 hours
B) 6 hours
C) 10 hours
D) 12 hours
فتح الحزمة
افتح القفل للوصول البطاقات البالغ عددها 151 في هذه المجموعة.
فتح الحزمة
k this deck
43
Consider a population with data values of 12 8 28 22 12 30 14.
The population variance is the closest to ______.
A) 8.00
B) 8.64
C) 64.00
D) 74.67
The population variance is the closest to ______.
A) 8.00
B) 8.64
C) 64.00
D) 74.67
فتح الحزمة
افتح القفل للوصول البطاقات البالغ عددها 151 في هذه المجموعة.
فتح الحزمة
k this deck
44
The sample data below shows the number of hours spent by five students over the weekend to prepare for Monday's Business Statistics exam. 3 12 2 3 5.
The 75th percentile of the data is the closest to _________.
A) 3 hours
B) 4.5 hours
C) 8.5 hours
D) 10 hours
The 75th percentile of the data is the closest to _________.
A) 3 hours
B) 4.5 hours
C) 8.5 hours
D) 10 hours
فتح الحزمة
افتح القفل للوصول البطاقات البالغ عددها 151 في هذه المجموعة.
فتح الحزمة
k this deck
45
What is(are)the most widely used measure(s)of dispersion?
A) Range
B) Interquartile range
C) Variance and standard deviation
D) Covariance and the correlation coefficient
A) Range
B) Interquartile range
C) Variance and standard deviation
D) Covariance and the correlation coefficient
فتح الحزمة
افتح القفل للوصول البطاقات البالغ عددها 151 في هذه المجموعة.
فتح الحزمة
k this deck
46
The range is defined as ____________.
A) Q3 - Q1
B) Max - Q1
C) Max - Min
D) Max - Median
A) Q3 - Q1
B) Max - Q1
C) Max - Min
D) Max - Median
فتح الحزمة
افتح القفل للوصول البطاقات البالغ عددها 151 في هذه المجموعة.
فتح الحزمة
k this deck
47
An analyst gathered the following information about the net profit margins of companies in two industries: Compared with the other industry,the relative dispersion of net profit margins is smaller for Industry ___________________________________________.
A) B,because it has a smaller mean deviation.
B) B,because it has a smaller range of variation.
C) A,because it has a smaller standard deviation.
D) A,because it has a smaller coefficient of variation.
Compared with the other industry,the relative dispersion of net profit margins is smaller for Industry ___________________________________________.A) B,because it has a smaller mean deviation.
B) B,because it has a smaller range of variation.
C) A,because it has a smaller standard deviation.
D) A,because it has a smaller coefficient of variation.
فتح الحزمة
افتح القفل للوصول البطاقات البالغ عددها 151 في هذه المجموعة.
فتح الحزمة
k this deck
48
What is the relationship between the variance and the standard deviation?
A) The standard deviation is the absolute value of the variance.
B) The variance is the absolute value of the standard deviation.
C) The variance is the positive square root of the standard deviation.
D) The standard deviation is the positive square root of the variance.
A) The standard deviation is the absolute value of the variance.
B) The variance is the absolute value of the standard deviation.
C) The variance is the positive square root of the standard deviation.
D) The standard deviation is the positive square root of the variance.
فتح الحزمة
افتح القفل للوصول البطاقات البالغ عددها 151 في هذه المجموعة.
فتح الحزمة
k this deck
49
Which of the following statements about the mean absolute deviation (MAD)is themost accurate?
A) It is the square root of the standard deviation.
B) It can be a positive number or a negative number.
C) It is denominated in the same units as the original data.
D) It is the arithmetic mean of the squared deviations from the mean.
A) It is the square root of the standard deviation.
B) It can be a positive number or a negative number.
C) It is denominated in the same units as the original data.
D) It is the arithmetic mean of the squared deviations from the mean.
فتح الحزمة
افتح القفل للوصول البطاقات البالغ عددها 151 في هذه المجموعة.
فتح الحزمة
k this deck
50
Which of the following statements about variance is the most accurate?
A) Variance is the square root of the standard deviation.
B) Variance can be both,positive or negative.
C) Variance is denominated in the same units as the original data.
D) Varianceis the average of the squared deviations from the mean.
A) Variance is the square root of the standard deviation.
B) Variance can be both,positive or negative.
C) Variance is denominated in the same units as the original data.
D) Varianceis the average of the squared deviations from the mean.
فتح الحزمة
افتح القفل للوصول البطاقات البالغ عددها 151 في هذه المجموعة.
فتح الحزمة
k this deck
51
The sample data below shows the number of hours spent by five students over the weekend to prepare for Monday's Business Statistics exam. 3 12 2 3 5.
The sample standard deviation of the number of hours spent by the five students is the closest to _________.
A) 3.6 hours
B) 4.1 hours
C) 13.2 hours
D) 16.5 hours
The sample standard deviation of the number of hours spent by the five students is the closest to _________.
A) 3.6 hours
B) 4.1 hours
C) 13.2 hours
D) 16.5 hours
فتح الحزمة
افتح القفل للوصول البطاقات البالغ عددها 151 في هذه المجموعة.
فتح الحزمة
k this deck
52
A portfolio manager generates a 5% return in 2008,a 12% return in 2009,a negative 6% return in 2010,and a return of 2% (nonannualized)in the first quarter of 2011.The annualized return for the entire period is theclosest to _______.
A) 3.05%
B) 3.25%
C) 3.50%
D) 3.77%
A) 3.05%
B) 3.25%
C) 3.50%
D) 3.77%
فتح الحزمة
افتح القفل للوصول البطاقات البالغ عددها 151 في هذه المجموعة.
فتح الحزمة
k this deck
53
The following data represent monthly returns (in percent): -7.24 1.64 3.48 -2.49 9.30
The geometric mean return is the closest to ________.
A) -0.43%
B) 0.78%
C) 0.94%
D) 4.79%
The geometric mean return is the closest to ________.
A) -0.43%
B) 0.78%
C) 0.94%
D) 4.79%
فتح الحزمة
افتح القفل للوصول البطاقات البالغ عددها 151 في هذه المجموعة.
فتح الحزمة
k this deck
54
What is(are)characteristic(s)of the geometric mean?
A) It is always greater than the arithmetic mean.
B) It is the mathematical equivalent to the median.
C) It is always less than or equal to the arithmetic mean.
D) Both it is the mathematical equivalent to the median and it is always less than or equal to the arithmetic mean.
A) It is always greater than the arithmetic mean.
B) It is the mathematical equivalent to the median.
C) It is always less than or equal to the arithmetic mean.
D) Both it is the mathematical equivalent to the median and it is always less than or equal to the arithmetic mean.
فتح الحزمة
افتح القفل للوصول البطاقات البالغ عددها 151 في هذه المجموعة.
فتح الحزمة
k this deck
55
Consider a population with data values of 12 8 28 22 12 30 14.
The median is ____.
A) 12
B) 14
C) 18
D) 22
The median is ____.
A) 12
B) 14
C) 18
D) 22
فتح الحزمة
افتح القفل للوصول البطاقات البالغ عددها 151 في هذه المجموعة.
فتح الحزمة
k this deck
56
Sales for Adidas grew at a rate of 0.5196 in 2006,0.0213 in 2007,0.0485 in 2008,and -0.0387 in 2009.The average growth rate for Adidas during these four years is the closest to _______.
A) 3.49%
B) 11.83%
C) 13.77%
D) 14.02%
A) 3.49%
B) 11.83%
C) 13.77%
D) 14.02%
فتح الحزمة
افتح القفل للوصول البطاقات البالغ عددها 151 في هذه المجموعة.
فتح الحزمة
k this deck
57
The sample data below shows the number of hours spent by five students over the weekend to prepare for Monday's Business Statistics exam. 3 12 2 3 5.
The mean and the median of the numbers of hours spent by the five students are _______________.
A) 2 hours and 5 hours,respectively
B) 3 hours and 5 hours,respectively
C) 5 hours and 2 hours,respectively
D) 5 hours and 3 hours,respectively
The mean and the median of the numbers of hours spent by the five students are _______________.
A) 2 hours and 5 hours,respectively
B) 3 hours and 5 hours,respectively
C) 5 hours and 2 hours,respectively
D) 5 hours and 3 hours,respectively
فتح الحزمة
افتح القفل للوصول البطاقات البالغ عددها 151 في هذه المجموعة.
فتح الحزمة
k this deck
58
Consider a population with data values of 12 8 28 22 12 30 14.
The population standard deviation is the closest to _____.
A) 8.00
B) 8.64
C) 64.00
D) 74.67
The population standard deviation is the closest to _____.
A) 8.00
B) 8.64
C) 64.00
D) 74.67
فتح الحزمة
افتح القفل للوصول البطاقات البالغ عددها 151 في هذه المجموعة.
فتح الحزمة
k this deck
59
Total revenue for Apple Computers(in millions)was $42,905 in 2009,$65,225 in 2010,and $108,249 in 2011.The average growth rate of revenue during these three years is the closest to _______.
A) 36.13%
B) 39.33%
C) 58.84%
D) 58.99%
A) 36.13%
B) 39.33%
C) 58.84%
D) 58.99%
فتح الحزمة
افتح القفل للوصول البطاقات البالغ عددها 151 في هذه المجموعة.
فتح الحزمة
k this deck
60
Consider a population with data values of 12 8 28 22 12 30 14.
The population mean is ____.
A) 12.
B) 14.
C) 18.
D) 22.
The population mean is ____.
A) 12.
B) 14.
C) 18.
D) 22.
فتح الحزمة
افتح القفل للوصول البطاقات البالغ عددها 151 في هذه المجموعة.
فتح الحزمة
k this deck
61
A bowler's scores for a sample of six games were 172 168 188 190 172 182 174.
The sample standard deviation is the closest to _____.
A) 8.00
B) 8.64
C) 64.00
D) 74.67
The sample standard deviation is the closest to _____.
A) 8.00
B) 8.64
C) 64.00
D) 74.67
فتح الحزمة
افتح القفل للوصول البطاقات البالغ عددها 151 في هذه المجموعة.
فتح الحزمة
k this deck
62
A portfolio's annual total returns (in percent)for a five-year period are: -7.14 1.62 2.50 -2.50 9.27.
The median and the standard deviation for this sample are the closest to ______________.
A) 0.75 and 5.46
B) 1.62 and 5.46
C) 1.62 and 6.11
D) 2.50 and 6.11
The median and the standard deviation for this sample are the closest to ______________.
A) 0.75 and 5.46
B) 1.62 and 5.46
C) 1.62 and 6.11
D) 2.50 and 6.11
فتح الحزمة
افتح القفل للوصول البطاقات البالغ عددها 151 في هذه المجموعة.
فتح الحزمة
k this deck
63
The Sharpe ratio measures______________________________________.
A) the extra reward per unit of risk
B) the extra risk per unit of reward
C) the increase in mean per unit of risk
D) the extra variance per unit of reward
A) the extra reward per unit of risk
B) the extra risk per unit of reward
C) the increase in mean per unit of risk
D) the extra variance per unit of reward
فتح الحزمة
افتح القفل للوصول البطاقات البالغ عددها 151 في هذه المجموعة.
فتح الحزمة
k this deck
64
Professors at a local university earn an average salary of $80,000 with a standard deviation of $6,000.With the beginning of the next academic year,all professors will get a 2% raise.What will be the average and the standard deviation of their new salaries?
A) $80,000 and $6,120.
B) $81,600 and $6,000.
C) $81,600 and $6,120.
D) $82,000 and $6,200.
A) $80,000 and $6,120.
B) $81,600 and $6,000.
C) $81,600 and $6,120.
D) $82,000 and $6,200.
فتح الحزمة
افتح القفل للوصول البطاقات البالغ عددها 151 في هذه المجموعة.
فتح الحزمة
k this deck
65
The annual returns (in percent)for a sample of stocks in the technology industry over the past year are as follows: 4.2 -9.4 2.8 -16.0 -6.6.
The sample standard deviation is the closest to _____.
A) 7.59
B) 8.49
C) 57.61
D) 72.01
The sample standard deviation is the closest to _____.
A) 7.59
B) 8.49
C) 57.61
D) 72.01
فتح الحزمة
افتح القفل للوصول البطاقات البالغ عددها 151 في هذه المجموعة.
فتح الحزمة
k this deck
66
The annual returns (in percent)for a sample of stocks in the technology industry over the past year are as follows: 4.2 -9.4 2.8 -16.0 -6.6.
The median return is the closest to _____.
A) -6.6
B) -5
C) 0
D) 2.8
The median return is the closest to _____.
A) -6.6
B) -5
C) 0
D) 2.8
فتح الحزمة
افتح القفل للوصول البطاقات البالغ عددها 151 في هذه المجموعة.
فتح الحزمة
k this deck
67
A bowler's scores for a sample of six games were 172 168 188 190 172 182 174.
The bowler's modal score is _____.
A) 172
B) 174
C) 178
D) 190
The bowler's modal score is _____.
A) 172
B) 174
C) 178
D) 190
فتح الحزمة
افتح القفل للوصول البطاقات البالغ عددها 151 في هذه المجموعة.
فتح الحزمة
k this deck
68
A bowler's scores for a sample of six games were 172 168 188 190 172 182 174.
The bowler's average score is _____.
A) 172
B) 174
C) 178
D) 190
The bowler's average score is _____.
A) 172
B) 174
C) 178
D) 190
فتح الحزمة
افتح القفل للوصول البطاقات البالغ عددها 151 في هذه المجموعة.
فتح الحزمة
k this deck
69
The following table summarizes selected statistics for two portfolios for a 10-year period ending in 2006.Assume that the risk-free rate is 4% over this period. As measured by the Sharpe ratio,the fund with the superior risk-adjusted performance during this period is _________________________________________________________.
A) Fund A because it has a lower positive Sharpe ratio than Fund B
B) Fund B because it has a lower positive Sharpe ratio than Fund A
C) Fund A because it has a higher positive Sharpe ratio than Fund B
D) Fund B because it has a higher positive Sharpe ratio than Fund A
As measured by the Sharpe ratio,the fund with the superior risk-adjusted performance during this period is _________________________________________________________.A) Fund A because it has a lower positive Sharpe ratio than Fund B
B) Fund B because it has a lower positive Sharpe ratio than Fund A
C) Fund A because it has a higher positive Sharpe ratio than Fund B
D) Fund B because it has a higher positive Sharpe ratio than Fund A
فتح الحزمة
افتح القفل للوصول البطاقات البالغ عددها 151 في هذه المجموعة.
فتح الحزمة
k this deck
70
The advantage of using mean absolute deviation rather than variance as a measure of dispersion is that mean absolute deviation __________________________.
A) is less sensitive to extreme deviations
B) requires fewer observations to be a valid measure
C) is a relative measure rather than an absolute measure of risk
D) considers only unfavorable (negative)deviations from the mean
A) is less sensitive to extreme deviations
B) requires fewer observations to be a valid measure
C) is a relative measure rather than an absolute measure of risk
D) considers only unfavorable (negative)deviations from the mean
فتح الحزمة
افتح القفل للوصول البطاقات البالغ عددها 151 في هذه المجموعة.
فتح الحزمة
k this deck
71
The coefficient of variation is best described as ___________________________________.
A) a relative measure of dispersion
B) an absolute measure of dispersion
C) a relative measure of central location
D) an absolute measure of central location
A) a relative measure of dispersion
B) an absolute measure of dispersion
C) a relative measure of central location
D) an absolute measure of central location
فتح الحزمة
افتح القفل للوصول البطاقات البالغ عددها 151 في هذه المجموعة.
فتح الحزمة
k this deck
72
The mean return on equity (ROE)for a group of firms in an industry is 15% with a variance of 9%.The coefficient of variation of the industry's ROE is _____.
A) 0.2
B) 0.6
C) 1.7
D) 5.0
A) 0.2
B) 0.6
C) 1.7
D) 5.0
فتح الحزمة
افتح القفل للوصول البطاقات البالغ عددها 151 في هذه المجموعة.
فتح الحزمة
k this deck
73
As of September 30,2011,the earnings per share (EPS)of five firms in the biotechnology industry are 1.53 2.29 2.07 1.69 0.07.
The sample mean and the sample standard deviation are the closest to _______________.
A) 1.53 and 0.76
B) 1.53 and 0.87
C) 1.69 and 0.76
D) 1.69 and 0.87
The sample mean and the sample standard deviation are the closest to _______________.
A) 1.53 and 0.76
B) 1.53 and 0.87
C) 1.69 and 0.76
D) 1.69 and 0.87
فتح الحزمة
افتح القفل للوصول البطاقات البالغ عددها 151 في هذه المجموعة.
فتح الحزمة
k this deck
74
What is(are)the characteristic(s)of the coefficient of variation?
A) It adjusts for differences in the magnitude of means.
B) It has the same units of measurement as the observations.
C) It allows for direct comparisons across different data sets.
D) Both it adjusts for differences in the magnitude of means and it allows for direct comparisons across different data sets.
فتح الحزمة
افتح القفل للوصول البطاقات البالغ عددها 151 في هذه المجموعة.
فتح الحزمة
k this deck
75
A college professor collected data on the number of hours spent by his 100 students over the weekend to prepare for Monday's Business Statistics exam.He processed the data by Excel and the following incomplete output is available. The median is most likely to be ________________.
A) about 7 hours
B) less than 7 hours
C) greater than 7 hours
D) Cannot tell from the information provided
The median is most likely to be ________________.A) about 7 hours
B) less than 7 hours
C) greater than 7 hours
D) Cannot tell from the information provided
فتح الحزمة
افتح القفل للوصول البطاقات البالغ عددها 151 في هذه المجموعة.
فتح الحزمة
k this deck
76
The price to earnings ratio,also called the P/E ratio of a stock,is a measure of the price of a share relative to the annual net income per share earned by the firm.Suppose the P/Es for a firm's common stock during the past four quarters are 10,12,15,and 11,respectively.The standard deviation of the P/E ratio over the four quarters is ______.
A) 1.87
B) 2.16
C) 3.50
D) 4.67
A) 1.87
B) 2.16
C) 3.50
D) 4.67
فتح الحزمة
افتح القفل للوصول البطاقات البالغ عددها 151 في هذه المجموعة.
فتح الحزمة
k this deck
77
The table below gives statistics relating to a hypothetical 10-year record of two portfolios.Assume other statistics relating to these portfolios are the same and the risk-free rate is 3.5%.Using the coefficient of variation and the Sharpe ratio,the fund that is preferred in terms of relative risk and return per unit of risk is: ________________________________________. Using the coefficient of variation and the Sharpe ratio,the fund that is preferred in terms of relative risk and return per unit of risk is ______________________________________________.
A) Portfolio A becauseit has a higher coefficient of variation and a lower Sharpe ratio
B) Portfolio A because it has a lower coefficient of variation and a higher Sharpe ratio
C) Portfolio B because it has a higher coefficient of variation and a lower Sharpe ratio
D) Portfolio B because it has a lower coefficient of variation and a higher Sharper ratio
Using the coefficient of variation and the Sharpe ratio,the fund that is preferred in terms of relative risk and return per unit of risk is ______________________________________________.A) Portfolio A becauseit has a higher coefficient of variation and a lower Sharpe ratio
B) Portfolio A because it has a lower coefficient of variation and a higher Sharpe ratio
C) Portfolio B because it has a higher coefficient of variation and a lower Sharpe ratio
D) Portfolio B because it has a lower coefficient of variation and a higher Sharper ratio
فتح الحزمة
افتح القفل للوصول البطاقات البالغ عددها 151 في هذه المجموعة.
فتح الحزمة
k this deck
78
A bowler's scores for a sample of six games were 172 168 188 190 172 182 174.
The bowler's median score is _____.
A) 172
B) 174
C) 178
D) 190
The bowler's median score is _____.
A) 172
B) 174
C) 178
D) 190
فتح الحزمة
افتح القفل للوصول البطاقات البالغ عددها 151 في هذه المجموعة.
فتح الحزمة
k this deck
79
The annual returns (in percent)for a sample of stocks in the technology industry over the past year are as follows: 4.2 -9.4 2.8 -16.0 -6.6.
The average return is the closest to _____.
A) -6.6
B) -5
C) 0
D) 2.8
The average return is the closest to _____.
A) -6.6
B) -5
C) 0
D) 2.8
فتح الحزمة
افتح القفل للوصول البطاقات البالغ عددها 151 في هذه المجموعة.
فتح الحزمة
k this deck
80
A college professor collected data on the number of hours spent by his 100 students over the weekend to prepare for Monday's Business Statistics exam.He processed the data by Excel and the following incomplete output is available. The coefficient of variation in the data is ______.
A) 40%
B) 90%
C) 111%
D) 243%
The coefficient of variation in the data is ______.A) 40%
B) 90%
C) 111%
D) 243%
فتح الحزمة
افتح القفل للوصول البطاقات البالغ عددها 151 في هذه المجموعة.
فتح الحزمة
k this deck
فتح الحزمة
افتح القفل للوصول البطاقات البالغ عددها 151 في هذه المجموعة.


