Deck 8: Aggregate Expenditure and Equilibrium Output
ملء الشاشة (f)
سؤال
سؤال
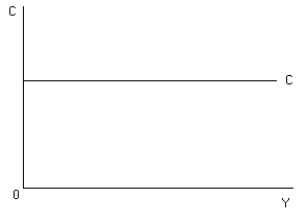
Explain the meaning of the consumption function depicted above. Why is this consumption function unrealistic?
سؤال
سؤال
سؤال
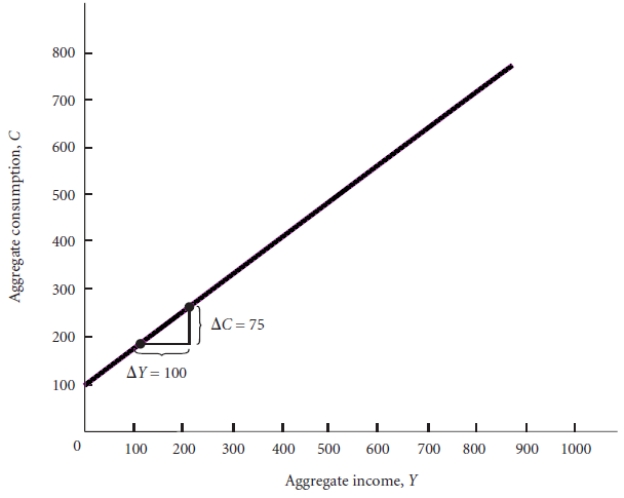 Figure 23.1
Using Figure 23.1 derive the equation for this consumption function.
سؤال
Fill in the table below assuming the consumption function has the following form: C = 500 + .9Y.

سؤال
سؤال
Fill in the consumption table below assuming that the marginal propensity to consume is constant. In addition, write the algebraic equation for the consumption function.


سؤال
سؤال
سؤال
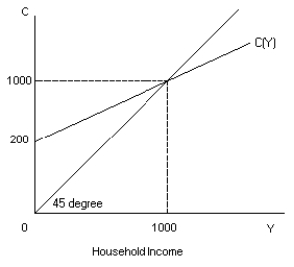
Assume the above consumption function for a hypothetical economy. Write out the algebraic equation for this function.
سؤال
سؤال

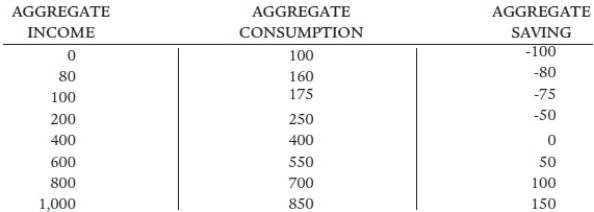
Using the above figure calculate the marginal propensity to consume between the aggregate income levels of $80 and $100. Also explain why this consumption function is linear.
سؤال
سؤال
سؤال
سؤال
سؤال
سؤال
Figure 23.1Using Figure 23.1 derive the equation for this saving function.
سؤال
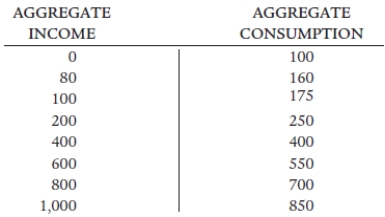 Figure 23.2
Using Figure 23.2 calculate aggregate saving at each income level.
سؤال
سؤال
سؤال
سؤال
سؤال
سؤال
سؤال
سؤال
Draw a consumption table where autonomous consumption is $200 and the marginal propensity to consume is .8. Make sure to start with an income level of $0 and increase by $100 each time up to an income level of $400. Without completing the table any further determine the level of income where consumption and income are equal. Prove this algebraically.

سؤال
سؤال
Assume consumption is represented by the following: C = 200 + .9Y. Also assume that planned investment (I) equals 300.
(a) Now, suppose the level of income is equal to 4000. What is the level of planned aggregate expenditures at this level of income?What is the value of any unplanned changes in inventories?
(b) Given the information, calculate the equilibrium level of income.
(c) Given the information, calculate the level of consumption and saving that occurs at the equilibrium level of income.
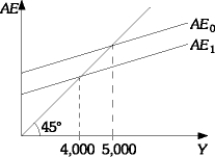
(d) Suppose planned investment falls by 100. Graphically illustrate using the AE - Y graph the effects of this reduction in planned investment on the economy. Also, calculate the new level of equilibrium income.
(a) AE = 200 + .9(4000) + 300 = 4100. Unplanned changes in inventories equal
(b) Y = 5000
(c) C = 4700 and S = 300
(d) Y = 4000
(a) Now, suppose the level of income is equal to 4000. What is the level of planned aggregate expenditures at this level of income?What is the value of any unplanned changes in inventories?
(b) Given the information, calculate the equilibrium level of income.
(c) Given the information, calculate the level of consumption and saving that occurs at the equilibrium level of income.
(d) Suppose planned investment falls by 100. Graphically illustrate using the AE - Y graph the effects of this reduction in planned investment on the economy. Also, calculate the new level of equilibrium income.
(a) AE = 200 + .9(4000) + 300 = 4100. Unplanned changes in inventories equal
(b) Y = 5000
(c) C = 4700 and S = 300
(d) Y = 4000
سؤال
Assume an economy with the following consumption and investment function:
C = 100 + .75Y
I = 25
Based on this information fill in the following table:
 Put an asterisk next to the aggregate output level that shows equilibrium.
C = 100 + .75Y
I = 25
Based on this information fill in the following table:
Put an asterisk next to the aggregate output level that shows equilibrium. سؤال
سؤال
سؤال
سؤال
سؤال
سؤال
سؤال
سؤال
سؤال
سؤال
سؤال
سؤال
سؤال
سؤال
سؤال
سؤال
سؤال
سؤال
سؤال
سؤال
سؤال
سؤال
سؤال
سؤال
سؤال
سؤال
سؤال

فتح الحزمة
قم بالتسجيل لفتح البطاقات في هذه المجموعة!
Unlock Deck
Unlock Deck
1/58
العب
ملء الشاشة (f)
Deck 8: Aggregate Expenditure and Equilibrium Output
1
Compare and contrast the MPC and the MPS. Also explain what these two figures must always add up to.
The MPC is the marginal propensity to consume. It is the fraction of an increase in income that is consumed. The MPS is the marginal propensity to save. It is the fraction of an increase in income that is saved. The MPC and the MPS must always sum to 1 since there are only two things that one can do with one's income - consume and save.
2
Explain the meaning of the consumption function depicted above. Why is this consumption function unrealistic?
This consumption function says that the level of consumption remains constant no matter what the level of income is. In other words, consumption is independent of the level of income, MPC = 0. In the real world we observe that households typically consume more as their income rises.
3
List four determinants of aggregate consumption.
Household income, household wealth, interest rates and households' expectations about the future.
4
Assume a consumption function that takes on the following algebraic form: C = $100 + .8Y. Assume that Y = $1000 what is the level of consumption at this income level.
فتح الحزمة
افتح القفل للوصول البطاقات البالغ عددها 58 في هذه المجموعة.
فتح الحزمة
k this deck
5
Figure 23.1Using Figure 23.1 derive the equation for this consumption function.
فتح الحزمة
افتح القفل للوصول البطاقات البالغ عددها 58 في هذه المجموعة.
فتح الحزمة
k this deck
6
Fill in the table below assuming the consumption function has the following form: C = 500 + .9Y.
فتح الحزمة
افتح القفل للوصول البطاقات البالغ عددها 58 في هذه المجموعة.
فتح الحزمة
k this deck
7
In the General Theory, Keynes argued that the amount of consumption undertaken by a household is directly related to its income. Explain what he meant.
فتح الحزمة
افتح القفل للوصول البطاقات البالغ عددها 58 في هذه المجموعة.
فتح الحزمة
k this deck
8
Fill in the consumption table below assuming that the marginal propensity to consume is constant. In addition, write the algebraic equation for the consumption function.
فتح الحزمة
افتح القفل للوصول البطاقات البالغ عددها 58 في هذه المجموعة.
فتح الحزمة
k this deck
9
Write out the equation for the consumption function in algebraic form and identify each component.
فتح الحزمة
افتح القفل للوصول البطاقات البالغ عددها 58 في هذه المجموعة.
فتح الحزمة
k this deck
10
What is the relationship between consumption and the following economic variables: household income, wealth, household's expectations about the future, and interest rates?
فتح الحزمة
افتح القفل للوصول البطاقات البالغ عددها 58 في هذه المجموعة.
فتح الحزمة
k this deck
11
Assume the above consumption function for a hypothetical economy. Write out the algebraic equation for this function.
فتح الحزمة
افتح القفل للوصول البطاقات البالغ عددها 58 في هذه المجموعة.
فتح الحزمة
k this deck
12
Assume a consumption function of the form C = 200 + .8Y. Derive the saving function and write out the algebraic representation.
فتح الحزمة
افتح القفل للوصول البطاقات البالغ عددها 58 في هذه المجموعة.
فتح الحزمة
k this deck
13
Using the above figure calculate the marginal propensity to consume between the aggregate income levels of $80 and $100. Also explain why this consumption function is linear.
فتح الحزمة
افتح القفل للوصول البطاقات البالغ عددها 58 في هذه المجموعة.
فتح الحزمة
k this deck
14
Explain what the aggregate consumption function is.
فتح الحزمة
افتح القفل للوصول البطاقات البالغ عددها 58 في هذه المجموعة.
فتح الحزمة
k this deck
15
Suppose the slope of the consumption function is .75 and there was an increase in income of $100. Calculate the increase in consumption.
فتح الحزمة
افتح القفل للوصول البطاقات البالغ عددها 58 في هذه المجموعة.
فتح الحزمة
k this deck
16
Critically evaluate the following statement. "People can spend more than their income by borrowing therefore the sum of the MPC and the MPS could actually be greater than one."
فتح الحزمة
افتح القفل للوصول البطاقات البالغ عددها 58 في هذه المجموعة.
فتح الحزمة
k this deck
17
Draw a graph of the consumption function and explain what the vertical intercept means and the slope. Make sure to label both axes.
فتح الحزمة
افتح القفل للوصول البطاقات البالغ عددها 58 في هذه المجموعة.
فتح الحزمة
k this deck
18
Define aggregate output.
فتح الحزمة
افتح القفل للوصول البطاقات البالغ عددها 58 في هذه المجموعة.
فتح الحزمة
k this deck
19
Figure 23.1Using Figure 23.1 derive the equation for this saving function.
فتح الحزمة
افتح القفل للوصول البطاقات البالغ عددها 58 في هذه المجموعة.
فتح الحزمة
k this deck
20
Figure 23.2Using Figure 23.2 calculate aggregate saving at each income level.
فتح الحزمة
افتح القفل للوصول البطاقات البالغ عددها 58 في هذه المجموعة.
فتح الحزمة
k this deck
21
Explain any differences between actual investment and planned investment. Also, is it possible for actual investment to be greater than planned investment? If so, explain.
فتح الحزمة
افتح القفل للوصول البطاقات البالغ عددها 58 في هذه المجموعة.
فتح الحزمة
k this deck
22
In 1995 the Apex television manufacturing company planned to invest $1,100,000 by building a brand new factory wing at a cost of $1,000,000 and increasing its inventories by $100,000 worth of television sets. However, by the end of the year the actual amount of investment for the company was $1,200,000. What could explain this apparent difference between the company's planned investment and actual investment?
فتح الحزمة
افتح القفل للوصول البطاقات البالغ عددها 58 في هذه المجموعة.
فتح الحزمة
k this deck
23
Assume a two sector economy where C = $100 + .9Y and I = $50. Calculate the equilibrium level of output for this hypothetical economy. What would the level of consumption be if the economy were operating at 1400? What would be the amount of unplanned investment at this level? In which direction would you expect the economy to move to at $1400 and why?
فتح الحزمة
افتح القفل للوصول البطاقات البالغ عددها 58 في هذه المجموعة.
فتح الحزمة
k this deck
24
Assume consumption is represented by the following: C = 400 + .5Y. Also assume that planned investment (I) equals 100.
فتح الحزمة
افتح القفل للوصول البطاقات البالغ عددها 58 في هذه المجموعة.
فتح الحزمة
k this deck
25
Assume the following saving function and investment function: S = -200 + .25Y and I = 25. Calculate the equilibrium output level.
فتح الحزمة
افتح القفل للوصول البطاقات البالغ عددها 58 في هذه المجموعة.
فتح الحزمة
k this deck
26
Explain the path to equilibrium when output is greater than planned spending.
فتح الحزمة
افتح القفل للوصول البطاقات البالغ عددها 58 في هذه المجموعة.
فتح الحزمة
k this deck
27
Assume the level of saving that would take place in an economy is - $200 even when aggregate output is zero. Also assume that the marginal propensity to save is .1. Derive the algebraic expression for the saving function and the consumption function.
فتح الحزمة
افتح القفل للوصول البطاقات البالغ عددها 58 في هذه المجموعة.
فتح الحزمة
k this deck
28
Draw a consumption table where autonomous consumption is $200 and the marginal propensity to consume is .8. Make sure to start with an income level of $0 and increase by $100 each time up to an income level of $400. Without completing the table any further determine the level of income where consumption and income are equal. Prove this algebraically.
فتح الحزمة
افتح القفل للوصول البطاقات البالغ عددها 58 في هذه المجموعة.
فتح الحزمة
k this deck
29
Planned aggregate expenditure (AE) equals consumption plus planned investment: AE = C + I. Discuss the conditions under which equilibrium in the goods market is achieved.
فتح الحزمة
افتح القفل للوصول البطاقات البالغ عددها 58 في هذه المجموعة.
فتح الحزمة
k this deck
30
Assume consumption is represented by the following: C = 200 + .9Y. Also assume that planned investment (I) equals 300.
(a) Now, suppose the level of income is equal to 4000. What is the level of planned aggregate expenditures at this level of income?What is the value of any unplanned changes in inventories?
(b) Given the information, calculate the equilibrium level of income.
(c) Given the information, calculate the level of consumption and saving that occurs at the equilibrium level of income.
(d) Suppose planned investment falls by 100. Graphically illustrate using the AE - Y graph the effects of this reduction in planned investment on the economy. Also, calculate the new level of equilibrium income.
(a) AE = 200 + .9(4000) + 300 = 4100. Unplanned changes in inventories equal
(b) Y = 5000
(c) C = 4700 and S = 300
(d) Y = 4000
فتح الحزمة
افتح القفل للوصول البطاقات البالغ عددها 58 في هذه المجموعة.
فتح الحزمة
k this deck
31
Assume an economy with the following consumption and investment function:
C = 100 + .75Y
I = 25
Based on this information fill in the following table:
Put an asterisk next to the aggregate output level that shows equilibrium.
C = 100 + .75Y
I = 25
Based on this information fill in the following table:
Put an asterisk next to the aggregate output level that shows equilibrium. فتح الحزمة
افتح القفل للوصول البطاقات البالغ عددها 58 في هذه المجموعة.
فتح الحزمة
k this deck
32
Assume the saving function for an economy is S = - 200 + .2Y. Derive the consumption function from this information and show your work.
فتح الحزمة
افتح القفل للوصول البطاقات البالغ عددها 58 في هذه المجموعة.
فتح الحزمة
k this deck
33
Assume planned investment is $50 billion and the economy is currently operating at $7 trillion. Calculate the level of aggregate expenditures and unintended inventories if the consumption level is $6.9 Trillion.
فتح الحزمة
افتح القفل للوصول البطاقات البالغ عددها 58 في هذه المجموعة.
فتح الحزمة
k this deck
34
Assume an economy in which saving is -$100 at an output level of zero and the slope of the saving schedule is 1/10. If the economy is in equilibrium at 1200 calculate the level of saving and investment
فتح الحزمة
افتح القفل للوصول البطاقات البالغ عددها 58 في هذه المجموعة.
فتح الحزمة
k this deck
35
Assume planned aggregate expenditure exceeds aggregate output (income). Explain what will happen to unplanned inventories and the adjustment process towards equilibrium output.
فتح الحزمة
افتح القفل للوصول البطاقات البالغ عددها 58 في هذه المجموعة.
فتح الحزمة
k this deck
36
In the simple Keynesian model an increase in consumer spending will increase investment, and a decrease in consumer spending will decrease investment. Critically evaluate this theory.
فتح الحزمة
افتح القفل للوصول البطاقات البالغ عددها 58 في هذه المجموعة.
فتح الحزمة
k this deck
37
Prove through the use of algebra that in a two sector economy saving must be equal to planned investment at the equilibrium level of output. (Hint: Remember that C + S = Y)
فتح الحزمة
افتح القفل للوصول البطاقات البالغ عددها 58 في هذه المجموعة.
فتح الحزمة
k this deck
38
What are the four determinants of consumption? Also, explain how a change in each would bring about a reduction in consumption.
فتح الحزمة
افتح القفل للوصول البطاقات البالغ عددها 58 في هذه المجموعة.
فتح الحزمة
k this deck
39
Determine what the level of unplanned investment would be under each of the following scenarios: a) aggregate output is greater than planned spending, b) aggregate output is equal to planned spending and c) aggregate output is less than planned spending.
فتح الحزمة
افتح القفل للوصول البطاقات البالغ عددها 58 في هذه المجموعة.
فتح الحزمة
k this deck
40
Define the significance of equilibrium in the macroeconomics goods market.
فتح الحزمة
افتح القفل للوصول البطاقات البالغ عددها 58 في هذه المجموعة.
فتح الحزمة
k this deck
41
Assume consumption is represented by the following: C = 400 + .75Y. Also assume that planned investment (I) equals 100.
فتح الحزمة
افتح القفل للوصول البطاقات البالغ عددها 58 في هذه المجموعة.
فتح الحزمة
k this deck
42
Suppose that an economy is operating at equilibrium and for some reason households begin to save a smaller fraction of their income (the marginal propensity to save falls). How will this affect equilibrium output in the future when planned investment rises and falls?
فتح الحزمة
افتح القفل للوصول البطاقات البالغ عددها 58 في هذه المجموعة.
فتح الحزمة
k this deck
43
Assume that one day everyone decides to spend $100 more than they typically would. Explain why this would not necessarily result in an increase in income or output.
فتح الحزمة
افتح القفل للوصول البطاقات البالغ عددها 58 في هذه المجموعة.
فتح الحزمة
k this deck
44
Define an exogenous variable.
فتح الحزمة
افتح القفل للوصول البطاقات البالغ عددها 58 في هذه المجموعة.
فتح الحزمة
k this deck
45
Explain how the following two equations can both be true:
multiplier = 1/MPS multiplier = 1/(1 - MPC)
multiplier = 1/MPS multiplier = 1/(1 - MPC)
فتح الحزمة
افتح القفل للوصول البطاقات البالغ عددها 58 في هذه المجموعة.
فتح الحزمة
k this deck
46
When planned aggregate expenditure exceeds aggregate output (income), there is an unplanned fall in inventories. Firms will increase output. This increased output leads to increased income and even more consumption. How long will this process continue?
فتح الحزمة
افتح القفل للوصول البطاقات البالغ عددها 58 في هذه المجموعة.
فتح الحزمة
k this deck
47
Algebraically derive the value of the multiplier assuming the basic form of the consumption function as C = a + bY where "a" is consumption where income is zero and "b" is the marginal propensity to consume. You may assume a two-sector private economy.
فتح الحزمة
افتح القفل للوصول البطاقات البالغ عددها 58 في هذه المجموعة.
فتح الحزمة
k this deck
48
Define the multiplier.
فتح الحزمة
افتح القفل للوصول البطاقات البالغ عددها 58 في هذه المجموعة.
فتح الحزمة
k this deck
49
Explain why the multiplier that is calculated in the textbook and the size of the multiplier in the real world are likely to be different. What are the two reasons?
فتح الحزمة
افتح القفل للوصول البطاقات البالغ عددها 58 في هذه المجموعة.
فتح الحزمة
k this deck
50
Assume a hypothetical economy where all income is consumed. Theoretically what is the value of the income multiplier in this case?
فتح الحزمة
افتح القفل للوصول البطاقات البالغ عددها 58 في هذه المجموعة.
فتح الحزمة
k this deck
51
Explain what effect an increase in the marginal propensity to save will have on the slope of the planned aggregate expenditures line and on the size of the multiplier.
فتح الحزمة
افتح القفل للوصول البطاقات البالغ عددها 58 في هذه المجموعة.
فتح الحزمة
k this deck
52
Why doesn't the multiplier process go on forever?
فتح الحزمة
افتح القفل للوصول البطاقات البالغ عددها 58 في هذه المجموعة.
فتح الحزمة
k this deck
53
Discuss some of the factors that would cause the actual multiplier to be different from 1/(1 - MPC).
فتح الحزمة
افتح القفل للوصول البطاقات البالغ عددها 58 في هذه المجموعة.
فتح الحزمة
k this deck
54
Suppose an economy is initially in equilibrium at $800 billion and investment increases by $10 billion. This causes the economy to expand to $1200 billion. Calculate the value of the multiplier.
فتح الحزمة
افتح القفل للوصول البطاقات البالغ عددها 58 في هذه المجموعة.
فتح الحزمة
k this deck
55
Assume that at every level of output households reduce their level of saving by the same absolute amount. Explain what impact if any this will have on the value of the multiplier.
فتح الحزمة
افتح القفل للوصول البطاقات البالغ عددها 58 في هذه المجموعة.
فتح الحزمة
k this deck
56
Explain what is meant by the multiplier and explain what variable (s) determines its size.
فتح الحزمة
افتح القفل للوصول البطاقات البالغ عددها 58 في هذه المجموعة.
فتح الحزمة
k this deck
57
Theoretically, what should happen to the value of the multiplier along a consumption function that is increasing at a decreasing rate?
فتح الحزمة
افتح القفل للوصول البطاقات البالغ عددها 58 في هذه المجموعة.
فتح الحزمة
k this deck
58
Suppose there is an economy in which aggregate expenditure is greater than aggregate output by $30 billion. In addition, firms react by increasing planned investment by $30 billion. Explain why this does not restore equilibrium.
فتح الحزمة
افتح القفل للوصول البطاقات البالغ عددها 58 في هذه المجموعة.
فتح الحزمة
k this deck
فتح الحزمة
افتح القفل للوصول البطاقات البالغ عددها 58 في هذه المجموعة.


