Deck 12: The Determination of Aggregate Output, the Price Level, and the Interest Rate
ملء الشاشة (f)
سؤال
سؤال
سؤال
سؤال
Refer to the information provided in Figure 12.2 below to answer the questions that follow. 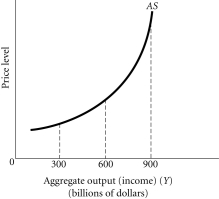 Figure 12.2
Refer to Figure 12.2.This economy reaches capacity at
A)$300 billion.
B)$600 billion.
C)$900 billion.
D)an output level that is indeterminate from this information because aggregate demand is not given.
Figure 12.2Refer to Figure 12.2.This economy reaches capacity at
A)$300 billion.
B)$600 billion.
C)$900 billion.
D)an output level that is indeterminate from this information because aggregate demand is not given.
سؤال
Refer to the information provided in Figure 12.1 below to answer the questions that follow.  Figure 12.1
Refer to Figure 12.1.At aggregate output levels above $1,500 billion,firms in this economy are most likely experiencing
A)costs increasing as fast as output prices.
B)costs lagging behind increases in output prices.
C)costs falling as prices output increase.
D)costs rising faster than output prices.
Figure 12.1Refer to Figure 12.1.At aggregate output levels above $1,500 billion,firms in this economy are most likely experiencing
A)costs increasing as fast as output prices.
B)costs lagging behind increases in output prices.
C)costs falling as prices output increase.
D)costs rising faster than output prices.
سؤال
سؤال
Refer to the information provided in Figure 12.1 below to answer the questions that follow. Figure 12.1
Refer to Figure 12.1.Between the output levels of $500 billion and $1,000 billion,the relationship between the price level and output is
A)constant.
B)negative.
C)positive.
D)indeterminate.
Figure 12.1Refer to Figure 12.1.Between the output levels of $500 billion and $1,000 billion,the relationship between the price level and output is
A)constant.
B)negative.
C)positive.
D)indeterminate.
سؤال
Refer to the information provided in Figure 12.1 below to answer the questions that follow. Figure 12.1
Refer to Figure 12.1.This economy reaches capacity at
A)$500 billion.
B)$1,000 billion.
C)$1,500 billion.
D)an output level that is indeterminate from this information because aggregate demand is not given.
Figure 12.1Refer to Figure 12.1.This economy reaches capacity at
A)$500 billion.
B)$1,000 billion.
C)$1,500 billion.
D)an output level that is indeterminate from this information because aggregate demand is not given.
سؤال
سؤال
سؤال
سؤال
Refer to the information provided in Figure 12.1 below to answer the questions that follow. Figure 12.1
Refer to Figure 12.1.At aggregate output levels below $500 billion,this economy is most likely experiencing
A)rapid increases in the growth rate of the money supply.
B)a boom.
C)excess demand.
D)excess capacity.
Figure 12.1Refer to Figure 12.1.At aggregate output levels below $500 billion,this economy is most likely experiencing
A)rapid increases in the growth rate of the money supply.
B)a boom.
C)excess demand.
D)excess capacity.
سؤال
Refer to the information provided in Figure 12.2 below to answer the questions that follow. Figure 12.2
Refer to Figure 12.2.Between the output levels of $300 billion and $600 billion,the relationship between the price level and output is
A)negative.
B)positive.
C)constant.
D)There is no relationship between the price level and output.
Figure 12.2Refer to Figure 12.2.Between the output levels of $300 billion and $600 billion,the relationship between the price level and output is
A)negative.
B)positive.
C)constant.
D)There is no relationship between the price level and output.
سؤال
سؤال
سؤال
سؤال
سؤال
سؤال
سؤال
سؤال
Refer to the information provided in Figure 12.3 below to answer the questions that follow. 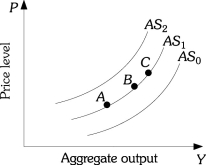 Figure 12.3
Refer to Figure 12.3.An increase in aggregate supply is represented by
A)a movement from Point B to Point A along AS1.
B)a movement from Point B to Point C along AS1.
C)a shift from AS1 to AS2.
D)a shift from AS1 to AS0.
Figure 12.3Refer to Figure 12.3.An increase in aggregate supply is represented by
A)a movement from Point B to Point A along AS1.
B)a movement from Point B to Point C along AS1.
C)a shift from AS1 to AS2.
D)a shift from AS1 to AS0.
سؤال
سؤال
سؤال
سؤال
Refer to the information provided in Figure 12.4 below to answer the questions that follow. 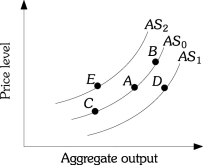 Figure 12.4
Refer to Figure 12.4.Suppose the economy is at Point A,an increase in the price level moves the economy to Point
A)E.
B)B.
C)C.
D)D.
Figure 12.4Refer to Figure 12.4.Suppose the economy is at Point A,an increase in the price level moves the economy to Point
A)E.
B)B.
C)C.
D)D.
سؤال
سؤال
سؤال
سؤال
Refer to the information provided in Figure 12.4 below to answer the questions that follow. Figure 12.4
Refer to Figure 12.4.Suppose the economy is at Point A,an increase in aggregate demand moves the economy to Point
A)E.
B)B.
C)C.
D)D.
Figure 12.4Refer to Figure 12.4.Suppose the economy is at Point A,an increase in aggregate demand moves the economy to Point
A)E.
B)B.
C)C.
D)D.
سؤال
Refer to the information provided in Figure 12.3 below to answer the questions that follow. Figure 12.3
Refer to Figure 12.3.Hurricane Katrina destroyed a large portion of the infrastructure along the Gulf of Mexico coast.This caused
A)the short-run aggregate supply curve to shift from AS1 to AS2.
B)the short-run aggregate supply curve to shift from AS1 to AS0.
C)the economy to move from Point B to Point A along AS1.
D)the economy to move from Point C to Point B along AS1.
Figure 12.3Refer to Figure 12.3.Hurricane Katrina destroyed a large portion of the infrastructure along the Gulf of Mexico coast.This caused
A)the short-run aggregate supply curve to shift from AS1 to AS2.
B)the short-run aggregate supply curve to shift from AS1 to AS0.
C)the economy to move from Point B to Point A along AS1.
D)the economy to move from Point C to Point B along AS1.
سؤال
سؤال
Refer to the information provided in Figure 12.3 below to answer the questions that follow. Figure 12.3
Refer to Figure 12.3.A decrease in aggregate supply is represented by
A)a movement from Point B to Point A along AS1.
B)a movement from Point B to Point C along AS1.
C)a shift from AS1 to AS2.
D)a shift from AS1 to AS0.
Figure 12.3Refer to Figure 12.3.A decrease in aggregate supply is represented by
A)a movement from Point B to Point A along AS1.
B)a movement from Point B to Point C along AS1.
C)a shift from AS1 to AS2.
D)a shift from AS1 to AS0.
سؤال
Refer to the information provided in Figure 12.4 below to answer the questions that follow. Figure 12.4
Refer to Figure 12.4.During the 1990s,many firms in the United States were investing in new capital.If the economy was originally at Point A,this would have caused a movement to Point
A)E.
B)B.
C)C.
D)D.
Figure 12.4Refer to Figure 12.4.During the 1990s,many firms in the United States were investing in new capital.If the economy was originally at Point A,this would have caused a movement to Point
A)E.
B)B.
C)C.
D)D.
سؤال
Refer to the information provided in Figure 12.4 below to answer the questions that follow. Figure 12.4
Refer to Figure 12.4.Which of the following causes the economy to move from Point A to Point E?
A)an oil embargo that increases the price of oil
B)technological progress
C)an influx of immigrants
D)an increase in the price level
Figure 12.4Refer to Figure 12.4.Which of the following causes the economy to move from Point A to Point E?
A)an oil embargo that increases the price of oil
B)technological progress
C)an influx of immigrants
D)an increase in the price level
سؤال
سؤال
سؤال
سؤال
سؤال
Refer to the information provided in Figure 12.3 below to answer the questions that follow. Figure 12.3
Refer to Figure 12.3.During the 1980s,many firms in the United States were not investing in new capital.This would have caused
A)the short-run aggregate supply curve to shift from AS1 to AS0.
B)the short-run aggregate supply curve to shift from AS1 to AS2.
C)the economy to move from Point B to Point A along AS1.
D)the economy to move from Point C to Point B along AS1.
Figure 12.3Refer to Figure 12.3.During the 1980s,many firms in the United States were not investing in new capital.This would have caused
A)the short-run aggregate supply curve to shift from AS1 to AS0.
B)the short-run aggregate supply curve to shift from AS1 to AS2.
C)the economy to move from Point B to Point A along AS1.
D)the economy to move from Point C to Point B along AS1.
سؤال
Refer to the information provided in Figure 12.4 below to answer the questions that follow. Figure 12.4
Refer to Figure 12.4.Suppose the economy is at Point A,an oil price increase could move the economy to Point
A)E.
B)B.
C)C.
D)D.
Figure 12.4Refer to Figure 12.4.Suppose the economy is at Point A,an oil price increase could move the economy to Point
A)E.
B)B.
C)C.
D)D.
سؤال
سؤال
سؤال
سؤال
سؤال
Refer to the information provided in Figure 12.5 below to answer the questions that follow. 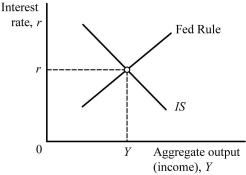 Figure 12.5
Refer to Figure 12.5.An increase in the price level shifts the ________ to the ________.
A)Fed rule;right
B)IS curve;right
C)IS curve;left
D)Fed rule;left
Figure 12.5Refer to Figure 12.5.An increase in the price level shifts the ________ to the ________.
A)Fed rule;right
B)IS curve;right
C)IS curve;left
D)Fed rule;left
سؤال
سؤال
Refer to the information provided in Figure 12.5 below to answer the questions that follow. Figure 12.5
Refer to Figure 12.5.An increase in the Z factors shifts the ________ to the ________.
A)Fed rule;left
B)Fed rule;right
C)IS curve;left
D)IS curve;right
Figure 12.5Refer to Figure 12.5.An increase in the Z factors shifts the ________ to the ________.
A)Fed rule;left
B)Fed rule;right
C)IS curve;left
D)IS curve;right
سؤال
سؤال
سؤال
سؤال
سؤال
سؤال
سؤال
Refer to the information provided in Figure 12.5 below to answer the questions that follow. Figure 12.5
Refer to Figure 12.5.As a result of ________,the equilibrium interest rate increases and the equilibrium output level decreases.
A)an increase in government spending
B)a decrease in government spending
C)an increase in the price level
D)a decrease in the price level
Figure 12.5Refer to Figure 12.5.As a result of ________,the equilibrium interest rate increases and the equilibrium output level decreases.
A)an increase in government spending
B)a decrease in government spending
C)an increase in the price level
D)a decrease in the price level
سؤال
سؤال
Refer to the information provided in Figure 12.5 below to answer the questions that follow. Figure 12.5
Refer to Figure 12.5.Which of the following combinations would definitely increase the equilibrium interest rate?
A)government spending increases and the price level increases
B)government spending increases and the price level decreases
C)government spending decreases and the price level increases
D)government spending decreases and the price level decreases
Figure 12.5Refer to Figure 12.5.Which of the following combinations would definitely increase the equilibrium interest rate?
A)government spending increases and the price level increases
B)government spending increases and the price level decreases
C)government spending decreases and the price level increases
D)government spending decreases and the price level decreases
سؤال
Refer to the information provided in Figure 12.5 below to answer the questions that follow. Figure 12.5
Refer to Figure 12.5.An increase in government spending shifts the ________ to the ________.
A)IS curve;left
B)Fed rule;right
C)IS curve;right
D)Fed rule;left
Figure 12.5Refer to Figure 12.5.An increase in government spending shifts the ________ to the ________.
A)IS curve;left
B)Fed rule;right
C)IS curve;right
D)Fed rule;left
سؤال
سؤال
Refer to the information provided in Figure 12.5 below to answer the questions that follow. Figure 12.5
Refer to Figure 12.5.As a result of ________,the equilibrium interest rate increases and the equilibrium output level increases.
A)an increase in government spending
B)a decrease in government spending
C)an increase in the price level
D)a decrease in the price level
Figure 12.5Refer to Figure 12.5.As a result of ________,the equilibrium interest rate increases and the equilibrium output level increases.
A)an increase in government spending
B)a decrease in government spending
C)an increase in the price level
D)a decrease in the price level
سؤال
سؤال
سؤال
سؤال
سؤال
سؤال
سؤال
سؤال
سؤال
سؤال
سؤال
سؤال
سؤال
سؤال
سؤال
سؤال
سؤال
سؤال
سؤال
سؤال
سؤال

فتح الحزمة
قم بالتسجيل لفتح البطاقات في هذه المجموعة!
Unlock Deck
Unlock Deck
1/119
العب
ملء الشاشة (f)
Deck 12: The Determination of Aggregate Output, the Price Level, and the Interest Rate
1
The quantity of output supplied at different price levels is represented by the
A)production function.
B)aggregate demand curve.
C)aggregate supply curve.
D)aggregate expenditures curve.
A)production function.
B)aggregate demand curve.
C)aggregate supply curve.
D)aggregate expenditures curve.
C
2
When the aggregate supply curve is vertical,which of the following is NOT true?
A)The economy is at capacity.
B)The economy is producing the maximum sustainable level of output.
C)Any increase in the price level will not cause an increase in aggregate output.
D)The economy is expanding quickly.
A)The economy is at capacity.
B)The economy is producing the maximum sustainable level of output.
C)Any increase in the price level will not cause an increase in aggregate output.
D)The economy is expanding quickly.
D
3
An increase in aggregate demand when the economy is operating at full capacity is likely to result in
A)an increase in both output and the overall price level.
B)an increase in output but no increase in the overall price level.
C)an increase in the overall price level but no increase in output.
D)no increase in either output or the overall price level.
A)an increase in both output and the overall price level.
B)an increase in output but no increase in the overall price level.
C)an increase in the overall price level but no increase in output.
D)no increase in either output or the overall price level.
C
4
Refer to the information provided in Figure 12.2 below to answer the questions that follow. Figure 12.2
Refer to Figure 12.2.This economy reaches capacity at
A)$300 billion.
B)$600 billion.
C)$900 billion.
D)an output level that is indeterminate from this information because aggregate demand is not given.
Figure 12.2Refer to Figure 12.2.This economy reaches capacity at
A)$300 billion.
B)$600 billion.
C)$900 billion.
D)an output level that is indeterminate from this information because aggregate demand is not given.
فتح الحزمة
افتح القفل للوصول البطاقات البالغ عددها 119 في هذه المجموعة.
فتح الحزمة
k this deck
5
Refer to the information provided in Figure 12.1 below to answer the questions that follow. Figure 12.1
Refer to Figure 12.1.At aggregate output levels above $1,500 billion,firms in this economy are most likely experiencing
A)costs increasing as fast as output prices.
B)costs lagging behind increases in output prices.
C)costs falling as prices output increase.
D)costs rising faster than output prices.
Figure 12.1Refer to Figure 12.1.At aggregate output levels above $1,500 billion,firms in this economy are most likely experiencing
A)costs increasing as fast as output prices.
B)costs lagging behind increases in output prices.
C)costs falling as prices output increase.
D)costs rising faster than output prices.
فتح الحزمة
افتح القفل للوصول البطاقات البالغ عددها 119 في هذه المجموعة.
فتح الحزمة
k this deck
6
The graph that shows the relationship between the aggregate quantity of output supplied by all the firms in an economy and the overall price level is
A)the aggregate supply curve.
B)the aggregate production function.
C)the production possibilities frontier.
D)the aggregate demand curve.
A)the aggregate supply curve.
B)the aggregate production function.
C)the production possibilities frontier.
D)the aggregate demand curve.
فتح الحزمة
افتح القفل للوصول البطاقات البالغ عددها 119 في هذه المجموعة.
فتح الحزمة
k this deck
7
Refer to the information provided in Figure 12.1 below to answer the questions that follow. Figure 12.1
Refer to Figure 12.1.Between the output levels of $500 billion and $1,000 billion,the relationship between the price level and output is
A)constant.
B)negative.
C)positive.
D)indeterminate.
Figure 12.1Refer to Figure 12.1.Between the output levels of $500 billion and $1,000 billion,the relationship between the price level and output is
A)constant.
B)negative.
C)positive.
D)indeterminate.
فتح الحزمة
افتح القفل للوصول البطاقات البالغ عددها 119 في هذه المجموعة.
فتح الحزمة
k this deck
8
Refer to the information provided in Figure 12.1 below to answer the questions that follow. Figure 12.1
Refer to Figure 12.1.This economy reaches capacity at
A)$500 billion.
B)$1,000 billion.
C)$1,500 billion.
D)an output level that is indeterminate from this information because aggregate demand is not given.
Figure 12.1Refer to Figure 12.1.This economy reaches capacity at
A)$500 billion.
B)$1,000 billion.
C)$1,500 billion.
D)an output level that is indeterminate from this information because aggregate demand is not given.
فتح الحزمة
افتح القفل للوصول البطاقات البالغ عددها 119 في هذه المجموعة.
فتح الحزمة
k this deck
9
An increase in the price level is likely to increase the aggregate amount of output supplied in the short run because
A)interest rate is high in the short-run.
B)wages are sticky in the short-run.
C)wages change in the short-run.
D)the aggregate supply curve is vertical in the short-run.
A)interest rate is high in the short-run.
B)wages are sticky in the short-run.
C)wages change in the short-run.
D)the aggregate supply curve is vertical in the short-run.
فتح الحزمة
افتح القفل للوصول البطاقات البالغ عددها 119 في هذه المجموعة.
فتح الحزمة
k this deck
10
If the economy is operating way below capacity,an increase in aggregate demand causes a ________ change in the price level and ________ change in output.
A)big;big
B)big;small
C)small;big
D)small;small
A)big;big
B)big;small
C)small;big
D)small;small
فتح الحزمة
افتح القفل للوصول البطاقات البالغ عددها 119 في هذه المجموعة.
فتح الحزمة
k this deck
11
If the economy is operating on the relatively vertical segment of the aggregate supply curve,an increase in aggregate demand causes a ________ change in the price level and a ________ change in output.
A)small;small
B)big;big
C)big;small
D)small;big
A)small;small
B)big;big
C)big;small
D)small;big
فتح الحزمة
افتح القفل للوصول البطاقات البالغ عددها 119 في هذه المجموعة.
فتح الحزمة
k this deck
12
Refer to the information provided in Figure 12.1 below to answer the questions that follow. Figure 12.1
Refer to Figure 12.1.At aggregate output levels below $500 billion,this economy is most likely experiencing
A)rapid increases in the growth rate of the money supply.
B)a boom.
C)excess demand.
D)excess capacity.
Figure 12.1Refer to Figure 12.1.At aggregate output levels below $500 billion,this economy is most likely experiencing
A)rapid increases in the growth rate of the money supply.
B)a boom.
C)excess demand.
D)excess capacity.
فتح الحزمة
افتح القفل للوصول البطاقات البالغ عددها 119 في هذه المجموعة.
فتح الحزمة
k this deck
13
Refer to the information provided in Figure 12.2 below to answer the questions that follow. Figure 12.2
Refer to Figure 12.2.Between the output levels of $300 billion and $600 billion,the relationship between the price level and output is
A)negative.
B)positive.
C)constant.
D)There is no relationship between the price level and output.
Figure 12.2Refer to Figure 12.2.Between the output levels of $300 billion and $600 billion,the relationship between the price level and output is
A)negative.
B)positive.
C)constant.
D)There is no relationship between the price level and output.
فتح الحزمة
افتح القفل للوصول البطاقات البالغ عددها 119 في هذه المجموعة.
فتح الحزمة
k this deck
14
What determines the slope of the aggregate supply curve is
A)how fast the price of factors of production respond to changes in the price level.
B)how much more the economy can produce without any change in the price level.
C)how fast the output level changes after a technological advance.
D)none of the above
A)how fast the price of factors of production respond to changes in the price level.
B)how much more the economy can produce without any change in the price level.
C)how fast the output level changes after a technological advance.
D)none of the above
فتح الحزمة
افتح القفل للوصول البطاقات البالغ عددها 119 في هذه المجموعة.
فتح الحزمة
k this deck
15
When the economy is producing at full capacity,the aggregate supply curve becomes
A)horizontal.
B)downward sloping.
C)vertical.
D)upward sloping.
A)horizontal.
B)downward sloping.
C)vertical.
D)upward sloping.
فتح الحزمة
افتح القفل للوصول البطاقات البالغ عددها 119 في هذه المجموعة.
فتح الحزمة
k this deck
16
If input prices changed at exactly the same rate as output prices,the aggregate supply curve would be
A)vertical.
B)upward sloping.
C)horizontal.
D)downward sloping.
A)vertical.
B)upward sloping.
C)horizontal.
D)downward sloping.
فتح الحزمة
افتح القفل للوصول البطاقات البالغ عددها 119 في هذه المجموعة.
فتح الحزمة
k this deck
17
When the aggregate supply curve is horizontal,
A)many firms are likely to have excess capacity.
B)the economy is close to full capacity.
C)resources are being utilized at full capacity.
D)the prices level increases with additional production.
A)many firms are likely to have excess capacity.
B)the economy is close to full capacity.
C)resources are being utilized at full capacity.
D)the prices level increases with additional production.
فتح الحزمة
افتح القفل للوصول البطاقات البالغ عددها 119 في هذه المجموعة.
فتح الحزمة
k this deck
18
A movement down the aggregate supply curve is caused by a(n)
A)decrease in aggregate supply.
B)increase in aggregate supply.
C)decrease in the price level.
D)increase in the price level.
A)decrease in aggregate supply.
B)increase in aggregate supply.
C)decrease in the price level.
D)increase in the price level.
فتح الحزمة
افتح القفل للوصول البطاقات البالغ عددها 119 في هذه المجموعة.
فتح الحزمة
k this deck
19
The aggregate supply curve
A)is the sum of the individual supply curves in the economy.
B)is a market supply curve.
C)embodies the same logic that lies behind an individual firm's supply curve.
D)relates output with the price level.
A)is the sum of the individual supply curves in the economy.
B)is a market supply curve.
C)embodies the same logic that lies behind an individual firm's supply curve.
D)relates output with the price level.
فتح الحزمة
افتح القفل للوصول البطاقات البالغ عددها 119 في هذه المجموعة.
فتح الحزمة
k this deck
20
An increase in aggregate demand when the economy is operating at high levels of output is likely to result in
A)a large increase in both output and the overall price level.
B)an increase in the overall price level but little or no increase in output.
C)an increase in output but little or no increase in the overall price level.
D)little or no increase in either output or the overall price level.
A)a large increase in both output and the overall price level.
B)an increase in the overall price level but little or no increase in output.
C)an increase in output but little or no increase in the overall price level.
D)little or no increase in either output or the overall price level.
فتح الحزمة
افتح القفل للوصول البطاقات البالغ عددها 119 في هذه المجموعة.
فتح الحزمة
k this deck
21
Refer to the information provided in Figure 12.3 below to answer the questions that follow. Figure 12.3
Refer to Figure 12.3.An increase in aggregate supply is represented by
A)a movement from Point B to Point A along AS1.
B)a movement from Point B to Point C along AS1.
C)a shift from AS1 to AS2.
D)a shift from AS1 to AS0.
Figure 12.3Refer to Figure 12.3.An increase in aggregate supply is represented by
A)a movement from Point B to Point A along AS1.
B)a movement from Point B to Point C along AS1.
C)a shift from AS1 to AS2.
D)a shift from AS1 to AS0.
فتح الحزمة
افتح القفل للوصول البطاقات البالغ عددها 119 في هذه المجموعة.
فتح الحزمة
k this deck
22
Which of the following would cause the short-run aggregate supply curve to shift to the right?
A)higher energy prices
B)an increase in taxes
C)increases in government regulation
D)retired workers reentering the labor force
A)higher energy prices
B)an increase in taxes
C)increases in government regulation
D)retired workers reentering the labor force
فتح الحزمة
افتح القفل للوصول البطاقات البالغ عددها 119 في هذه المجموعة.
فتح الحزمة
k this deck
23
An oil price increase would
A)increase aggregate demand.
B)decrease short-run aggregate supply.
C)decrease aggregate demand.
D)increase short-run aggregate supply.
A)increase aggregate demand.
B)decrease short-run aggregate supply.
C)decrease aggregate demand.
D)increase short-run aggregate supply.
فتح الحزمة
افتح القفل للوصول البطاقات البالغ عددها 119 في هذه المجموعة.
فتح الحزمة
k this deck
24
An increase in the price of a key input in production,like oil,increases aggregate supply.
فتح الحزمة
افتح القفل للوصول البطاقات البالغ عددها 119 في هذه المجموعة.
فتح الحزمة
k this deck
25
Refer to the information provided in Figure 12.4 below to answer the questions that follow. Figure 12.4
Refer to Figure 12.4.Suppose the economy is at Point A,an increase in the price level moves the economy to Point
A)E.
B)B.
C)C.
D)D.
Figure 12.4Refer to Figure 12.4.Suppose the economy is at Point A,an increase in the price level moves the economy to Point
A)E.
B)B.
C)C.
D)D.
فتح الحزمة
افتح القفل للوصول البطاقات البالغ عددها 119 في هذه المجموعة.
فتح الحزمة
k this deck
26
Coal is used as a source of energy in many manufacturing processes.Assume a long strike by coal miners reduced the supply of coal and increased the price of coal.This would cause
A)the short-run aggregate supply curve to shift to the right.
B)the short-run aggregate supply curve to become flatter.
C)the short-run aggregate supply curve to shift to the left.
D)the short-run aggregate supply curve to become nearly vertical at all levels of output.
A)the short-run aggregate supply curve to shift to the right.
B)the short-run aggregate supply curve to become flatter.
C)the short-run aggregate supply curve to shift to the left.
D)the short-run aggregate supply curve to become nearly vertical at all levels of output.
فتح الحزمة
افتح القفل للوصول البطاقات البالغ عددها 119 في هذه المجموعة.
فتح الحزمة
k this deck
27
If input prices change at exactly the same rate as output prices,the aggregate supply curve will be vertical.
فتح الحزمة
افتح القفل للوصول البطاقات البالغ عددها 119 في هذه المجموعة.
فتح الحزمة
k this deck
28
If there is a decrease in the percentage of employees whose wages adjust automatically with changes in the price level,the aggregate supply curve will become
A)steeper.
B)flatter.
C)horizontal.
D)vertical.
A)steeper.
B)flatter.
C)horizontal.
D)vertical.
فتح الحزمة
افتح القفل للوصول البطاقات البالغ عددها 119 في هذه المجموعة.
فتح الحزمة
k this deck
29
Refer to the information provided in Figure 12.4 below to answer the questions that follow. Figure 12.4
Refer to Figure 12.4.Suppose the economy is at Point A,an increase in aggregate demand moves the economy to Point
A)E.
B)B.
C)C.
D)D.
Figure 12.4Refer to Figure 12.4.Suppose the economy is at Point A,an increase in aggregate demand moves the economy to Point
A)E.
B)B.
C)C.
D)D.
فتح الحزمة
افتح القفل للوصول البطاقات البالغ عددها 119 في هذه المجموعة.
فتح الحزمة
k this deck
30
Refer to the information provided in Figure 12.3 below to answer the questions that follow. Figure 12.3
Refer to Figure 12.3.Hurricane Katrina destroyed a large portion of the infrastructure along the Gulf of Mexico coast.This caused
A)the short-run aggregate supply curve to shift from AS1 to AS2.
B)the short-run aggregate supply curve to shift from AS1 to AS0.
C)the economy to move from Point B to Point A along AS1.
D)the economy to move from Point C to Point B along AS1.
Figure 12.3Refer to Figure 12.3.Hurricane Katrina destroyed a large portion of the infrastructure along the Gulf of Mexico coast.This caused
A)the short-run aggregate supply curve to shift from AS1 to AS2.
B)the short-run aggregate supply curve to shift from AS1 to AS0.
C)the economy to move from Point B to Point A along AS1.
D)the economy to move from Point C to Point B along AS1.
فتح الحزمة
افتح القفل للوصول البطاقات البالغ عددها 119 في هذه المجموعة.
فتح الحزمة
k this deck
31
All of the following shift the short-run aggregate supply curve EXCEPT
A)a change in the price level.
B)a change in the price of oil.
C)a change in the price of raw material.
D)a change in wages as a result of a labor strike.
A)a change in the price level.
B)a change in the price of oil.
C)a change in the price of raw material.
D)a change in wages as a result of a labor strike.
فتح الحزمة
افتح القفل للوصول البطاقات البالغ عددها 119 في هذه المجموعة.
فتح الحزمة
k this deck
32
Refer to the information provided in Figure 12.3 below to answer the questions that follow. Figure 12.3
Refer to Figure 12.3.A decrease in aggregate supply is represented by
A)a movement from Point B to Point A along AS1.
B)a movement from Point B to Point C along AS1.
C)a shift from AS1 to AS2.
D)a shift from AS1 to AS0.
Figure 12.3Refer to Figure 12.3.A decrease in aggregate supply is represented by
A)a movement from Point B to Point A along AS1.
B)a movement from Point B to Point C along AS1.
C)a shift from AS1 to AS2.
D)a shift from AS1 to AS0.
فتح الحزمة
افتح القفل للوصول البطاقات البالغ عددها 119 في هذه المجموعة.
فتح الحزمة
k this deck
33
Refer to the information provided in Figure 12.4 below to answer the questions that follow. Figure 12.4
Refer to Figure 12.4.During the 1990s,many firms in the United States were investing in new capital.If the economy was originally at Point A,this would have caused a movement to Point
A)E.
B)B.
C)C.
D)D.
Figure 12.4Refer to Figure 12.4.During the 1990s,many firms in the United States were investing in new capital.If the economy was originally at Point A,this would have caused a movement to Point
A)E.
B)B.
C)C.
D)D.
فتح الحزمة
افتح القفل للوصول البطاقات البالغ عددها 119 في هذه المجموعة.
فتح الحزمة
k this deck
34
Refer to the information provided in Figure 12.4 below to answer the questions that follow. Figure 12.4
Refer to Figure 12.4.Which of the following causes the economy to move from Point A to Point E?
A)an oil embargo that increases the price of oil
B)technological progress
C)an influx of immigrants
D)an increase in the price level
Figure 12.4Refer to Figure 12.4.Which of the following causes the economy to move from Point A to Point E?
A)an oil embargo that increases the price of oil
B)technological progress
C)an influx of immigrants
D)an increase in the price level
فتح الحزمة
افتح القفل للوصول البطاقات البالغ عددها 119 في هذه المجموعة.
فتح الحزمة
k this deck
35
If the price level falls,the aggregate supply decreases as a result of the aggregate demand curve shifting left.
فتح الحزمة
افتح القفل للوصول البطاقات البالغ عددها 119 في هذه المجموعة.
فتح الحزمة
k this deck
36
The rationale underlying policies to deregulate the economy is that these policies would
A)increase aggregate demand.
B)decrease short-run aggregate supply.
C)decrease aggregate demand.
D)increase short-run aggregate supply.
A)increase aggregate demand.
B)decrease short-run aggregate supply.
C)decrease aggregate demand.
D)increase short-run aggregate supply.
فتح الحزمة
افتح القفل للوصول البطاقات البالغ عددها 119 في هذه المجموعة.
فتح الحزمة
k this deck
37
If there is an increase in the percentage of employees whose wages adjust automatically with changes in the price level,the aggregate supply curve will become
A)steeper.
B)flatter.
C)horizontal.
D)vertical.
A)steeper.
B)flatter.
C)horizontal.
D)vertical.
فتح الحزمة
افتح القفل للوصول البطاقات البالغ عددها 119 في هذه المجموعة.
فتح الحزمة
k this deck
38
If the United States were to pass legislation that would make it easier for people to emigrate to the United States,this would cause
A)the short-run aggregate supply curve to become nearly vertical at all levels of output.
B)the short-run aggregate supply curve to shift to the left.
C)the short-run aggregate supply curve to become flatter.
D)the short-run aggregate supply curve to shift to the right.
A)the short-run aggregate supply curve to become nearly vertical at all levels of output.
B)the short-run aggregate supply curve to shift to the left.
C)the short-run aggregate supply curve to become flatter.
D)the short-run aggregate supply curve to shift to the right.
فتح الحزمة
افتح القفل للوصول البطاقات البالغ عددها 119 في هذه المجموعة.
فتح الحزمة
k this deck
39
Refer to the information provided in Figure 12.3 below to answer the questions that follow. Figure 12.3
Refer to Figure 12.3.During the 1980s,many firms in the United States were not investing in new capital.This would have caused
A)the short-run aggregate supply curve to shift from AS1 to AS0.
B)the short-run aggregate supply curve to shift from AS1 to AS2.
C)the economy to move from Point B to Point A along AS1.
D)the economy to move from Point C to Point B along AS1.
Figure 12.3Refer to Figure 12.3.During the 1980s,many firms in the United States were not investing in new capital.This would have caused
A)the short-run aggregate supply curve to shift from AS1 to AS0.
B)the short-run aggregate supply curve to shift from AS1 to AS2.
C)the economy to move from Point B to Point A along AS1.
D)the economy to move from Point C to Point B along AS1.
فتح الحزمة
افتح القفل للوصول البطاقات البالغ عددها 119 في هذه المجموعة.
فتح الحزمة
k this deck
40
Refer to the information provided in Figure 12.4 below to answer the questions that follow. Figure 12.4
Refer to Figure 12.4.Suppose the economy is at Point A,an oil price increase could move the economy to Point
A)E.
B)B.
C)C.
D)D.
Figure 12.4Refer to Figure 12.4.Suppose the economy is at Point A,an oil price increase could move the economy to Point
A)E.
B)B.
C)C.
D)D.
فتح الحزمة
افتح القفل للوصول البطاقات البالغ عددها 119 في هذه المجموعة.
فتح الحزمة
k this deck
41
The level of aggregate output demanded falls when the price level rises,because the resulting increase in the interest rate will lead to
A)higher investment spending and higher consumption spending.
B)lower investment spending and higher consumption spending.
C)higher investment spending and lower consumption spending.
D)lower investment spending and lower consumption spending.
A)higher investment spending and higher consumption spending.
B)lower investment spending and higher consumption spending.
C)higher investment spending and lower consumption spending.
D)lower investment spending and lower consumption spending.
فتح الحزمة
افتح القفل للوصول البطاقات البالغ عددها 119 في هذه المجموعة.
فتح الحزمة
k this deck
42
An increase in government purchases shifts the ________ curve to the ________.
A)aggregate demand;left
B)aggregate supply;left
C)aggregate demand;right
D)aggregate supply;right
A)aggregate demand;left
B)aggregate supply;left
C)aggregate demand;right
D)aggregate supply;right
فتح الحزمة
افتح القفل للوصول البطاقات البالغ عددها 119 في هذه المجموعة.
فتح الحزمة
k this deck
43
Which of the following equations represents equilibrium in the goods market?
A)AE = I(r)
B)Y = AD + AS
C)Y = S + I
D)AE = C + I + G
A)AE = I(r)
B)Y = AD + AS
C)Y = S + I
D)AE = C + I + G
فتح الحزمة
افتح القفل للوصول البطاقات البالغ عددها 119 في هذه المجموعة.
فتح الحزمة
k this deck
44
A decrease in taxes on business investments will increase aggregate supply.
فتح الحزمة
افتح القفل للوصول البطاقات البالغ عددها 119 في هذه المجموعة.
فتح الحزمة
k this deck
45
Refer to the information provided in Figure 12.5 below to answer the questions that follow. Figure 12.5
Refer to Figure 12.5.An increase in the price level shifts the ________ to the ________.
A)Fed rule;right
B)IS curve;right
C)IS curve;left
D)Fed rule;left
Figure 12.5Refer to Figure 12.5.An increase in the price level shifts the ________ to the ________.
A)Fed rule;right
B)IS curve;right
C)IS curve;left
D)Fed rule;left
فتح الحزمة
افتح القفل للوصول البطاقات البالغ عددها 119 في هذه المجموعة.
فتح الحزمة
k this deck
46
The slope of the IS curve is ________ and the slope of the Fed rule is ________.
A)positive;positive
B)positive;negative
C)negative;positive
D)negative;negative
A)positive;positive
B)positive;negative
C)negative;positive
D)negative;negative
فتح الحزمة
افتح القفل للوصول البطاقات البالغ عددها 119 في هذه المجموعة.
فتح الحزمة
k this deck
47
Refer to the information provided in Figure 12.5 below to answer the questions that follow. Figure 12.5
Refer to Figure 12.5.An increase in the Z factors shifts the ________ to the ________.
A)Fed rule;left
B)Fed rule;right
C)IS curve;left
D)IS curve;right
Figure 12.5Refer to Figure 12.5.An increase in the Z factors shifts the ________ to the ________.
A)Fed rule;left
B)Fed rule;right
C)IS curve;left
D)IS curve;right
فتح الحزمة
افتح القفل للوصول البطاقات البالغ عددها 119 في هذه المجموعة.
فتح الحزمة
k this deck
48
The aggregate demand curve shows a ________ relationship between ________ and aggregate output ________.
A)positive;the interest rate;demanded
B)negative;the price level;supplied
C)positive;the price level;demanded
D)negative;the price level;demanded
A)positive;the interest rate;demanded
B)negative;the price level;supplied
C)positive;the price level;demanded
D)negative;the price level;demanded
فتح الحزمة
افتح القفل للوصول البطاقات البالغ عددها 119 في هذه المجموعة.
فتح الحزمة
k this deck
49
The quantity of aggregate output demanded will fall if
A)government spending increases.
B)the price level increases.
C)Aggregate supply increases.
D)net taxes are reduced.
A)government spending increases.
B)the price level increases.
C)Aggregate supply increases.
D)net taxes are reduced.
فتح الحزمة
افتح القفل للوصول البطاقات البالغ عددها 119 في هذه المجموعة.
فتح الحزمة
k this deck
50
Which of the following sequence of events follows a rise in the discount rate?
A)r↓ ⇒ I↓ ⇒ AE↓ ⇒ Y↑
B)r↑ ⇒ I↓ ⇒ AE↓ ⇒ Y↓
C)r↓ ⇒ I↑ ⇒ AE↑ ⇒ Y↑
D)r↑ ⇒ I↑ ⇒ AE↑ ⇒ Y↑
A)r↓ ⇒ I↓ ⇒ AE↓ ⇒ Y↑
B)r↑ ⇒ I↓ ⇒ AE↓ ⇒ Y↓
C)r↓ ⇒ I↑ ⇒ AE↑ ⇒ Y↑
D)r↑ ⇒ I↑ ⇒ AE↑ ⇒ Y↑
فتح الحزمة
افتح القفل للوصول البطاقات البالغ عددها 119 في هذه المجموعة.
فتح الحزمة
k this deck
51
The aggregate demand curve shows that,ceteris paribus,
A)at higher price levels,total quantity of output demanded is higher.
B)at lower price levels,total quantity of output supplied is lower.
C)at lower price levels,total quantity of output demanded is higher.
D)at higher price levels,total quantity of output supplied is lower.
A)at higher price levels,total quantity of output demanded is higher.
B)at lower price levels,total quantity of output supplied is lower.
C)at lower price levels,total quantity of output demanded is higher.
D)at higher price levels,total quantity of output supplied is lower.
فتح الحزمة
افتح القفل للوصول البطاقات البالغ عددها 119 في هذه المجموعة.
فتح الحزمة
k this deck
52
The aggregate demand curve
A)is an upward sloping curve.
B)is a downward sloping curve.
C)may slope upward or downward.
D)is horizontal.
A)is an upward sloping curve.
B)is a downward sloping curve.
C)may slope upward or downward.
D)is horizontal.
فتح الحزمة
افتح القفل للوصول البطاقات البالغ عددها 119 في هذه المجموعة.
فتح الحزمة
k this deck
53
When the interest rate is high,planned investment is ________ so output is ________.
A)high;high
B)high;low
C)low;high
D)low;low
A)high;high
B)high;low
C)low;high
D)low;low
فتح الحزمة
افتح القفل للوصول البطاقات البالغ عددها 119 في هذه المجموعة.
فتح الحزمة
k this deck
54
Refer to the information provided in Figure 12.5 below to answer the questions that follow. Figure 12.5
Refer to Figure 12.5.As a result of ________,the equilibrium interest rate increases and the equilibrium output level decreases.
A)an increase in government spending
B)a decrease in government spending
C)an increase in the price level
D)a decrease in the price level
Figure 12.5Refer to Figure 12.5.As a result of ________,the equilibrium interest rate increases and the equilibrium output level decreases.
A)an increase in government spending
B)a decrease in government spending
C)an increase in the price level
D)a decrease in the price level
فتح الحزمة
افتح القفل للوصول البطاقات البالغ عددها 119 في هذه المجموعة.
فتح الحزمة
k this deck
55
An increase in the price level will cause a decrease in the aggregate amount of output supplied.
فتح الحزمة
افتح القفل للوصول البطاقات البالغ عددها 119 في هذه المجموعة.
فتح الحزمة
k this deck
56
Refer to the information provided in Figure 12.5 below to answer the questions that follow. Figure 12.5
Refer to Figure 12.5.Which of the following combinations would definitely increase the equilibrium interest rate?
A)government spending increases and the price level increases
B)government spending increases and the price level decreases
C)government spending decreases and the price level increases
D)government spending decreases and the price level decreases
Figure 12.5Refer to Figure 12.5.Which of the following combinations would definitely increase the equilibrium interest rate?
A)government spending increases and the price level increases
B)government spending increases and the price level decreases
C)government spending decreases and the price level increases
D)government spending decreases and the price level decreases
فتح الحزمة
افتح القفل للوصول البطاقات البالغ عددها 119 في هذه المجموعة.
فتح الحزمة
k this deck
57
Refer to the information provided in Figure 12.5 below to answer the questions that follow. Figure 12.5
Refer to Figure 12.5.An increase in government spending shifts the ________ to the ________.
A)IS curve;left
B)Fed rule;right
C)IS curve;right
D)Fed rule;left
Figure 12.5Refer to Figure 12.5.An increase in government spending shifts the ________ to the ________.
A)IS curve;left
B)Fed rule;right
C)IS curve;right
D)Fed rule;left
فتح الحزمة
افتح القفل للوصول البطاقات البالغ عددها 119 في هذه المجموعة.
فتح الحزمة
k this deck
58
In an economy,when the price level falls,consumers and firms buy more goods and services.This relationship is represented by the
A)aggregate expenditures curve.
B)aggregate demand curve.
C)short-run aggregate supply curve.
D)long-run aggregate supply curve.
A)aggregate expenditures curve.
B)aggregate demand curve.
C)short-run aggregate supply curve.
D)long-run aggregate supply curve.
فتح الحزمة
افتح القفل للوصول البطاقات البالغ عددها 119 في هذه المجموعة.
فتح الحزمة
k this deck
59
Refer to the information provided in Figure 12.5 below to answer the questions that follow. Figure 12.5
Refer to Figure 12.5.As a result of ________,the equilibrium interest rate increases and the equilibrium output level increases.
A)an increase in government spending
B)a decrease in government spending
C)an increase in the price level
D)a decrease in the price level
Figure 12.5Refer to Figure 12.5.As a result of ________,the equilibrium interest rate increases and the equilibrium output level increases.
A)an increase in government spending
B)a decrease in government spending
C)an increase in the price level
D)a decrease in the price level
فتح الحزمة
افتح القفل للوصول البطاقات البالغ عددها 119 في هذه المجموعة.
فتح الحزمة
k this deck
60
Which of the following sequence of events follows an open market purchase by the Fed?
A)r↑ ⇒ I↓ ⇒ AE↓ ⇒ Y↓
B)r↑ ⇒ I↑ ⇒ AE↓ ⇒ Y↑
C)r↓ ⇒ I↑ ⇒ AE↑ ⇒ Y↑
D)r↓ ⇒ I↓ ⇒ AE↓ ⇒ Y↓
A)r↑ ⇒ I↓ ⇒ AE↓ ⇒ Y↓
B)r↑ ⇒ I↑ ⇒ AE↓ ⇒ Y↑
C)r↓ ⇒ I↑ ⇒ AE↑ ⇒ Y↑
D)r↓ ⇒ I↓ ⇒ AE↓ ⇒ Y↓
فتح الحزمة
افتح القفل للوصول البطاقات البالغ عددها 119 في هذه المجموعة.
فتح الحزمة
k this deck
61
If the combination r = 10% and Y = $200 billion is on the IS curve,we know that the combination r = 10% and Y = $300 billion would represent
A)the IS curve shifting to the right.
B)the IS curve shifting to the left.
C)a movement up the IS curve.
D)a movement down the IS curve.
A)the IS curve shifting to the right.
B)the IS curve shifting to the left.
C)a movement up the IS curve.
D)a movement down the IS curve.
فتح الحزمة
افتح القفل للوصول البطاقات البالغ عددها 119 في هذه المجموعة.
فتح الحزمة
k this deck
62
The aggregate demand curve shows that at higher price levels the total quantity of output demanded is greater.
فتح الحزمة
افتح القفل للوصول البطاقات البالغ عددها 119 في هذه المجموعة.
فتح الحزمة
k this deck
63
An increase in the price level cause aggregate demand to increase.
فتح الحزمة
افتح القفل للوصول البطاقات البالغ عددها 119 في هذه المجموعة.
فتح الحزمة
k this deck
64
A higher interest rate increases both planned investment and consumption spending.
فتح الحزمة
افتح القفل للوصول البطاقات البالغ عددها 119 في هذه المجموعة.
فتح الحزمة
k this deck
65
The IS curve shows combinations of output and interest rates consistent with equilibrium in the goods market.
فتح الحزمة
افتح القفل للوصول البطاقات البالغ عددها 119 في هذه المجموعة.
فتح الحزمة
k this deck
66
Other things equal,an increase in government spending shifts
A)the AD curve to the left.
B)the AD curve to the right.
C)the AS curve to the left.
D)the AS curve to the right.
A)the AD curve to the left.
B)the AD curve to the right.
C)the AS curve to the left.
D)the AS curve to the right.
فتح الحزمة
افتح القفل للوصول البطاقات البالغ عددها 119 في هذه المجموعة.
فتح الحزمة
k this deck
67
________ shifts the Fed rule to the left.
A)An increase in government spending
B)A decrease in government spending
C)A decrease in the price level
D)An increase in the Z factors
A)An increase in government spending
B)A decrease in government spending
C)A decrease in the price level
D)An increase in the Z factors
فتح الحزمة
افتح القفل للوصول البطاقات البالغ عددها 119 في هذه المجموعة.
فتح الحزمة
k this deck
68
Other things equal,an increase in government spending ________ the equilibrium interest rate and ________ equilibrium output.
A)increases;increases
B)increases;decreases
C)decreases;increases
D)decreases;decreases
A)increases;increases
B)increases;decreases
C)decreases;increases
D)decreases;decreases
فتح الحزمة
افتح القفل للوصول البطاقات البالغ عددها 119 في هذه المجموعة.
فتح الحزمة
k this deck
69
The Federal Reserve's policy to "lean against the wind" means that
A)when output is high,the Fed sets a high interest rate.
B)when price levels are high,the Fed sets a low interest rate.
C)when output is low,the Fed sets a high interest rate.
D)when price levels are low,the Fed sets a high interest rate.
A)when output is high,the Fed sets a high interest rate.
B)when price levels are high,the Fed sets a low interest rate.
C)when output is low,the Fed sets a high interest rate.
D)when price levels are low,the Fed sets a high interest rate.
فتح الحزمة
افتح القفل للوصول البطاقات البالغ عددها 119 في هذه المجموعة.
فتح الحزمة
k this deck
70
________ shifts the Fed rule to the right.
A)An increase in government spending
B)A decrease in government spending
C)A decrease in the price level
D)An increase in the Z factors
A)An increase in government spending
B)A decrease in government spending
C)A decrease in the price level
D)An increase in the Z factors
فتح الحزمة
افتح القفل للوصول البطاقات البالغ عددها 119 في هذه المجموعة.
فتح الحزمة
k this deck
71
A decrease in government spending shifts aggregate demand to the left.
فتح الحزمة
افتح القفل للوصول البطاقات البالغ عددها 119 في هذه المجموعة.
فتح الحزمة
k this deck
72
Other things equal,an increase in the Z factors ________ the equilibrium interest rate and ________ equilibrium output.
A)increases;increases
B)increases;decreases
C)decreases;increases
D)decreases;decreases
A)increases;increases
B)increases;decreases
C)decreases;increases
D)decreases;decreases
فتح الحزمة
افتح القفل للوصول البطاقات البالغ عددها 119 في هذه المجموعة.
فتح الحزمة
k this deck
73
An increase in the price level shifts the IS curve to the left.
فتح الحزمة
افتح القفل للوصول البطاقات البالغ عددها 119 في هذه المجموعة.
فتح الحزمة
k this deck
74
If government spending increases,then the IS curve shifts to the right.
فتح الحزمة
افتح القفل للوصول البطاقات البالغ عددها 119 في هذه المجموعة.
فتح الحزمة
k this deck
75
The aggregate demand curve is the sum of all demand curves of all goods and services in the economy.
فتح الحزمة
افتح القفل للوصول البطاقات البالغ عددها 119 في هذه المجموعة.
فتح الحزمة
k this deck
76
The Federal Reserve's policy to "lean against the wind" means that
A)interest rates are decreased as the economy expands.
B)reserve requirements are decreased as the economy expands.
C)reserve requirements are decreased significantly during an economic expansion.
D)interest rates are increased gradually as the economy expands.
A)interest rates are decreased as the economy expands.
B)reserve requirements are decreased as the economy expands.
C)reserve requirements are decreased significantly during an economic expansion.
D)interest rates are increased gradually as the economy expands.
فتح الحزمة
افتح القفل للوصول البطاقات البالغ عددها 119 في هذه المجموعة.
فتح الحزمة
k this deck
77
Other things equal,an increase in the price level ________ the equilibrium interest rate and ________ equilibrium output.
A)increases;increases
B)increases;decreases
C)decreases;increases
D)decreases;decreases
A)increases;increases
B)increases;decreases
C)decreases;increases
D)decreases;decreases
فتح الحزمة
افتح القفل للوصول البطاقات البالغ عددها 119 في هذه المجموعة.
فتح الحزمة
k this deck
78
Other things equal,an increase in the Z factors shifts
A)the AD curve to the left.
B)the AD curve to the right.
C)the AS curve to the left.
D)the AS curve to the right.
A)the AD curve to the left.
B)the AD curve to the right.
C)the AS curve to the left.
D)the AS curve to the right.
فتح الحزمة
افتح القفل للوصول البطاقات البالغ عددها 119 في هذه المجموعة.
فتح الحزمة
k this deck
79
________ shifts the IS curve to the left.
A)An increase in government spending
B)A decrease in government spending
C)A decrease in the price level
D)An increase in the Z factors
A)An increase in government spending
B)A decrease in government spending
C)A decrease in the price level
D)An increase in the Z factors
فتح الحزمة
افتح القفل للوصول البطاقات البالغ عددها 119 في هذه المجموعة.
فتح الحزمة
k this deck
80
If the combination r = 5% and Y = $100 billion is on the Fed rule line,we know that the combination r = 7% and Y = $100 billion would represent
A)the Fed rule shifting to the right.
B)the Fed rule shifting to the left.
C)a movement up the Fed rule.
D)a movement down the Fed rule.
A)the Fed rule shifting to the right.
B)the Fed rule shifting to the left.
C)a movement up the Fed rule.
D)a movement down the Fed rule.
فتح الحزمة
افتح القفل للوصول البطاقات البالغ عددها 119 في هذه المجموعة.
فتح الحزمة
k this deck
فتح الحزمة
افتح القفل للوصول البطاقات البالغ عددها 119 في هذه المجموعة.


