Deck 11: Performing the One-Sample T-Test and Testing Correlation Coefficients
ملء الشاشة (f)
سؤال
سؤال
For a two-tailed test with = 0.05,the  value is
A)either +1.96 or -1.96.
B)both +1.96 and -1.96.
C)either +1.645 or -1.645.
D)different for each df.
value isA)either +1.96 or -1.96.
B)both +1.96 and -1.96.
C)either +1.645 or -1.645.
D)different for each df.
سؤال
A developmental psychologist interested in the development of color perception presented 20 one-month-old infants with a pair of color forms.One form had two colors and the other had one.If the infants preferred to look at the form with two colors above chance level (50%),they can perceive colors.The mean percentage of times the infants preferred the two-color form was 53.15 (  ).What is
  ?
?
A)0.83
B)0.98
C)3.72
D)4.39
).What is ?A)0.83
B)0.98
C)3.72
D)4.39
سؤال
For 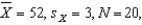 and
and 
 _____ and
  _____ for a two-tailed test with
  .
.
A)2.981;2.093
B)2.093;2.981
C)-2.981;-2.093
D)-2.093;-2.981
and _____ and _____ for a two-tailed test with .A)2.981;2.093
B)2.093;2.981
C)-2.981;-2.093
D)-2.093;-2.981
سؤال
Degrees of freedom (df)for the one-sample t-test is equal to
A) .
.
B)N.
C)N - 1.
D) .
.
A)
.B)N.
C)N - 1.
D)
. سؤال
For 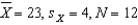 ,and
,and  ,what is
  ?
?
A)
B)
C)
D)
,and ,what is ?A)
B)
C)
D)
سؤال
سؤال
Which of the following is one of the assumptions of a one-sample t-test?
A)The obtained scores are on an ordinal or interval scale.
B)The population standard deviation is estimated by computing .
.
C)The population standard deviation is known.
D)The population distribution is skewed.
A)The obtained scores are on an ordinal or interval scale.
B)The population standard deviation is estimated by computing
.C)The population standard deviation is known.
D)The population distribution is skewed.
سؤال
Unless we use the correct  from the t-distribution for the appropriate N,
A)we will fail to reject .
.
B)we will always reject .
.
C)the probability of making a Type I error will increase.
D)the probability of making a Type I error will not equal .
from the t-distribution for the appropriate N,A)we will fail to reject
.B)we will always reject
.C)the probability of making a Type I error will increase.
D)the probability of making a Type I error will not equal .
سؤال
How is the t-distribution defined?
A)The distribution of all possible values of t
B)How far the sample mean is from the µ of the sampling distribution in estimated standard error units
C)The distribution of all possible values of t for random sample means selected from the raw score population described by
D)The distribution of all possible values of t for random sample means selected from the raw score population described by
سؤال
Using the data given below,perform a two-tailed t-test to compare the sample mean to  .Use
.Use  . 38 40 41 37 35 38 41
39 34 35 38 42 44 37
A)2.160 < 2.601,Fail to reject
B)2.601 > 2.160,Reject
C)-2.160 > -2.601,Reject
D)-2.601 < -2.160,Fail to reject
.Use . 38 40 41 37 35 38 4139 34 35 38 42 44 37
A)2.160 < 2.601,Fail to reject
B)2.601 > 2.160,Reject
C)-2.160 > -2.601,Reject
D)-2.601 < -2.160,Fail to reject
سؤال
What happens to the t-distribution as the sample size increases?
A)The t-distribution appears less and less like a normal distribution.
B)The t-distribution appears more and more like a normal distribution.
C)The shape of the t-distribution is unaffected.
D) becomes nearer to the true value of µ.
A)The t-distribution appears less and less like a normal distribution.
B)The t-distribution appears more and more like a normal distribution.
C)The shape of the t-distribution is unaffected.
D)
becomes nearer to the true value of µ. سؤال
Which of the following is the formula for the  in a single-sample t-test?
A)
B)
C)
D)
in a single-sample t-test?A)
B)
C)
D)
سؤال
Using the data given below,perform a one-tailed t-test with  .Use
.Use  . 74 73 75 70 71 70 72
74 75 74 72 70 71 73
A)-3.21 < -1.771,p < 0.05
B)3.21 > 1.771,p < 0.05
C)-1.771 < -3.21,p < 0.05
D)1.771 < -3.21,p > 0.05
.Use . 74 73 75 70 71 70 7274 75 74 72 70 71 73
A)-3.21 < -1.771,p < 0.05
B)3.21 > 1.771,p < 0.05
C)-1.771 < -3.21,p < 0.05
D)1.771 < -3.21,p > 0.05
سؤال
For 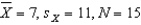 ,and
,and  ,what is
  ?
?
A)
B)
C)
D)
,and ,what is ?A)
B)
C)
D)
سؤال
Which of the following assumptions is common to both the z-test and the one-sample t-test?
A)Alpha is selected to be 0.01.
B)The raw score population forms a normal distribution,and the population mean and standard deviation are known.
C)The standard deviation of the raw score population is estimated by .
.
D)There is one random sample of interval or ratio scores.
A)Alpha is selected to be 0.01.
B)The raw score population forms a normal distribution,and the population mean and standard deviation are known.
C)The standard deviation of the raw score population is estimated by
.D)There is one random sample of interval or ratio scores.
سؤال
What is  for a one-tailed test for a negative
  when 30 participants are tested? Use = 0.05.
A)-1.697
B)-1.699
C) 2.042
D) 2.045
for a one-tailed test for a negative when 30 participants are tested? Use = 0.05.A)-1.697
B)-1.699
C) 2.042
D) 2.045
سؤال
سؤال
What is  ?
?
A)The estimated population standard deviation
B)The population standard deviation
C)The estimated standard error of the mean
D)The standard error of the mean
?A)The estimated population standard deviation
B)The population standard deviation
C)The estimated standard error of the mean
D)The standard error of the mean
سؤال
For 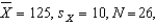 and
and 
 _____ and
  _____ for a one-tailed test with
  ,and
,and  .
.
A)-1.530;2.485
B)-1.530;-2.485
C)-2.485;1.530
D)-2.485;-1.530
and _____ and _____ for a one-tailed test with ,and .A)-1.530;2.485
B)-1.530;-2.485
C)-2.485;1.530
D)-2.485;-1.530
سؤال
سؤال
سؤال
سؤال
سؤال
If all other factors are held constant,increasing the level of confidence will have what kind of effect on the width of a confidence interval?
A)Increase it
B)Decrease it
C)Increase it or decrease it depending on whether is positive or negative
D)Have no effect on it
A)Increase it
B)Decrease it
C)Increase it or decrease it depending on whether
is positive or negativeD)Have no effect on it
سؤال
Some people claim that psychology is common sense.If this is true,then students who have not taken psychology courses should be able to predict the outcomes of experiments as well as psychology majors.If it is not,nonpsychology students should perform worse than psychology students.Psychology students typically predict outcomes with = 75% accuracy.A sample of 15 nonpsychology students predicted with  accuracy.The
  .What is the 95% confidence interval for nonpsychology students?
A)54.22 65.78
B)54.26 65.75
C)55.25 64.75
D)69.22 80.78
accuracy.The .What is the 95% confidence interval for nonpsychology students?A)54.22 65.78
B)54.26 65.75
C)55.25 64.75
D)69.22 80.78
سؤال
What does the shape of any particular sampling distribution of a correlation coefficient depend upon?
A)df
B)µ
C)r
D)
A)df
B)µ
C)r
D)
سؤال
سؤال
A two-tailed t-test was conducted for 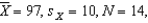 and
and  .Using
 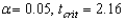 was compared to
  .What is the correct 95% confidence interval for
  ?
?
A)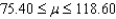
B)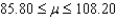
C)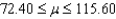
D)A confidence interval should not be constructed because the t-test was not significant.
and .Using was compared to .What is the correct 95% confidence interval for ?A)
B)
C)
D)A confidence interval should not be constructed because the t-test was not significant.
سؤال
A two-tailed t-test was conducted for 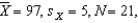 and
and  .Using
 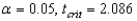 was compared to
  .What is the correct 95% confidence interval for
  ?
?
A)
B)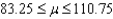
C)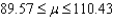
D)A confidence interval should not be constructed because the t-test was not significant.
and .Using was compared to .What is the correct 95% confidence interval for ?A)
B)
C)
D)A confidence interval should not be constructed because the t-test was not significant.
سؤال
Suppose you conduct an experiment with 20 subjects and the  turns out to be 0.69,which is not statistically significant.Which of the following is the correct way to report your results?
A) = 0.69,p > 0.05
B)t(20)= 0.69,p < 0.05
C)t(19)= 0.69,p < 0.05
D)t(19)= 0.69,p > 0.05
turns out to be 0.69,which is not statistically significant.Which of the following is the correct way to report your results?A)
= 0.69,p > 0.05B)t(20)= 0.69,p < 0.05
C)t(19)= 0.69,p < 0.05
D)t(19)= 0.69,p > 0.05
سؤال
سؤال
سؤال
سؤال
سؤال
Suppose you conduct an experiment with 24 subjects and your  turns out to be 2.92,which is statistically significant.Which of the following is the correct way to report your results?
A) = 2.92,p < 0.05
B)t(24)= 2.92,p < 0.05
C)t(23)= 2.92,p > 0.05
D)t(23)= 2.92,p < 0.05
turns out to be 2.92,which is statistically significant.Which of the following is the correct way to report your results?A)
= 2.92,p < 0.05B)t(24)= 2.92,p < 0.05
C)t(23)= 2.92,p > 0.05
D)t(23)= 2.92,p < 0.05
سؤال
When we hear that a recent survey found 36%  of adults had used an on-line dating service,the
  is the
A)estimated standard error.
B)degrees of freedom.
C)margin of error.
D)confidence interval of the mean.
of adults had used an on-line dating service,the is theA)estimated standard error.
B)degrees of freedom.
C)margin of error.
D)confidence interval of the mean.
سؤال
When establishing the proper confidence interval for interval estimation,which of the following should be employed?
A)A two-tailed value of
B)A one-tailed value of
C)A one-tailed value of
D)A two-tailed value of
A)A two-tailed value of
B)A one-tailed value of
C)A one-tailed value of
D)A two-tailed value of
سؤال
سؤال
سؤال
What happens to the power of a t-test when the variability of the raw scores is increased? The power will
A)increase.
B)decrease.
C)remain the same.
D)increase or decrease,depending on whether is positive or negative.
A)increase.
B)decrease.
C)remain the same.
D)increase or decrease,depending on whether
is positive or negative. سؤال
سؤال
The critical value for  is obtained using
A)N,which is the total number of scores in the sample.
B)N,which is the number of pairs of scores in the sample.
C)df,which equals N - 1,with N being the number of pairs of scores in the sample.
D)df,which equals N - 2,with N being the number of pairs of scores in the sample.
is obtained usingA)N,which is the total number of scores in the sample.
B)N,which is the number of pairs of scores in the sample.
C)df,which equals N - 1,with N being the number of pairs of scores in the sample.
D)df,which equals N - 2,with N being the number of pairs of scores in the sample.
سؤال
سؤال
In a study involving 22 participants,you have found that the Pearson correlation coefficient between the amount of Chemical J2 in the bloodstream and roller coaster enjoyment is 0.53.Use a two-tailed test and  to determine if this is a significant correlation coefficient.
A)
B)
C)
D)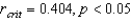
to determine if this is a significant correlation coefficient.A)
B)
C)
D)
سؤال
سؤال
In a study involving 22 participants,you have found that the Pearson correlation coefficient between the amount of Chemical J2 and roller coaster enjoyment is 0.53.Use a two-tailed test and  1 to determine if this is a significant correlation coefficient.
A)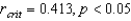
B)
C)
D)
1 to determine if this is a significant correlation coefficient.A)
B)
C)
D)
سؤال
In a one-tailed significance test for a correlation predicted to be positive,the null hypothesis is ______ and the alternative hypothesis is _____.
A) 0;
0;  : > 0
: > 0
B) < 0;
< 0;  0
0
C) = 0;
= 0;  > 0
> 0
D) < 0;
< 0;  > 0
> 0
A)
0; : > 0B)
< 0; 0C)
= 0; > 0D)
< 0; > 0 سؤال
The Cultural Diversity Task Force sponsored six events last year (e.g. ,Awareness Luncheon)and six events with the same names this year.To see how well the attendance last year correlated with attendance this year,the chairperson ranked the number of people attending each event during each of the two years and calculated a correlation.The chairperson used the Spearman rank-order correlation coefficient  to determine if attendance this year at these events was greater than last year (a positive correlation).The correlation would have to be bigger than _______ to be "significant."
A)0.886
B)0.829
C)0.645
D)0.643
to determine if attendance this year at these events was greater than last year (a positive correlation).The correlation would have to be bigger than _______ to be "significant."A)0.886
B)0.829
C)0.645
D)0.643
سؤال
What happens to the absolute value of  as df increases? It
A)decreases.
B)increases.
C)remains the same.
D)increases or decreases depending on whether is positive or negative.
as df increases? ItA)decreases.
B)increases.
C)remains the same.
D)increases or decreases depending on whether
is positive or negative. سؤال
Suppose you perform a two-tailed significance test on a correlation using 29 participants.Your  is 0.56,which is a significant correlation coefficient.Which of the following is the correct way to report this finding?
A)r(29)= 0.56,p < 0.05
B)r(28)= 0.56,p < 0.05
C)r(27)= 0.56,p > 0.05
D)r(27)= 0.56,p < 0.05
is 0.56,which is a significant correlation coefficient.Which of the following is the correct way to report this finding?A)r(29)= 0.56,p < 0.05
B)r(28)= 0.56,p < 0.05
C)r(27)= 0.56,p > 0.05
D)r(27)= 0.56,p < 0.05
سؤال
A study with 46 participants investigated whether there was a relationship between one's attitude toward giving blood and the number of times one has given blood in a year.The correlation coefficient was r = +0.56.The  is _____ and the investigator should _____.
A)+0.243;reject
B)+0.243;retain
C) 0.288;reject
D) 0.288;retain
is _____ and the investigator should _____.A)+0.243;reject
B)+0.243;retain
C) 0.288;reject
D) 0.288;retain
سؤال
سؤال
In a one-tailed significance test for a correlation predicted to be negative,the null hypothesis is _____ and the alternative hypothesis is _____.
A) 0;
0;  < 0
< 0
B) > 0;
> 0;  0
0
C) = 0;
= 0;  < 0
< 0
D) > 0;
> 0;  < 0
< 0
A)
0; < 0B)
> 0; 0C)
= 0; < 0D)
> 0; < 0 سؤال
Suppose you correlate reading levels with the ages of 30 elementary school children.You compute  and find it to be 0.72,which is a significant correlation coefficient.Which of the following is the most appropriate conclusion?
A)Increases in age cause increases in reading level.
B)There is a proven relationship between age and reading level.
C)There is a negative relationship between age and reading level that exceeds chance expectations.
D)There is a positive relationship between age and reading level that exceeds chance expectations.
and find it to be 0.72,which is a significant correlation coefficient.Which of the following is the most appropriate conclusion?A)Increases in age cause increases in reading level.
B)There is a proven relationship between age and reading level.
C)There is a negative relationship between age and reading level that exceeds chance expectations.
D)There is a positive relationship between age and reading level that exceeds chance expectations.
سؤال
If we reject the null hypothesis in a significance test of correlation,we conclude that our 
A)indicates a significant difference between the sample correlation coefficient and the true value of .
B)says there is a significant difference between the sample mean and the true population mean.
C)almost never happens when is really 0.
D)represents a equal to 0.
A)indicates a significant difference between the sample correlation coefficient and the true value of .
B)says there is a significant difference between the sample mean and the true population mean.
C)almost never happens when
is really 0.D)represents a
equal to 0. سؤال
Suppose you perform a two-tailed significance test on a correlation between the number of books read for enjoyment and the number of credit hours taken,using 32 participants.Your  is -0.15,which is not a significant correlation coefficient.Which of the following is the correct way to report this finding?
A)r(32)= -0.15,p > 0.05
B)r(31)= -0.15,p > 0.05
C)r(30)= -0.15,p < 0.05
D)r(30)= -0.15,p > 0.05
is -0.15,which is not a significant correlation coefficient.Which of the following is the correct way to report this finding?A)r(32)= -0.15,p > 0.05
B)r(31)= -0.15,p > 0.05
C)r(30)= -0.15,p < 0.05
D)r(30)= -0.15,p > 0.05

فتح الحزمة
قم بالتسجيل لفتح البطاقات في هذه المجموعة!
Unlock Deck
Unlock Deck
1/57
العب
ملء الشاشة (f)
Deck 11: Performing the One-Sample T-Test and Testing Correlation Coefficients
1
If a researcher reports a one-sample t-test with df = 24,how many individuals participated in this study?
A)24
B)25
C)26
D)Cannot be determined from the information given
A)24
B)25
C)26
D)Cannot be determined from the information given
25
2
For a two-tailed test with = 0.05,the value is
A)either +1.96 or -1.96.
B)both +1.96 and -1.96.
C)either +1.645 or -1.645.
D)different for each df.
value isA)either +1.96 or -1.96.
B)both +1.96 and -1.96.
C)either +1.645 or -1.645.
D)different for each df.
different for each df.
3
A developmental psychologist interested in the development of color perception presented 20 one-month-old infants with a pair of color forms.One form had two colors and the other had one.If the infants preferred to look at the form with two colors above chance level (50%),they can perceive colors.The mean percentage of times the infants preferred the two-color form was 53.15 ( ).What is ?
A)0.83
B)0.98
C)3.72
D)4.39
).What is ?A)0.83
B)0.98
C)3.72
D)4.39
3.72
4
For and _____ and _____ for a two-tailed test with .
A)2.981;2.093
B)2.093;2.981
C)-2.981;-2.093
D)-2.093;-2.981
and _____ and _____ for a two-tailed test with .A)2.981;2.093
B)2.093;2.981
C)-2.981;-2.093
D)-2.093;-2.981
فتح الحزمة
افتح القفل للوصول البطاقات البالغ عددها 57 في هذه المجموعة.
فتح الحزمة
k this deck
5
Degrees of freedom (df)for the one-sample t-test is equal to
A) .
B)N.
C)N - 1.
D) .
A)
.B)N.
C)N - 1.
D)
. فتح الحزمة
افتح القفل للوصول البطاقات البالغ عددها 57 في هذه المجموعة.
فتح الحزمة
k this deck
6
For ,and ,what is ?
A)
B)
C)
D)
,and ,what is ?A)
B)
C)
D)
فتح الحزمة
افتح القفل للوصول البطاقات البالغ عددها 57 في هذه المجموعة.
فتح الحزمة
k this deck
7
When is a t-test used instead of a z-test?
A)When the population µ is known
B)When the population deals with two samples
C)When the population standard deviation is known
D)When the population standard deviation is unknown
A)When the population µ is known
B)When the population deals with two samples
C)When the population standard deviation is known
D)When the population standard deviation is unknown
فتح الحزمة
افتح القفل للوصول البطاقات البالغ عددها 57 في هذه المجموعة.
فتح الحزمة
k this deck
8
Which of the following is one of the assumptions of a one-sample t-test?
A)The obtained scores are on an ordinal or interval scale.
B)The population standard deviation is estimated by computing .
C)The population standard deviation is known.
D)The population distribution is skewed.
A)The obtained scores are on an ordinal or interval scale.
B)The population standard deviation is estimated by computing
.C)The population standard deviation is known.
D)The population distribution is skewed.
فتح الحزمة
افتح القفل للوصول البطاقات البالغ عددها 57 في هذه المجموعة.
فتح الحزمة
k this deck
9
Unless we use the correct from the t-distribution for the appropriate N,
A)we will fail to reject .
B)we will always reject .
C)the probability of making a Type I error will increase.
D)the probability of making a Type I error will not equal .
from the t-distribution for the appropriate N,A)we will fail to reject
.B)we will always reject
.C)the probability of making a Type I error will increase.
D)the probability of making a Type I error will not equal .
فتح الحزمة
افتح القفل للوصول البطاقات البالغ عددها 57 في هذه المجموعة.
فتح الحزمة
k this deck
10
How is the t-distribution defined?
A)The distribution of all possible values of t
B)How far the sample mean is from the µ of the sampling distribution in estimated standard error units
C)The distribution of all possible values of t for random sample means selected from the raw score population described by
D)The distribution of all possible values of t for random sample means selected from the raw score population described by
A)The distribution of all possible values of t
B)How far the sample mean is from the µ of the sampling distribution in estimated standard error units
C)The distribution of all possible values of t for random sample means selected from the raw score population described by
D)The distribution of all possible values of t for random sample means selected from the raw score population described by
فتح الحزمة
افتح القفل للوصول البطاقات البالغ عددها 57 في هذه المجموعة.
فتح الحزمة
k this deck
11
Using the data given below,perform a two-tailed t-test to compare the sample mean to .Use . 38 40 41 37 35 38 41
39 34 35 38 42 44 37
A)2.160 < 2.601,Fail to reject
B)2.601 > 2.160,Reject
C)-2.160 > -2.601,Reject
D)-2.601 < -2.160,Fail to reject
.Use . 38 40 41 37 35 38 4139 34 35 38 42 44 37
A)2.160 < 2.601,Fail to reject
B)2.601 > 2.160,Reject
C)-2.160 > -2.601,Reject
D)-2.601 < -2.160,Fail to reject
فتح الحزمة
افتح القفل للوصول البطاقات البالغ عددها 57 في هذه المجموعة.
فتح الحزمة
k this deck
12
What happens to the t-distribution as the sample size increases?
A)The t-distribution appears less and less like a normal distribution.
B)The t-distribution appears more and more like a normal distribution.
C)The shape of the t-distribution is unaffected.
D) becomes nearer to the true value of µ.
A)The t-distribution appears less and less like a normal distribution.
B)The t-distribution appears more and more like a normal distribution.
C)The shape of the t-distribution is unaffected.
D)
becomes nearer to the true value of µ. فتح الحزمة
افتح القفل للوصول البطاقات البالغ عددها 57 في هذه المجموعة.
فتح الحزمة
k this deck
13
Which of the following is the formula for the in a single-sample t-test?
A)
B)
C)
D)
in a single-sample t-test?A)
B)
C)
D)
فتح الحزمة
افتح القفل للوصول البطاقات البالغ عددها 57 في هذه المجموعة.
فتح الحزمة
k this deck
14
Using the data given below,perform a one-tailed t-test with .Use . 74 73 75 70 71 70 72
74 75 74 72 70 71 73
A)-3.21 < -1.771,p < 0.05
B)3.21 > 1.771,p < 0.05
C)-1.771 < -3.21,p < 0.05
D)1.771 < -3.21,p > 0.05
.Use . 74 73 75 70 71 70 7274 75 74 72 70 71 73
A)-3.21 < -1.771,p < 0.05
B)3.21 > 1.771,p < 0.05
C)-1.771 < -3.21,p < 0.05
D)1.771 < -3.21,p > 0.05
فتح الحزمة
افتح القفل للوصول البطاقات البالغ عددها 57 في هذه المجموعة.
فتح الحزمة
k this deck
15
For ,and ,what is ?
A)
B)
C)
D)
,and ,what is ?A)
B)
C)
D)
فتح الحزمة
افتح القفل للوصول البطاقات البالغ عددها 57 في هذه المجموعة.
فتح الحزمة
k this deck
16
Which of the following assumptions is common to both the z-test and the one-sample t-test?
A)Alpha is selected to be 0.01.
B)The raw score population forms a normal distribution,and the population mean and standard deviation are known.
C)The standard deviation of the raw score population is estimated by .
D)There is one random sample of interval or ratio scores.
A)Alpha is selected to be 0.01.
B)The raw score population forms a normal distribution,and the population mean and standard deviation are known.
C)The standard deviation of the raw score population is estimated by
.D)There is one random sample of interval or ratio scores.
فتح الحزمة
افتح القفل للوصول البطاقات البالغ عددها 57 في هذه المجموعة.
فتح الحزمة
k this deck
17
What is for a one-tailed test for a negative when 30 participants are tested? Use = 0.05.
A)-1.697
B)-1.699
C) 2.042
D) 2.045
for a one-tailed test for a negative when 30 participants are tested? Use = 0.05.A)-1.697
B)-1.699
C) 2.042
D) 2.045
فتح الحزمة
افتح القفل للوصول البطاقات البالغ عددها 57 في هذه المجموعة.
فتح الحزمة
k this deck
18
If a sample mean has a value equal to µ,the corresponding value of t will be equal to
A)+1.0.
B)0.0.
C)-1.0.
D)+2.0.
A)+1.0.
B)0.0.
C)-1.0.
D)+2.0.
فتح الحزمة
افتح القفل للوصول البطاقات البالغ عددها 57 في هذه المجموعة.
فتح الحزمة
k this deck
19
What is ?
A)The estimated population standard deviation
B)The population standard deviation
C)The estimated standard error of the mean
D)The standard error of the mean
?A)The estimated population standard deviation
B)The population standard deviation
C)The estimated standard error of the mean
D)The standard error of the mean
فتح الحزمة
افتح القفل للوصول البطاقات البالغ عددها 57 في هذه المجموعة.
فتح الحزمة
k this deck
20
For and _____ and _____ for a one-tailed test with ,and .
A)-1.530;2.485
B)-1.530;-2.485
C)-2.485;1.530
D)-2.485;-1.530
and _____ and _____ for a one-tailed test with ,and .A)-1.530;2.485
B)-1.530;-2.485
C)-2.485;1.530
D)-2.485;-1.530
فتح الحزمة
افتح القفل للوصول البطاقات البالغ عددها 57 في هذه المجموعة.
فتح الحزمة
k this deck
21
The process of specifying a range of values within which the population parameter is estimated to fall is known as
A)interval estimation.
B)mean estimation.
C)point estimation.
D)population estimation.
A)interval estimation.
B)mean estimation.
C)point estimation.
D)population estimation.
فتح الحزمة
افتح القفل للوصول البطاقات البالغ عددها 57 في هذه المجموعة.
فتح الحزمة
k this deck
22
Which of the following is one of the assumptions for hypothesis testing of the Pearson correlation coefficient?
A)The X-Y pairs are ordinal scores.
B)There is random sampling of X-Y pairs.
C)The dependent variable comes from a population that has a normal distribution.
D)The independent variable comes from a population that has a normal distribution.
A)The X-Y pairs are ordinal scores.
B)There is random sampling of X-Y pairs.
C)The dependent variable comes from a population that has a normal distribution.
D)The independent variable comes from a population that has a normal distribution.
فتح الحزمة
افتح القفل للوصول البطاقات البالغ عددها 57 في هذه المجموعة.
فتح الحزمة
k this deck
23
Which kind of estimation is performed when we claim that a population mean is equal to the sample mean?
A)Interval estimation
B)Mean estimation
C)Point estimation
D)Population estimation
A)Interval estimation
B)Mean estimation
C)Point estimation
D)Population estimation
فتح الحزمة
افتح القفل للوصول البطاقات البالغ عددها 57 في هذه المجموعة.
فتح الحزمة
k this deck
24
The alternative hypothesis in a two-tailed significance test of correlation states that
A)a correlation exists in the population.
B)no correlation exists in the population.
C)a positive correlation exists in the population.
D)a negative correlation exists in the population.
A)a correlation exists in the population.
B)no correlation exists in the population.
C)a positive correlation exists in the population.
D)a negative correlation exists in the population.
فتح الحزمة
افتح القفل للوصول البطاقات البالغ عددها 57 في هذه المجموعة.
فتح الحزمة
k this deck
25
If all other factors are held constant,increasing the level of confidence will have what kind of effect on the width of a confidence interval?
A)Increase it
B)Decrease it
C)Increase it or decrease it depending on whether is positive or negative
D)Have no effect on it
A)Increase it
B)Decrease it
C)Increase it or decrease it depending on whether
is positive or negativeD)Have no effect on it
فتح الحزمة
افتح القفل للوصول البطاقات البالغ عددها 57 في هذه المجموعة.
فتح الحزمة
k this deck
26
Some people claim that psychology is common sense.If this is true,then students who have not taken psychology courses should be able to predict the outcomes of experiments as well as psychology majors.If it is not,nonpsychology students should perform worse than psychology students.Psychology students typically predict outcomes with = 75% accuracy.A sample of 15 nonpsychology students predicted with accuracy.The .What is the 95% confidence interval for nonpsychology students?
A)54.22 65.78
B)54.26 65.75
C)55.25 64.75
D)69.22 80.78
accuracy.The .What is the 95% confidence interval for nonpsychology students?A)54.22 65.78
B)54.26 65.75
C)55.25 64.75
D)69.22 80.78
فتح الحزمة
افتح القفل للوصول البطاقات البالغ عددها 57 في هذه المجموعة.
فتح الحزمة
k this deck
27
What does the shape of any particular sampling distribution of a correlation coefficient depend upon?
A)df
B)µ
C)r
D)
A)df
B)µ
C)r
D)
فتح الحزمة
افتح القفل للوصول البطاقات البالغ عددها 57 في هذه المجموعة.
فتح الحزمة
k this deck
28
The null hypothesis in a two-tailed significance test of correlation states that
A)a correlation exists in the population.
B)no correlation exists in the population.
C)a positive correlation exists in the population.
D)a negative correlation exists in the population.
A)a correlation exists in the population.
B)no correlation exists in the population.
C)a positive correlation exists in the population.
D)a negative correlation exists in the population.
فتح الحزمة
افتح القفل للوصول البطاقات البالغ عددها 57 في هذه المجموعة.
فتح الحزمة
k this deck
29
A two-tailed t-test was conducted for and .Using was compared to .What is the correct 95% confidence interval for ?
A)
B)
C)
D)A confidence interval should not be constructed because the t-test was not significant.
and .Using was compared to .What is the correct 95% confidence interval for ?A)
B)
C)
D)A confidence interval should not be constructed because the t-test was not significant.
فتح الحزمة
افتح القفل للوصول البطاقات البالغ عددها 57 في هذه المجموعة.
فتح الحزمة
k this deck
30
A two-tailed t-test was conducted for and .Using was compared to .What is the correct 95% confidence interval for ?
A)
B)
C)
D)A confidence interval should not be constructed because the t-test was not significant.
and .Using was compared to .What is the correct 95% confidence interval for ?A)
B)
C)
D)A confidence interval should not be constructed because the t-test was not significant.
فتح الحزمة
افتح القفل للوصول البطاقات البالغ عددها 57 في هذه المجموعة.
فتح الحزمة
k this deck
31
Suppose you conduct an experiment with 20 subjects and the turns out to be 0.69,which is not statistically significant.Which of the following is the correct way to report your results?
A) = 0.69,p > 0.05
B)t(20)= 0.69,p < 0.05
C)t(19)= 0.69,p < 0.05
D)t(19)= 0.69,p > 0.05
turns out to be 0.69,which is not statistically significant.Which of the following is the correct way to report your results?A)
= 0.69,p > 0.05B)t(20)= 0.69,p < 0.05
C)t(19)= 0.69,p < 0.05
D)t(19)= 0.69,p > 0.05
فتح الحزمة
افتح القفل للوصول البطاقات البالغ عددها 57 في هذه المجموعة.
فتح الحزمة
k this deck
32
The major problem with point estimation is that it
A)cannot be utilized to estimate population parameters.
B)cannot be utilized with sample data.
C)is extremely vulnerable to sampling error.
D)provides only a single point in its estimate.
A)cannot be utilized to estimate population parameters.
B)cannot be utilized with sample data.
C)is extremely vulnerable to sampling error.
D)provides only a single point in its estimate.
فتح الحزمة
افتح القفل للوصول البطاقات البالغ عددها 57 في هذه المجموعة.
فتح الحزمة
k this deck
33
The confidence interval for a single is
A)a point interval estimation of the population mean.
B)a range of values of that our sample mean is not likely to represent.
C)a range of values of that our sample mean is likely to represent.
D)a point on the variable at which the population is expected to fall.
A)a point interval estimation of the population mean.
B)a range of values of that our sample mean is not likely to represent.
C)a range of values of that our sample mean is likely to represent.
D)a point on the variable at which the population is expected to fall.
فتح الحزمة
افتح القفل للوصول البطاقات البالغ عددها 57 في هذه المجموعة.
فتح الحزمة
k this deck
34
When we construct a 95% confidence interval,we are 95% sure that the
A)sample mean falls within the interval.
B)population mean falls within the interval.
C)sample mean is at the center of the interval.
D)population mean is at the center of the interval.
A)sample mean falls within the interval.
B)population mean falls within the interval.
C)sample mean is at the center of the interval.
D)population mean is at the center of the interval.
فتح الحزمة
افتح القفل للوصول البطاقات البالغ عددها 57 في هذه المجموعة.
فتح الحزمة
k this deck
35
The logic behind computing a confidence interval is to compute the highest and lowest values of a _____ mean that are not significantly different from the _____.
A)sample;the current sample mean
B)population;the current sample mean
C)population;the population mean specified in the null hypothesis
D)sample;the population mean specified in the null hypothesis
A)sample;the current sample mean
B)population;the current sample mean
C)population;the population mean specified in the null hypothesis
D)sample;the population mean specified in the null hypothesis
فتح الحزمة
افتح القفل للوصول البطاقات البالغ عددها 57 في هذه المجموعة.
فتح الحزمة
k this deck
36
Suppose you conduct an experiment with 24 subjects and your turns out to be 2.92,which is statistically significant.Which of the following is the correct way to report your results?
A) = 2.92,p < 0.05
B)t(24)= 2.92,p < 0.05
C)t(23)= 2.92,p > 0.05
D)t(23)= 2.92,p < 0.05
turns out to be 2.92,which is statistically significant.Which of the following is the correct way to report your results?A)
= 2.92,p < 0.05B)t(24)= 2.92,p < 0.05
C)t(23)= 2.92,p > 0.05
D)t(23)= 2.92,p < 0.05
فتح الحزمة
افتح القفل للوصول البطاقات البالغ عددها 57 في هذه المجموعة.
فتح الحزمة
k this deck
37
When we hear that a recent survey found 36% of adults had used an on-line dating service,the is the
A)estimated standard error.
B)degrees of freedom.
C)margin of error.
D)confidence interval of the mean.
of adults had used an on-line dating service,the is theA)estimated standard error.
B)degrees of freedom.
C)margin of error.
D)confidence interval of the mean.
فتح الحزمة
افتح القفل للوصول البطاقات البالغ عددها 57 في هذه المجموعة.
فتح الحزمة
k this deck
38
When establishing the proper confidence interval for interval estimation,which of the following should be employed?
A)A two-tailed value of
B)A one-tailed value of
C)A one-tailed value of
D)A two-tailed value of
A)A two-tailed value of
B)A one-tailed value of
C)A one-tailed value of
D)A two-tailed value of
فتح الحزمة
افتح القفل للوصول البطاقات البالغ عددها 57 في هذه المجموعة.
فتح الحزمة
k this deck
39
Which of the following statements about the correlation coefficient is true?
A)One should not accept that a correlation coefficient represents a relationship unless it is significant.
B)Unless a correlation coefficient is zero,it represents a relationship.
C)Positive correlation coefficients tend to be significant more often than negative ones.
D)Sampling error does not apply to the correlation coefficient.
فتح الحزمة
افتح القفل للوصول البطاقات البالغ عددها 57 في هذه المجموعة.
فتح الحزمة
k this deck
40
How many degrees of freedom do we have in significance testing of r?
A)N -2,where N equals the total number of Xs plus the total number of Ys
B)N - 2,where N equals the total number of pairs of scores
C)N - 1,where N equals the total number of pairs of scores
D)N -1,where N equals the total number of Xs plus the total number of Ys
A)N -2,where N equals the total number of Xs plus the total number of Ys
B)N - 2,where N equals the total number of pairs of scores
C)N - 1,where N equals the total number of pairs of scores
D)N -1,where N equals the total number of Xs plus the total number of Ys
فتح الحزمة
افتح القفل للوصول البطاقات البالغ عددها 57 في هذه المجموعة.
فتح الحزمة
k this deck
41
What happens to the power of a t-test when the variability of the raw scores is increased? The power will
A)increase.
B)decrease.
C)remain the same.
D)increase or decrease,depending on whether is positive or negative.
A)increase.
B)decrease.
C)remain the same.
D)increase or decrease,depending on whether
is positive or negative. فتح الحزمة
افتح القفل للوصول البطاقات البالغ عددها 57 في هذه المجموعة.
فتح الحزمة
k this deck
42
If r = 0.72,what proportion of the variance in Y is accounted for by its relationship with X?
A)0.85
B)0.72
C)0.52
D)Cannot be determined from the information given
A)0.85
B)0.72
C)0.52
D)Cannot be determined from the information given
فتح الحزمة
افتح القفل للوصول البطاقات البالغ عددها 57 في هذه المجموعة.
فتح الحزمة
k this deck
43
The critical value for is obtained using
A)N,which is the total number of scores in the sample.
B)N,which is the number of pairs of scores in the sample.
C)df,which equals N - 1,with N being the number of pairs of scores in the sample.
D)df,which equals N - 2,with N being the number of pairs of scores in the sample.
is obtained usingA)N,which is the total number of scores in the sample.
B)N,which is the number of pairs of scores in the sample.
C)df,which equals N - 1,with N being the number of pairs of scores in the sample.
D)df,which equals N - 2,with N being the number of pairs of scores in the sample.
فتح الحزمة
افتح القفل للوصول البطاقات البالغ عددها 57 في هذه المجموعة.
فتح الحزمة
k this deck
44
Which of the following would increase the power of a t-test?
A)Changing from 0.05 to 0.01
B)Increasing the variability in the raw scores
C)Changing the sample size from N = 25 to N = 100
D)Changing the sample size from N = 100 to N = 25
A)Changing from 0.05 to 0.01
B)Increasing the variability in the raw scores
C)Changing the sample size from N = 25 to N = 100
D)Changing the sample size from N = 100 to N = 25
فتح الحزمة
افتح القفل للوصول البطاقات البالغ عددها 57 في هذه المجموعة.
فتح الحزمة
k this deck
45
In a study involving 22 participants,you have found that the Pearson correlation coefficient between the amount of Chemical J2 in the bloodstream and roller coaster enjoyment is 0.53.Use a two-tailed test and to determine if this is a significant correlation coefficient.
A)
B)
C)
D)
to determine if this is a significant correlation coefficient.A)
B)
C)
D)
فتح الحزمة
افتح القفل للوصول البطاقات البالغ عددها 57 في هذه المجموعة.
فتح الحزمة
k this deck
46
Which of the following would increase the power of a significance test for correlation?
A)Changing from 0.05 to 0.01
B)Increasing the variability in the Y scores
C)Changing the sample size from N = 25 to N = 100
D)Changing the sample size from N = 100 to N = 25
A)Changing from 0.05 to 0.01
B)Increasing the variability in the Y scores
C)Changing the sample size from N = 25 to N = 100
D)Changing the sample size from N = 100 to N = 25
فتح الحزمة
افتح القفل للوصول البطاقات البالغ عددها 57 في هذه المجموعة.
فتح الحزمة
k this deck
47
In a study involving 22 participants,you have found that the Pearson correlation coefficient between the amount of Chemical J2 and roller coaster enjoyment is 0.53.Use a two-tailed test and 1 to determine if this is a significant correlation coefficient.
A)
B)
C)
D)
1 to determine if this is a significant correlation coefficient.A)
B)
C)
D)
فتح الحزمة
افتح القفل للوصول البطاقات البالغ عددها 57 في هذه المجموعة.
فتح الحزمة
k this deck
48
In a one-tailed significance test for a correlation predicted to be positive,the null hypothesis is ______ and the alternative hypothesis is _____.
A) 0; : > 0
B) < 0; 0
C) = 0; > 0
D) < 0; > 0
A)
0; : > 0B)
< 0; 0C)
= 0; > 0D)
< 0; > 0 فتح الحزمة
افتح القفل للوصول البطاقات البالغ عددها 57 في هذه المجموعة.
فتح الحزمة
k this deck
49
The Cultural Diversity Task Force sponsored six events last year (e.g. ,Awareness Luncheon)and six events with the same names this year.To see how well the attendance last year correlated with attendance this year,the chairperson ranked the number of people attending each event during each of the two years and calculated a correlation.The chairperson used the Spearman rank-order correlation coefficient to determine if attendance this year at these events was greater than last year (a positive correlation).The correlation would have to be bigger than _______ to be "significant."
A)0.886
B)0.829
C)0.645
D)0.643
to determine if attendance this year at these events was greater than last year (a positive correlation).The correlation would have to be bigger than _______ to be "significant."A)0.886
B)0.829
C)0.645
D)0.643
فتح الحزمة
افتح القفل للوصول البطاقات البالغ عددها 57 في هذه المجموعة.
فتح الحزمة
k this deck
50
What happens to the absolute value of as df increases? It
A)decreases.
B)increases.
C)remains the same.
D)increases or decreases depending on whether is positive or negative.
as df increases? ItA)decreases.
B)increases.
C)remains the same.
D)increases or decreases depending on whether
is positive or negative. فتح الحزمة
افتح القفل للوصول البطاقات البالغ عددها 57 في هذه المجموعة.
فتح الحزمة
k this deck
51
Suppose you perform a two-tailed significance test on a correlation using 29 participants.Your is 0.56,which is a significant correlation coefficient.Which of the following is the correct way to report this finding?
A)r(29)= 0.56,p < 0.05
B)r(28)= 0.56,p < 0.05
C)r(27)= 0.56,p > 0.05
D)r(27)= 0.56,p < 0.05
is 0.56,which is a significant correlation coefficient.Which of the following is the correct way to report this finding?A)r(29)= 0.56,p < 0.05
B)r(28)= 0.56,p < 0.05
C)r(27)= 0.56,p > 0.05
D)r(27)= 0.56,p < 0.05
فتح الحزمة
افتح القفل للوصول البطاقات البالغ عددها 57 في هذه المجموعة.
فتح الحزمة
k this deck
52
A study with 46 participants investigated whether there was a relationship between one's attitude toward giving blood and the number of times one has given blood in a year.The correlation coefficient was r = +0.56.The is _____ and the investigator should _____.
A)+0.243;reject
B)+0.243;retain
C) 0.288;reject
D) 0.288;retain
is _____ and the investigator should _____.A)+0.243;reject
B)+0.243;retain
C) 0.288;reject
D) 0.288;retain
فتح الحزمة
افتح القفل للوصول البطاقات البالغ عددها 57 في هذه المجموعة.
فتح الحزمة
k this deck
53
What is the difference between Pearson's and Spearman's correlations when performing a hypothesis test?
A)The level of
B)The size of the sample
C)The assumption that the scores must be randomly selected
D)How the respective sampling distributions for each correlation are conceptualized
A)The level of
B)The size of the sample
C)The assumption that the scores must be randomly selected
D)How the respective sampling distributions for each correlation are conceptualized
فتح الحزمة
افتح القفل للوصول البطاقات البالغ عددها 57 في هذه المجموعة.
فتح الحزمة
k this deck
54
In a one-tailed significance test for a correlation predicted to be negative,the null hypothesis is _____ and the alternative hypothesis is _____.
A) 0; < 0
B) > 0; 0
C) = 0; < 0
D) > 0; < 0
A)
0; < 0B)
> 0; 0C)
= 0; < 0D)
> 0; < 0 فتح الحزمة
افتح القفل للوصول البطاقات البالغ عددها 57 في هذه المجموعة.
فتح الحزمة
k this deck
55
Suppose you correlate reading levels with the ages of 30 elementary school children.You compute and find it to be 0.72,which is a significant correlation coefficient.Which of the following is the most appropriate conclusion?
A)Increases in age cause increases in reading level.
B)There is a proven relationship between age and reading level.
C)There is a negative relationship between age and reading level that exceeds chance expectations.
D)There is a positive relationship between age and reading level that exceeds chance expectations.
and find it to be 0.72,which is a significant correlation coefficient.Which of the following is the most appropriate conclusion?A)Increases in age cause increases in reading level.
B)There is a proven relationship between age and reading level.
C)There is a negative relationship between age and reading level that exceeds chance expectations.
D)There is a positive relationship between age and reading level that exceeds chance expectations.
فتح الحزمة
افتح القفل للوصول البطاقات البالغ عددها 57 في هذه المجموعة.
فتح الحزمة
k this deck
56
If we reject the null hypothesis in a significance test of correlation,we conclude that our
A)indicates a significant difference between the sample correlation coefficient and the true value of .
B)says there is a significant difference between the sample mean and the true population mean.
C)almost never happens when is really 0.
D)represents a equal to 0.
A)indicates a significant difference between the sample correlation coefficient and the true value of .
B)says there is a significant difference between the sample mean and the true population mean.
C)almost never happens when
is really 0.D)represents a
equal to 0. فتح الحزمة
افتح القفل للوصول البطاقات البالغ عددها 57 في هذه المجموعة.
فتح الحزمة
k this deck
57
Suppose you perform a two-tailed significance test on a correlation between the number of books read for enjoyment and the number of credit hours taken,using 32 participants.Your is -0.15,which is not a significant correlation coefficient.Which of the following is the correct way to report this finding?
A)r(32)= -0.15,p > 0.05
B)r(31)= -0.15,p > 0.05
C)r(30)= -0.15,p < 0.05
D)r(30)= -0.15,p > 0.05
is -0.15,which is not a significant correlation coefficient.Which of the following is the correct way to report this finding?A)r(32)= -0.15,p > 0.05
B)r(31)= -0.15,p > 0.05
C)r(30)= -0.15,p < 0.05
D)r(30)= -0.15,p > 0.05
فتح الحزمة
افتح القفل للوصول البطاقات البالغ عددها 57 في هذه المجموعة.
فتح الحزمة
k this deck
فتح الحزمة
افتح القفل للوصول البطاقات البالغ عددها 57 في هذه المجموعة.


