Deck 6: Control Charts for Variables
ملء الشاشة (f)
سؤال
سؤال
سؤال
سؤال
سؤال
سؤال
Given the following range readings for 25 subgroups of size four, determine the process capability. 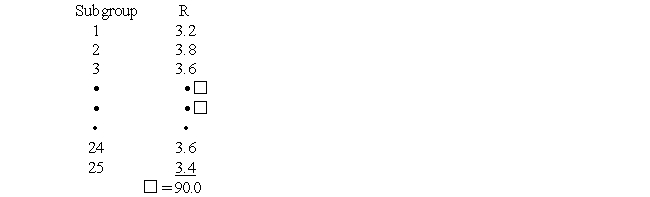
سؤال
سؤال
سؤال
سؤال
سؤال
سؤال
سؤال
Using the data below, determine the trial central line and trial control limits for the X-bar chart. Subgroup size is 5. For the R chart, the trial central line is 0.11, the UCL is 0.23, and LCL is 0. Note not all of the subgroups are included in the data;however, the sums are correct. 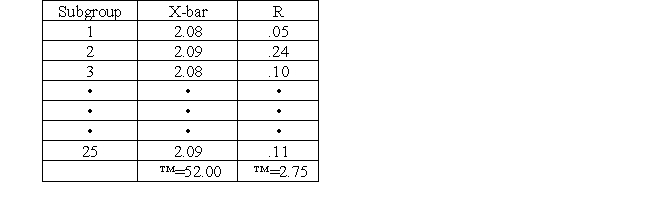
سؤال
سؤال
سؤال
سؤال

فتح الحزمة
قم بالتسجيل لفتح البطاقات في هذه المجموعة!
Unlock Deck
Unlock Deck
1/17
العب
ملء الشاشة (f)
Deck 6: Control Charts for Variables
1
Those causes of variation which are small in magnitude are:
A) special causes
B) assignable causes
C) chance causes
D) fluctuating causes
A) special causes
B) assignable causes
C) chance causes
D) fluctuating causes
C
2
Which of the following subgroup sizes for an X and R chart would not be used?
A) 1
B) 4
C) 5
D) 2
A) 1
B) 4
C) 5
D) 2
A
3
If only one measurement can be taken at a time, the chart to use is called:
A) moving average
B) trend
C) median
D) sun
A) moving average
B) trend
C) median
D) sun
A
4
A user friendly chart for the operator to use is called:
A) moving average
B) median
C) trend
D) all of the above
A) moving average
B) median
C) trend
D) all of the above
فتح الحزمة
افتح القفل للوصول البطاقات البالغ عددها 17 في هذه المجموعة.
فتح الحزمة
k this deck
5
The process spread is the same as the:
A) tolerance
B) quality spread
C) index
D) process capability
A) tolerance
B) quality spread
C) index
D) process capability
فتح الحزمة
افتح القفل للوصول البطاقات البالغ عددها 17 في هذه المجموعة.
فتح الحزمة
k this deck
6
Given the following range readings for 25 subgroups of size four, determine the process capability.
فتح الحزمة
افتح القفل للوصول البطاقات البالغ عددها 17 في هذه المجموعة.
فتح الحزمة
k this deck
7
Which of the following is the name of an out-of- control pattern?
A) assignable
B) causal
C) shift or jump
D) a and b
A) assignable
B) causal
C) shift or jump
D) a and b
فتح الحزمة
افتح القفل للوصول البطاقات البالغ عددها 17 في هذه المجموعة.
فتح الحزمة
k this deck
8
Which of the following subgroup sizes of an X and R chart would most likely be used for costly testing?
A) 6
B) 4
C) 5
D) 2
A) 6
B) 4
C) 5
D) 2
فتح الحزمة
افتح القفل للوصول البطاقات البالغ عددها 17 في هذه المجموعة.
فتح الحزمة
k this deck
9
When using the X chart the central limit theorem is the basis for a sample size of:
A) 2
B) 3
C) 4
D) 5
A) 2
B) 3
C) 4
D) 5
فتح الحزمة
افتح القفل للوصول البطاقات البالغ عددها 17 في هذه المجموعة.
فتح الحزمة
k this deck
10
An s chart might be used as a measure of dispersion rather than an R chart because it is:
A) easier to understand
B) more sensitive to variations
C) more accurate
D) b and c
A) easier to understand
B) more sensitive to variations
C) more accurate
D) b and c
فتح الحزمة
افتح القفل للوصول البطاقات البالغ عددها 17 في هذه المجموعة.
فتح الحزمة
k this deck
11
The specifications for an electronic device are 3.00 ± 0.10 amps. If the standard deviation is 0.02, what is the capability index?
فتح الحزمة
افتح القفل للوصول البطاقات البالغ عددها 17 في هذه المجموعة.
فتح الحزمة
k this deck
12
Those causes of variation which are large in magnitude and are not part of the normal variation are:
A) stable causes
B) chance causes
C) assignable causes
D) fluctuating causes
A) stable causes
B) chance causes
C) assignable causes
D) fluctuating causes
فتح الحزمة
افتح القفل للوصول البطاقات البالغ عددها 17 في هذه المجموعة.
فتح الحزمة
k this deck
13
Using the data below, determine the trial central line and trial control limits for the X-bar chart. Subgroup size is 5. For the R chart, the trial central line is 0.11, the UCL is 0.23, and LCL is 0. Note not all of the subgroups are included in the data;however, the sums are correct.
فتح الحزمة
افتح القفل للوصول البطاقات البالغ عددها 17 في هذه المجموعة.
فتح الحزمة
k this deck
14
An R chart is not accurate above a sample size of:
A) 5
B) 7
C) 10
D) 15
A) 5
B) 7
C) 10
D) 15
فتح الحزمة
افتح القفل للوصول البطاقات البالغ عددها 17 في هذه المجموعة.
فتح الحزمة
k this deck
15
Which of the following is a source of variation:
A) materials
B) piece-to-piece
C) chance
D) none of these
A) materials
B) piece-to-piece
C) chance
D) none of these
فتح الحزمة
افتح القفل للوصول البطاقات البالغ عددها 17 في هذه المجموعة.
فتح الحزمة
k this deck
16
The numerator of the capability index equation is the:
A) tolerance
B) capability ratio
C) process spread
D) none of the above
A) tolerance
B) capability ratio
C) process spread
D) none of the above
فتح الحزمة
افتح القفل للوصول البطاقات البالغ عددها 17 في هذه المجموعة.
فتح الحزمة
k this deck
17
Of the following, the capability index that is most desirable is:
A) 1.00
B) 1.50
C) 0.75
D) 0.30
A) 1.00
B) 1.50
C) 0.75
D) 0.30
فتح الحزمة
افتح القفل للوصول البطاقات البالغ عددها 17 في هذه المجموعة.
فتح الحزمة
k this deck
فتح الحزمة
افتح القفل للوصول البطاقات البالغ عددها 17 في هذه المجموعة.


