Deck 6: Exploring Data: Relationships
ملء الشاشة (f)
سؤال
Use the following to answer Questions 19-24. 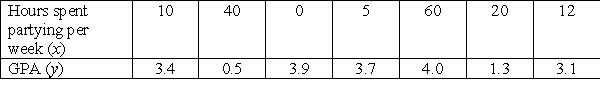
What is the slope of the regression line?
What is the slope of the regression line?
سؤال
سؤال
سؤال
سؤال
سؤال
سؤال
سؤال
سؤال
Use the following to answer Questions 19-24.
What is the y-intercept of the regression line?
What is the y-intercept of the regression line?
سؤال
سؤال
سؤال
سؤال
سؤال
سؤال
سؤال
سؤال
سؤال
سؤال
سؤال
سؤال
سؤال
Use the following data to answer Questions 26 - 28. 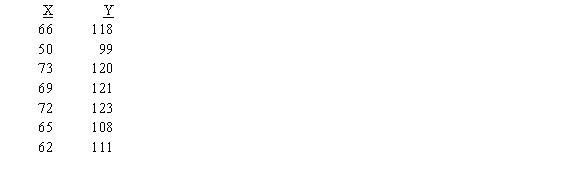
Make a scatterplot of the data.
Make a scatterplot of the data.
سؤال
سؤال
Use the following to answer Questions 19-24.
According to the regression equation, what is the expected GPA of a student who parties 30 hours a week?
According to the regression equation, what is the expected GPA of a student who parties 30 hours a week?
سؤال
سؤال
Use the following to answer Questions 19-24.
What is the correlation for these data?
What is the correlation for these data?
سؤال
سؤال
سؤال
Use the following to answer Questions 19-24.
If you remove the student who parties 60 hours per week from the data set, what is the correlation?
If you remove the student who parties 60 hours per week from the data set, what is the correlation?
سؤال
Use the following data to answer Questions 26 - 28.
Does the data have an outlier?
Does the data have an outlier?
سؤال
Describe the form, direction, and strength of the relationship below. 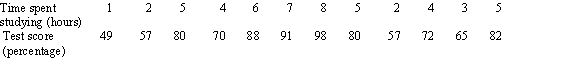
سؤال
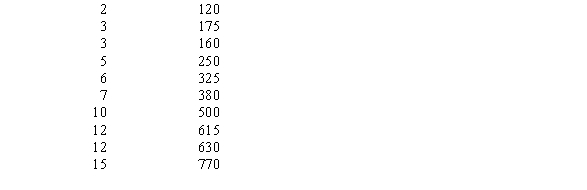
A Little League manager keeps a record book showing the statistics for his players. The first few lines of the record book show: 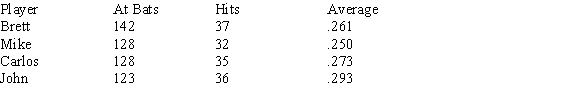 What are the individuals and the variables in these data?
What are the individuals and the variables in these data? سؤال
Ten crickets were observed under various temperatures and the number of chirps each cricket made per second was recorded. The results are shown in the table below.  Make a scatterplot. Is the association between these variables positive or negative?
Make a scatterplot. Is the association between these variables positive or negative? سؤال
سؤال
Below is the scatterplot for data collected on two variables. Would a least-squares regression equation be useful in describing the relationship between the variables? Why or why not? 
سؤال
سؤال
Use the following to answer Questions 19-24.
Which student in this data set is an outlier?
Which student in this data set is an outlier?
سؤال
Use the following data to answer Questions 26 - 28.
What type of association exists between the variables on the scatterplot?
What type of association exists between the variables on the scatterplot?
سؤال
سؤال
Use the following to answer Questions 19-24.
Below are data on the age of 10 cars and the amount of money spent on auto repairs in one year. Make a scatterplot of the data.
Below are data on the age of 10 cars and the amount of money spent on auto repairs in one year. Make a scatterplot of the data.
سؤال
سؤال
سؤال
سؤال
سؤال
سؤال
سؤال
سؤال
سؤال
سؤال
سؤال
سؤال
سؤال
If the least-squares regression line is  then what is the residual for the point (10, 5)?
A)
B) 3
C) 8
D)
then what is the residual for the point (10, 5)?A)
B) 3
C) 8
D)
سؤال
سؤال
If the least-squares regression line is  then what is the residual for the point (7, 5)?
A) 2
B) 3
C)
D)
then what is the residual for the point (7, 5)?A) 2
B) 3
C)
D)
سؤال
سؤال
سؤال
سؤال
Use the following scatterplot to answer Questions . 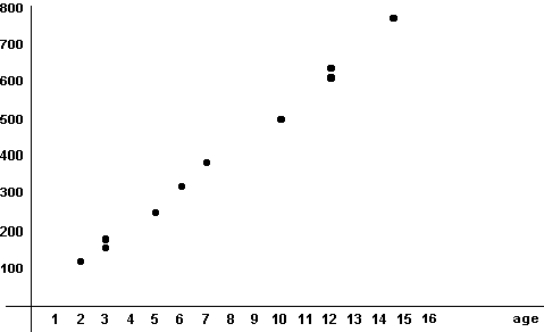
For the scatterplot shown above, what can you say about the least-squares regression line?
A) Its slope is positive.
B) It passes through the point (0,0).
C) It stops at y = 800.
D) None of the above.
For the scatterplot shown above, what can you say about the least-squares regression line?
A) Its slope is positive.
B) It passes through the point (0,0).
C) It stops at y = 800.
D) None of the above.
سؤال
سؤال
سؤال
سؤال
سؤال
Use the following scatterplot to answer Questions . 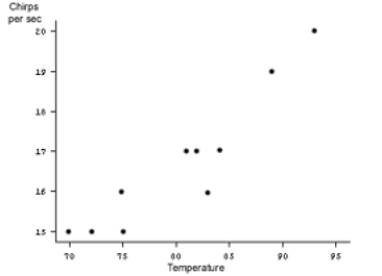
What conclusions can you reach if you hear 18 chirps a minute?
A) The temperature is about 87.
B) The temperature is about 90.
C) This is not a valid answer; 18 is not possible.
D) The data of the scatterplot are not valid.
What conclusions can you reach if you hear 18 chirps a minute?
A) The temperature is about 87.
B) The temperature is about 90.
C) This is not a valid answer; 18 is not possible.
D) The data of the scatterplot are not valid.
سؤال
سؤال
سؤال
Use the following scatterplot to answer Questions . 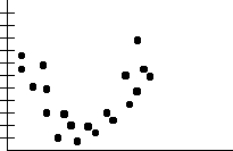
What can you say about the correlation of the data?
A) The correlation is nearly 1.
B) The correlation is nearly −1.
C) The correlation is nearly 0.
D) The data have no correlation.
What can you say about the correlation of the data?
A) The correlation is nearly 1.
B) The correlation is nearly −1.
C) The correlation is nearly 0.
D) The data have no correlation.
سؤال
Use the following scatterplot to answer Questions .
For the scatterplot shown above, what y value would you expect to be paired with x = 9?
A) about 500
B) about 450
C) about 400
D) It's not possible to answer this question based on the data given.
For the scatterplot shown above, what y value would you expect to be paired with x = 9?
A) about 500
B) about 450
C) about 400
D) It's not possible to answer this question based on the data given.
سؤال
سؤال
Use the following scatterplot to answer Questions .
What can you say about the association of the variables?
A) The variables are positively correlated.
B) The variables are negatively correlated.
C) The variables are not correlated.
D) The variables are not linearly correlated.
What can you say about the association of the variables?
A) The variables are positively correlated.
B) The variables are negatively correlated.
C) The variables are not correlated.
D) The variables are not linearly correlated.
سؤال
سؤال
Use the following scatterplot to answer Questions .
What can you say about the slope of the least-squares regression line?
A) The slope is zero.
B) The slope is positive.
C) The slope is negative.
D) The slope varies.
What can you say about the slope of the least-squares regression line?
A) The slope is zero.
B) The slope is positive.
C) The slope is negative.
D) The slope varies.
سؤال
Use the following scatterplot to answer Questions .
What can you say about outliers in the data set?
A) There are no apparent outliers.
B) There is only one outlier.
C) There are only two outliers.
D) There are many outliers.
What can you say about outliers in the data set?
A) There are no apparent outliers.
B) There is only one outlier.
C) There are only two outliers.
D) There are many outliers.
سؤال
Use the following scatterplot to answer Questions .
For the scatterplot shown above, what can you say about the correlation?
A) It is almost 0.
B) It is between 0 and 1.
C) It is exactly 1.
D) It is greater than 1.
For the scatterplot shown above, what can you say about the correlation?
A) It is almost 0.
B) It is between 0 and 1.
C) It is exactly 1.
D) It is greater than 1.
سؤال
سؤال
سؤال
سؤال
سؤال
Use the following scatterplot to answer Questions .
What can you say about the correlation?
A) The correlation is greater than 1.
B) The correlation is exactly 1.
C) The correlation is between 0 and 1.
D) The correlation is negative.
What can you say about the correlation?
A) The correlation is greater than 1.
B) The correlation is exactly 1.
C) The correlation is between 0 and 1.
D) The correlation is negative.
سؤال

فتح الحزمة
قم بالتسجيل لفتح البطاقات في هذه المجموعة!
Unlock Deck
Unlock Deck
1/104
العب
ملء الشاشة (f)
Deck 6: Exploring Data: Relationships
1
Use the following to answer Questions 19-24.
What is the slope of the regression line?
What is the slope of the regression line?
about 
2
When the units of measurement are changed, what happens to the correlation of the data?
The correlation does not change.
3
Is it possible for the correlation for a scatterplot to change dramatically when a single point is moved?
It is possible to change the value from positive to negative by moving a single outlier.
4
What are two variables associated with professional baseball players that are most likely negatively associated?
فتح الحزمة
افتح القفل للوصول البطاقات البالغ عددها 104 في هذه المجموعة.
فتح الحزمة
k this deck
5
Suppose the equation for a regression line has a positive slope. What type of association exists between the variables?
فتح الحزمة
افتح القفل للوصول البطاقات البالغ عددها 104 في هذه المجموعة.
فتح الحزمة
k this deck
6
Suppose the equation for a regression line is y = 18 − 3x. If y = 9, what is the predicted corresponding value for x?
فتح الحزمة
افتح القفل للوصول البطاقات البالغ عددها 104 في هذه المجموعة.
فتح الحزمة
k this deck
7
Suppose the equation for a regression line is y = 18 − 3x. If x = 4, what is the predicted corresponding value for y?
فتح الحزمة
افتح القفل للوصول البطاقات البالغ عددها 104 في هذه المجموعة.
فتح الحزمة
k this deck
8
Suppose the equation for a regression line is y = 4x + 6. If x = 5, what is the predicted corresponding value for y?
فتح الحزمة
افتح القفل للوصول البطاقات البالغ عددها 104 في هذه المجموعة.
فتح الحزمة
k this deck
9
Use the following to answer Questions 19-24.
What is the y-intercept of the regression line?
What is the y-intercept of the regression line?
فتح الحزمة
افتح القفل للوصول البطاقات البالغ عددها 104 في هذه المجموعة.
فتح الحزمة
k this deck
10
When you are interested in the relation between smoking status and death from lung cancer, identify the response variable.
فتح الحزمة
افتح القفل للوصول البطاقات البالغ عددها 104 في هذه المجموعة.
فتح الحزمة
k this deck
11
What can you say about the slope of a regression line for variables that are negatively associated?
فتح الحزمة
افتح القفل للوصول البطاقات البالغ عددها 104 في هذه المجموعة.
فتح الحزمة
k this deck
12
Suppose the babies in a nursery are surveyed. What type of association would you expect between a child's age and the average number of hours the child sleeps in a day?
فتح الحزمة
افتح القفل للوصول البطاقات البالغ عددها 104 في هذه المجموعة.
فتح الحزمة
k this deck
13
When you are interested in the relation between the class size and course evaluation, identify the explanatory variable.
فتح الحزمة
افتح القفل للوصول البطاقات البالغ عددها 104 في هذه المجموعة.
فتح الحزمة
k this deck
14
Suppose the children of a primary school are surveyed. What type of association would you expect between their ages and their height?
فتح الحزمة
افتح القفل للوصول البطاقات البالغ عددها 104 في هذه المجموعة.
فتح الحزمة
k this deck
15
What are two variables associated with professional baseball players that are most likely positively associated?
فتح الحزمة
افتح القفل للوصول البطاقات البالغ عددها 104 في هذه المجموعة.
فتح الحزمة
k this deck
16
If all the points of a scatterplot lie on a straight line, what can you say about the correlation of the data?
فتح الحزمة
افتح القفل للوصول البطاقات البالغ عددها 104 في هذه المجموعة.
فتح الحزمة
k this deck
17
Suppose the equation for a regression line is y = 4x + 6. If y = 12, what is the predicted corresponding value for x?
فتح الحزمة
افتح القفل للوصول البطاقات البالغ عددها 104 في هذه المجموعة.
فتح الحزمة
k this deck
18
Suppose the regression line for a scatterplot passes through the points (0, 30) and
(5, 20). What type of association exists between the variables?
(5, 20). What type of association exists between the variables?
فتح الحزمة
افتح القفل للوصول البطاقات البالغ عددها 104 في هذه المجموعة.
فتح الحزمة
k this deck
19
Suppose the regression line for a scatterplot passes through the points (0, 10) and
(5, 20). What type of association exists between the variables?
(5, 20). What type of association exists between the variables?
فتح الحزمة
افتح القفل للوصول البطاقات البالغ عددها 104 في هذه المجموعة.
فتح الحزمة
k this deck
20
If there is an association between two variables, is it reasonable to presume that changes in one variable will cause changes in the other variable?
فتح الحزمة
افتح القفل للوصول البطاقات البالغ عددها 104 في هذه المجموعة.
فتح الحزمة
k this deck
21
Suppose a scatterplot shows four clusters at each corner of the plot. What can you say about the feasibility of using a least-squares regression line to describe these data?
فتح الحزمة
افتح القفل للوصول البطاقات البالغ عددها 104 في هذه المجموعة.
فتح الحزمة
k this deck
22
Use the following data to answer Questions 26 - 28.
Make a scatterplot of the data.
Make a scatterplot of the data.
فتح الحزمة
افتح القفل للوصول البطاقات البالغ عددها 104 في هذه المجموعة.
فتح الحزمة
k this deck
23
If two variables are both positive, and tend to be linked so that growth of one variable tends to indicate growth in the other variable, then:
A) the variables are positively associated.
B) the variables are negatively associated.
C)
D) the variables have no association with each other.
The association of the variables cannot be determined.
A) the variables are positively associated.
B) the variables are negatively associated.
C)
D) the variables have no association with each other.
The association of the variables cannot be determined.
فتح الحزمة
افتح القفل للوصول البطاقات البالغ عددها 104 في هذه المجموعة.
فتح الحزمة
k this deck
24
Use the following to answer Questions 19-24.
According to the regression equation, what is the expected GPA of a student who parties 30 hours a week?
According to the regression equation, what is the expected GPA of a student who parties 30 hours a week?
فتح الحزمة
افتح القفل للوصول البطاقات البالغ عددها 104 في هذه المجموعة.
فتح الحزمة
k this deck
25
An outlier is an individual value that:
A) extends the pattern.
B) deviates from the pattern.
C) determines the strength of the relationship.
D) outlines the general form of the data.
A) extends the pattern.
B) deviates from the pattern.
C) determines the strength of the relationship.
D) outlines the general form of the data.
فتح الحزمة
افتح القفل للوصول البطاقات البالغ عددها 104 في هذه المجموعة.
فتح الحزمة
k this deck
26
Use the following to answer Questions 19-24.
What is the correlation for these data?
What is the correlation for these data?
فتح الحزمة
افتح القفل للوصول البطاقات البالغ عددها 104 في هذه المجموعة.
فتح الحزمة
k this deck
27
If two variables are negatively associated, then above-average values of one tend to accompany:
A) below-average values of the other.
B) above-average values of the other.
C) oppositely signed values of the other.
D) negatively signed values of the other.
A) below-average values of the other.
B) above-average values of the other.
C) oppositely signed values of the other.
D) negatively signed values of the other.
فتح الحزمة
افتح القفل للوصول البطاقات البالغ عددها 104 في هذه المجموعة.
فتح الحزمة
k this deck
28
Can outliers significantly affect the least-squares regression line?
فتح الحزمة
افتح القفل للوصول البطاقات البالغ عددها 104 في هذه المجموعة.
فتح الحزمة
k this deck
29
Use the following to answer Questions 19-24.
If you remove the student who parties 60 hours per week from the data set, what is the correlation?
If you remove the student who parties 60 hours per week from the data set, what is the correlation?
فتح الحزمة
افتح القفل للوصول البطاقات البالغ عددها 104 في هذه المجموعة.
فتح الحزمة
k this deck
30
Use the following data to answer Questions 26 - 28.
Does the data have an outlier?
Does the data have an outlier?
فتح الحزمة
افتح القفل للوصول البطاقات البالغ عددها 104 في هذه المجموعة.
فتح الحزمة
k this deck
31
Describe the form, direction, and strength of the relationship below.
فتح الحزمة
افتح القفل للوصول البطاقات البالغ عددها 104 في هذه المجموعة.
فتح الحزمة
k this deck
32
A Little League manager keeps a record book showing the statistics for his players. The first few lines of the record book show: What are the individuals and the variables in these data?
What are the individuals and the variables in these data? فتح الحزمة
افتح القفل للوصول البطاقات البالغ عددها 104 في هذه المجموعة.
فتح الحزمة
k this deck
33
Ten crickets were observed under various temperatures and the number of chirps each cricket made per second was recorded. The results are shown in the table below. Make a scatterplot. Is the association between these variables positive or negative?
Make a scatterplot. Is the association between these variables positive or negative? فتح الحزمة
افتح القفل للوصول البطاقات البالغ عددها 104 في هذه المجموعة.
فتح الحزمة
k this deck
34
If a regression line for two variables has a small positive slope, then:
A) the variables are positively associated.
B) the variables are negatively associated.
C) the association of the variables cannot be determined.
D) the variables have no association with each other.
A) the variables are positively associated.
B) the variables are negatively associated.
C) the association of the variables cannot be determined.
D) the variables have no association with each other.
فتح الحزمة
افتح القفل للوصول البطاقات البالغ عددها 104 في هذه المجموعة.
فتح الحزمة
k this deck
35
Below is the scatterplot for data collected on two variables. Would a least-squares regression equation be useful in describing the relationship between the variables? Why or why not?
فتح الحزمة
افتح القفل للوصول البطاقات البالغ عددها 104 في هذه المجموعة.
فتح الحزمة
k this deck
36
The least-squares regression line is the "best" line in that it minimizes a certain sum. What is this sum?
فتح الحزمة
افتح القفل للوصول البطاقات البالغ عددها 104 في هذه المجموعة.
فتح الحزمة
k this deck
37
Use the following to answer Questions 19-24.
Which student in this data set is an outlier?
Which student in this data set is an outlier?
فتح الحزمة
افتح القفل للوصول البطاقات البالغ عددها 104 في هذه المجموعة.
فتح الحزمة
k this deck
38
Use the following data to answer Questions 26 - 28.
What type of association exists between the variables on the scatterplot?
What type of association exists between the variables on the scatterplot?
فتح الحزمة
افتح القفل للوصول البطاقات البالغ عددها 104 في هذه المجموعة.
فتح الحزمة
k this deck
39
Suppose that ages and hours of time slept per day are gathered from people at a mall. According to these data, young children and older adults tend to sleep more than older children and younger adults. How could you describe the resulting scatterplot of this data, where x represents ages and y represents the amount of sleep per day?
فتح الحزمة
افتح القفل للوصول البطاقات البالغ عددها 104 في هذه المجموعة.
فتح الحزمة
k this deck
40
Use the following to answer Questions 19-24.
Below are data on the age of 10 cars and the amount of money spent on auto repairs in one year. Make a scatterplot of the data.
Below are data on the age of 10 cars and the amount of money spent on auto repairs in one year. Make a scatterplot of the data.
فتح الحزمة
افتح القفل للوصول البطاقات البالغ عددها 104 في هذه المجموعة.
فتح الحزمة
k this deck
41
The least-squares regression line minimizes the sum of:
A) the squares of the shortest distance from each scatterplot point to the regression line.
B) the squares of the vertical distance from each scatterplot point to the regression line.
C) the squares of the horizontal distance from each scatterplot point to the regression line.
D) None of the above.
A) the squares of the shortest distance from each scatterplot point to the regression line.
B) the squares of the vertical distance from each scatterplot point to the regression line.
C) the squares of the horizontal distance from each scatterplot point to the regression line.
D) None of the above.
فتح الحزمة
افتح القفل للوصول البطاقات البالغ عددها 104 في هذه المجموعة.
فتح الحزمة
k this deck
42
If the correlation between two variables is 1, then the points of their scatterplot:
A) all lie within 1 unit of the regression line.
B) all lie within ½ unit of the regression line.
C) all lie on the regression line.
D) lie so that exactly half of the points are on each side of the regression line.
A) all lie within 1 unit of the regression line.
B) all lie within ½ unit of the regression line.
C) all lie on the regression line.
D) lie so that exactly half of the points are on each side of the regression line.
فتح الحزمة
افتح القفل للوصول البطاقات البالغ عددها 104 في هذه المجموعة.
فتح الحزمة
k this deck
43
If two variables are negatively associated, then the regression line:
A) has a negative intercept.
B) has a negative slope.
C) has negative coefficients.
D) is valid for only negative values.
A) has a negative intercept.
B) has a negative slope.
C) has negative coefficients.
D) is valid for only negative values.
فتح الحزمة
افتح القفل للوصول البطاقات البالغ عددها 104 في هذه المجموعة.
فتح الحزمة
k this deck
44
If the regression line is , which of the following must hold true?
A) The variables have a strong correlation.
B) The variables have a negative association.
C)
D) The scatterplot shows a linear trend.
All of the above.
A) The variables have a strong correlation.
B) The variables have a negative association.
C)
D) The scatterplot shows a linear trend.
All of the above.
فتح الحزمة
افتح القفل للوصول البطاقات البالغ عددها 104 في هذه المجموعة.
فتح الحزمة
k this deck
45
If the least-squares regression line is y = 3x − 5, the value y = 1 is predicted for what value of x?
A) 0
B) 1
C) 2
D) 6
A) 0
B) 1
C) 2
D) 6
فتح الحزمة
افتح القفل للوصول البطاقات البالغ عددها 104 في هذه المجموعة.
فتح الحزمة
k this deck
46
How does an outlier effect the correlation?
A) A single outlier has no effect.
B) A single outlier has minimal effect.
C) A single outlier can change the value of the correlation, but not its sign.
D) A single outlier can change the value and the sign of the correlation.
A) A single outlier has no effect.
B) A single outlier has minimal effect.
C) A single outlier can change the value of the correlation, but not its sign.
D) A single outlier can change the value and the sign of the correlation.
فتح الحزمة
افتح القفل للوصول البطاقات البالغ عددها 104 في هذه المجموعة.
فتح الحزمة
k this deck
47
If the correlation between two variables is −1, then the points of their scatterplot:
A) all lie within 1 unit of the regression line.
B) all lie within ½ unit of the regression line.
C) all lie on the regression line.
D) lie so that exactly half of the points are on each side of the regression line.
A) all lie within 1 unit of the regression line.
B) all lie within ½ unit of the regression line.
C) all lie on the regression line.
D) lie so that exactly half of the points are on each side of the regression line.
فتح الحزمة
افتح القفل للوصول البطاقات البالغ عددها 104 في هذه المجموعة.
فتح الحزمة
k this deck
48
If the regression line is , which of the following must hold true?
A) The variables have a weak correlation.
B) The variables have a positive association.
C)
D) The scatterplot shows a linear trend.
All of the above.
A) The variables have a weak correlation.
B) The variables have a positive association.
C)
D) The scatterplot shows a linear trend.
All of the above.
فتح الحزمة
افتح القفل للوصول البطاقات البالغ عددها 104 في هذه المجموعة.
فتح الحزمة
k this deck
49
If the correlation between x and y is 0, this means that:
A) the scatterplot has no pattern.
B) the data do not show a linear trend.
C) Both A and B are correct.
D) Neither A nor B is correct.
A) the scatterplot has no pattern.
B) the data do not show a linear trend.
C) Both A and B are correct.
D) Neither A nor B is correct.
فتح الحزمة
افتح القفل للوصول البطاقات البالغ عددها 104 في هذه المجموعة.
فتح الحزمة
k this deck
50
A data set has . What is the standardized value of ?
A) 1
B)
C) 2
D)
A) 1
B)
C) 2
D)
فتح الحزمة
افتح القفل للوصول البطاقات البالغ عددها 104 في هذه المجموعة.
فتح الحزمة
k this deck
51
If the units of measurement change to larger units, then the correlation:
A) becomes larger.
B) becomes smaller.
C)
D) does not change.
Can either become larger or smaller.
A) becomes larger.
B) becomes smaller.
C)
D) does not change.
Can either become larger or smaller.
فتح الحزمة
افتح القفل للوصول البطاقات البالغ عددها 104 في هذه المجموعة.
فتح الحزمة
k this deck
52
The intercept of the least-squares regression line is:
A) the mean of the y values.
B) the mean of the x values.
C) the mean of the y values minus the mean of the x values.
D) None of the above.
A) the mean of the y values.
B) the mean of the x values.
C) the mean of the y values minus the mean of the x values.
D) None of the above.
فتح الحزمة
افتح القفل للوصول البطاقات البالغ عددها 104 في هذه المجموعة.
فتح الحزمة
k this deck
53
If the least-squares regression line is then what is the residual for the point (10, 5)?
A)
B) 3
C) 8
D)
then what is the residual for the point (10, 5)?A)
B) 3
C) 8
D)
فتح الحزمة
افتح القفل للوصول البطاقات البالغ عددها 104 في هذه المجموعة.
فتح الحزمة
k this deck
54
The slope of the least-squares regression line is:
A) the correlation between the variables.
B) the same sign as the correlation between the variables.
C) the opposite of the correlation between the variables.
D) the opposite sign of the correlation between the variables.
A) the correlation between the variables.
B) the same sign as the correlation between the variables.
C) the opposite of the correlation between the variables.
D) the opposite sign of the correlation between the variables.
فتح الحزمة
افتح القفل للوصول البطاقات البالغ عددها 104 في هذه المجموعة.
فتح الحزمة
k this deck
55
If the least-squares regression line is then what is the residual for the point (7, 5)?
A) 2
B) 3
C)
D)
then what is the residual for the point (7, 5)?A) 2
B) 3
C)
D)
فتح الحزمة
افتح القفل للوصول البطاقات البالغ عددها 104 في هذه المجموعة.
فتح الحزمة
k this deck
56
If the variables have a negative association, then their correlation:
A) must be less than −1.
B) must be between −1 and 0.
C) must be between 0 and 1.
D) must be greater than 1.
A) must be less than −1.
B) must be between −1 and 0.
C) must be between 0 and 1.
D) must be greater than 1.
فتح الحزمة
افتح القفل للوصول البطاقات البالغ عددها 104 في هذه المجموعة.
فتح الحزمة
k this deck
57
When the units of measurement are changed, what will happen to the least-squares regression line?
A) The slope will change its sign.
B) The y intercept will change its sign.
C)
D) The regression line will not be changed.
The sign of the slope and y intercept will remain fixed.
A) The slope will change its sign.
B) The y intercept will change its sign.
C)
D) The regression line will not be changed.
The sign of the slope and y intercept will remain fixed.
فتح الحزمة
افتح القفل للوصول البطاقات البالغ عددها 104 في هذه المجموعة.
فتح الحزمة
k this deck
58
If the points of a scatterplot lie on a straight line, then the correlation:
A) must be 1.
B) must be positive.
C) must be 0.
D) must be either 1 or −1.
A) must be 1.
B) must be positive.
C) must be 0.
D) must be either 1 or −1.
فتح الحزمة
افتح القفل للوصول البطاقات البالغ عددها 104 في هذه المجموعة.
فتح الحزمة
k this deck
59
Use the following scatterplot to answer Questions .
For the scatterplot shown above, what can you say about the least-squares regression line?
A) Its slope is positive.
B) It passes through the point (0,0).
C) It stops at y = 800.
D) None of the above.
For the scatterplot shown above, what can you say about the least-squares regression line?
A) Its slope is positive.
B) It passes through the point (0,0).
C) It stops at y = 800.
D) None of the above.
فتح الحزمة
افتح القفل للوصول البطاقات البالغ عددها 104 في هذه المجموعة.
فتح الحزمة
k this deck
60
If two variables named x and y have a strong positive association, then:
A) increasing x will cause y to increase.
B) making x positive will make y positive.
C) doubling x will cause y to double.
D) changes in x do not necessarily cause changes in y.
A) increasing x will cause y to increase.
B) making x positive will make y positive.
C) doubling x will cause y to double.
D) changes in x do not necessarily cause changes in y.
فتح الحزمة
افتح القفل للوصول البطاقات البالغ عددها 104 في هذه المجموعة.
فتح الحزمة
k this deck
61
An airline has determined that the relationship between the number of passengers (x) on a flight and the total weight (y) (in pounds) of luggage stored in the baggage compartment can be estimated by the least-squares regression equation y = 250 + 27x. Predict the weight of luggage for a flight with 125 passengers.
A) 402 pounds
B) 3625 pounds
C) 10,125 pounds
D) 34,625 pounds
A) 402 pounds
B) 3625 pounds
C) 10,125 pounds
D) 34,625 pounds
فتح الحزمة
افتح القفل للوصول البطاقات البالغ عددها 104 في هذه المجموعة.
فتح الحزمة
k this deck
62
To determine the effectiveness of group study sessions, a college instructor gathers data on hours of attendance and exam scores for students in the class. Which variable, hours of attendance or exam scores, would be the response variable for a least-squares regression equation?
A) hours of attendance
B) exam scores
A) hours of attendance
B) exam scores
فتح الحزمة
افتح القفل للوصول البطاقات البالغ عددها 104 في هذه المجموعة.
فتح الحزمة
k this deck
63
The least-squares regression equation y = 50 + 0.1x gives the yield in bushels per acre of corn when x pounds of fertilizer are applied. Predict the yield for a farmer who plans to use 320 pounds of fertilizer.
A) 82 bushels per acre
B) 16,032 bushels per acre
C) 37 bushels per acre
D) 50.32 bushels per acre
A) 82 bushels per acre
B) 16,032 bushels per acre
C) 37 bushels per acre
D) 50.32 bushels per acre
فتح الحزمة
افتح القفل للوصول البطاقات البالغ عددها 104 في هذه المجموعة.
فتح الحزمة
k this deck
64
Use the following scatterplot to answer Questions .
What conclusions can you reach if you hear 18 chirps a minute?
A) The temperature is about 87.
B) The temperature is about 90.
C) This is not a valid answer; 18 is not possible.
D) The data of the scatterplot are not valid.
What conclusions can you reach if you hear 18 chirps a minute?
A) The temperature is about 87.
B) The temperature is about 90.
C) This is not a valid answer; 18 is not possible.
D) The data of the scatterplot are not valid.
فتح الحزمة
افتح القفل للوصول البطاقات البالغ عددها 104 في هذه المجموعة.
فتح الحزمة
k this deck
65
To choose advertising media, a marketing analyst studies the relationship between a consumer's income and the amount spent on restaurant dining. Which variable, consumer's income or dining expenditures, would be the response variable for a least-squares regression equation?
A) consumer's income
B) dining expenditures
A) consumer's income
B) dining expenditures
فتح الحزمة
افتح القفل للوصول البطاقات البالغ عددها 104 في هذه المجموعة.
فتح الحزمة
k this deck
66
A data set has . Which of the following point is on the least-squares regression line?
A) (10,3)
B) (3,1)
C) (1,3)
D) (3,10)
A) (10,3)
B) (3,1)
C) (1,3)
D) (3,10)
فتح الحزمة
افتح القفل للوصول البطاقات البالغ عددها 104 في هذه المجموعة.
فتح الحزمة
k this deck
67
Use the following scatterplot to answer Questions .
What can you say about the correlation of the data?
A) The correlation is nearly 1.
B) The correlation is nearly −1.
C) The correlation is nearly 0.
D) The data have no correlation.
What can you say about the correlation of the data?
A) The correlation is nearly 1.
B) The correlation is nearly −1.
C) The correlation is nearly 0.
D) The data have no correlation.
فتح الحزمة
افتح القفل للوصول البطاقات البالغ عددها 104 في هذه المجموعة.
فتح الحزمة
k this deck
68
Use the following scatterplot to answer Questions .
For the scatterplot shown above, what y value would you expect to be paired with x = 9?
A) about 500
B) about 450
C) about 400
D) It's not possible to answer this question based on the data given.
For the scatterplot shown above, what y value would you expect to be paired with x = 9?
A) about 500
B) about 450
C) about 400
D) It's not possible to answer this question based on the data given.
فتح الحزمة
افتح القفل للوصول البطاقات البالغ عددها 104 في هذه المجموعة.
فتح الحزمة
k this deck
69
A typing service keeps data on the number of pages (x) in a manuscript and the length of time (y) (in hours) it takes to complete the typing. The least-squares regression line for the data is given by y = 20 + 0.273x. Use this to predict the amount of hours needed to type a 40-page manuscript.
A) 810.92
B) 60.273
C) 30.92
D) 16.38
A) 810.92
B) 60.273
C) 30.92
D) 16.38
فتح الحزمة
افتح القفل للوصول البطاقات البالغ عددها 104 في هذه المجموعة.
فتح الحزمة
k this deck
70
Use the following scatterplot to answer Questions .
What can you say about the association of the variables?
A) The variables are positively correlated.
B) The variables are negatively correlated.
C) The variables are not correlated.
D) The variables are not linearly correlated.
What can you say about the association of the variables?
A) The variables are positively correlated.
B) The variables are negatively correlated.
C) The variables are not correlated.
D) The variables are not linearly correlated.
فتح الحزمة
افتح القفل للوصول البطاقات البالغ عددها 104 في هذه المجموعة.
فتح الحزمة
k this deck
71
Suppose you are taking a survey of young children. If you measure their height and their weight, what do you expect to determine about these data?
A) There is no correlation between the data.
B) There is a positive correlation between the data.
C)
D) There is a negative correlation between the data.
There is both a negative and a positive correlation between the data.
A) There is no correlation between the data.
B) There is a positive correlation between the data.
C)
D) There is a negative correlation between the data.
There is both a negative and a positive correlation between the data.
فتح الحزمة
افتح القفل للوصول البطاقات البالغ عددها 104 في هذه المجموعة.
فتح الحزمة
k this deck
72
Use the following scatterplot to answer Questions .
What can you say about the slope of the least-squares regression line?
A) The slope is zero.
B) The slope is positive.
C) The slope is negative.
D) The slope varies.
What can you say about the slope of the least-squares regression line?
A) The slope is zero.
B) The slope is positive.
C) The slope is negative.
D) The slope varies.
فتح الحزمة
افتح القفل للوصول البطاقات البالغ عددها 104 في هذه المجموعة.
فتح الحزمة
k this deck
73
Use the following scatterplot to answer Questions .
What can you say about outliers in the data set?
A) There are no apparent outliers.
B) There is only one outlier.
C) There are only two outliers.
D) There are many outliers.
What can you say about outliers in the data set?
A) There are no apparent outliers.
B) There is only one outlier.
C) There are only two outliers.
D) There are many outliers.
فتح الحزمة
افتح القفل للوصول البطاقات البالغ عددها 104 في هذه المجموعة.
فتح الحزمة
k this deck
74
Use the following scatterplot to answer Questions .
For the scatterplot shown above, what can you say about the correlation?
A) It is almost 0.
B) It is between 0 and 1.
C) It is exactly 1.
D) It is greater than 1.
For the scatterplot shown above, what can you say about the correlation?
A) It is almost 0.
B) It is between 0 and 1.
C) It is exactly 1.
D) It is greater than 1.
فتح الحزمة
افتح القفل للوصول البطاقات البالغ عددها 104 في هذه المجموعة.
فتح الحزمة
k this deck
75
A university admissions counselor wishes to predict the performance of freshmen by considering their SAT scores. Which variable, freshman GPA or SAT score, would be the explanatory variable in a least squares regression equation?
A) freshman GPA
B) SAT score
A) freshman GPA
B) SAT score
فتح الحزمة
افتح القفل للوصول البطاقات البالغ عددها 104 في هذه المجموعة.
فتح الحزمة
k this deck
76
A data set has . Which of the following point is on the least-squares regression line?
A) (2,3)
B) (2,7)
C) (3,3)
D) (7,3)
A) (2,3)
B) (2,7)
C) (3,3)
D) (7,3)
فتح الحزمة
افتح القفل للوصول البطاقات البالغ عددها 104 في هذه المجموعة.
فتح الحزمة
k this deck
77
A bank collects data on the savings and incomes of families to predict an expected increase in certificate of deposit accounts due to a 10% increase in salaries of employees at a local company. Which variable, savings or income, would be the explanatory variable?
A) family savings
B) family income
A) family savings
B) family income
فتح الحزمة
افتح القفل للوصول البطاقات البالغ عددها 104 في هذه المجموعة.
فتح الحزمة
k this deck
78
For professional baseball players, one would expect a negative correlation between:
A) batting average and salary.
B) years of play and salary.
C) number of home runs and salary.
D) number of errors and salary.
A) batting average and salary.
B) years of play and salary.
C) number of home runs and salary.
D) number of errors and salary.
فتح الحزمة
افتح القفل للوصول البطاقات البالغ عددها 104 في هذه المجموعة.
فتح الحزمة
k this deck
79
Use the following scatterplot to answer Questions .
What can you say about the correlation?
A) The correlation is greater than 1.
B) The correlation is exactly 1.
C) The correlation is between 0 and 1.
D) The correlation is negative.
What can you say about the correlation?
A) The correlation is greater than 1.
B) The correlation is exactly 1.
C) The correlation is between 0 and 1.
D) The correlation is negative.
فتح الحزمة
افتح القفل للوصول البطاقات البالغ عددها 104 في هذه المجموعة.
فتح الحزمة
k this deck
80
While you are running on a treadmill, you would expect a positive correlation between:
A) time you spend and calories you will burn.
B)
C)
D) time you spend and your weight.
Time you spend and average running speed.
None of the above.
A) time you spend and calories you will burn.
B)
C)
D) time you spend and your weight.
Time you spend and average running speed.
None of the above.
فتح الحزمة
افتح القفل للوصول البطاقات البالغ عددها 104 في هذه المجموعة.
فتح الحزمة
k this deck
فتح الحزمة
افتح القفل للوصول البطاقات البالغ عددها 104 في هذه المجموعة.


