Deck 7: Confidence Intervals and Sample Size
ملء الشاشة (f)
سؤال
An economics professor randomly selected 100 millionaires in the United States. The average age of these millionaires was 54.8 years. If the standard deviation of the entire population of millionaires is 7.9 years, find the 95% confidence interval for the mean age of all United States millionaires.
A)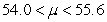
B)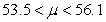
C)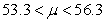
D)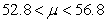
A)
B)
C)
D)
سؤال
A sample of 35 different payroll departments found that employees worked an average of 240.6 days a year. If the population standard deviation is 18.8 days, find the 90% confidence interval for the average number of days  worked by all employees who are paid through payroll departments.
A)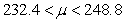
B)
C)
D)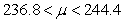
worked by all employees who are paid through payroll departments.A)
B)
C)
D)
سؤال
The formula for the confidence interval of the mean for a specific  is ____________________.
is ____________________. سؤال
سؤال
سؤال
A study of 65 bolts of carpet showed that their average length was 76.2 yards. The standard deviation of the population is 2.6 yards. Which of the following is the 80% confidence interval for the mean length per bolt of carpet?
A)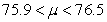
B)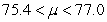
C)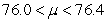
D)
A)
B)
C)
D)
سؤال
The term 
describes the ___________________.
A) unbiased estimator
B) confidence interval
C) maximum error of estimate
D) interval estimate
describes the ___________________.
A) unbiased estimator
B) confidence interval
C) maximum error of estimate
D) interval estimate
سؤال
سؤال
سؤال
سؤال
A random sample of magnesium concentrations (in parts per million, or ppm) in ground water from various locations follows. Estimate the mean concentration of magnesium in ppm with 90% confidence. Assume  .
. 
A)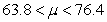
B)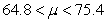
C)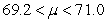
D)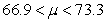
. A)
B)
C)
D)
سؤال
A student looked up the number of years served by 35 of the more than 100 Supreme Court justices. The average number of years served by those 35 justices was 13.8. If the standard deviation of the entire population is 7.3 years, find the 95% confidence interval for the average number of years served by all Supreme Court justices.
A)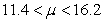
B)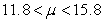
C)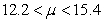
D)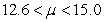
A)
B)
C)
D)
سؤال
سؤال
A study of 50 white mice showed that their average weight was 4.2 ounces. The standard deviation of the population is 0.7 ounces. Which of the following is the 90% confidence interval for the mean weight per white mouse?
A)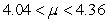
B)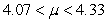
C)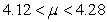
D)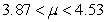
A)
B)
C)
D)
سؤال
A study of 45 professors showed that the average time they spent creating test questions was 15.5 minutes per question. The standard deviation of the population is 5.8. Which of the following is the 98% confidence interval for the average number of minutes it takes to create a test question?
A)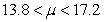
B)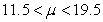
C)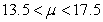
D)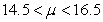
A)
B)
C)
D)
سؤال
سؤال
A study of 75 apple trees showed that the average number of apples per tree was 925. The standard deviation of the population is 100. Which of the following is the 95% confidence interval for the mean number of apples per tree for all trees?
A)
B)
C)
D)
A)
B)
C)
D)
سؤال
سؤال
What value of  is used in confidence interval shown below?
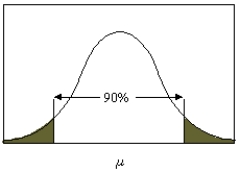
is used in confidence interval shown below? سؤال
سؤال
سؤال
A recent study of 750 internet users in Europe found that 35% of internet users were women. What is the 95% confidence interval of the true proportion of women in Europe who use the internet?
A)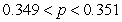
B)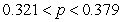
C)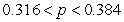
D)

A)
B)
C)
D)
سؤال
The prices (in dollars) for a graphing calculator are shown below for 8 online vendors. Estimate the true mean price for this particular calculator with 95% confidence. 
A)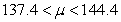
B)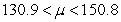
C)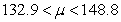
D)
A)
B)
C)
D)
سؤال
Find  when n = 23 for the 99% confidence interval for the mean.
A) 2.82
B) 2.51
C) 1.94
D) 3.46
when n = 23 for the 99% confidence interval for the mean.A) 2.82
B) 2.51
C) 1.94
D) 3.46
سؤال
سؤال
سؤال
سؤال
In a study of 100 new cars, 30 are white. Find  and
and  , where
  is the proportion of new cars that are white.
A)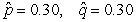
B)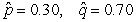
C)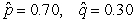
D)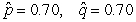
and , where is the proportion of new cars that are white.A)
B)
C)
D)
سؤال
A food snack manufacturer samples 7 bags of pretzels off the assembly line and weighs their contents. If the sample mean is 14.2 oz. and the sample standard deviation is 0.60 oz., find the 95% confidence interval of the true mean.
A)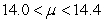
B)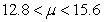
C)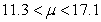
D)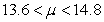
A)
B)
C)
D)
سؤال
سؤال
سؤال
سؤال
The winning team's score in 7 high school basketball games was recorded. If the sample mean is 68.3 points and the sample standard deviation is 13.0 points, find the 98% confidence interval of the true mean.
A)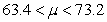
B)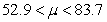
C)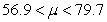
D)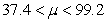
A)
B)
C)
D)
سؤال
Identify the degree of confidence displayed in the confidence interval shown below. 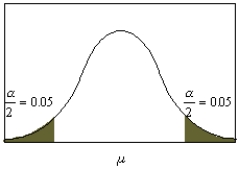
A) 90%
B) 95%
C) 98%
D) 99%
A) 90%
B) 95%
C) 98%
D) 99%
سؤال
What is the value of used in describing the confidence interval shown below. 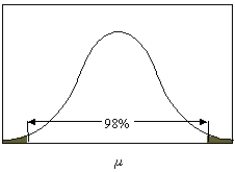
A) 0.01
B) 0.02
C) 0.04
D) 0.05
A) 0.01
B) 0.02
C) 0.04
D) 0.05
سؤال
سؤال
The value of  used in the figure below is 0.02.
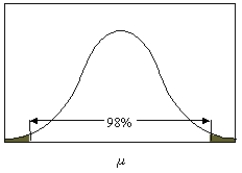
used in the figure below is 0.02. سؤال
سؤال
سؤال
3 squirrels were found to have an average weight of 9.3 ounces with a sample standard deviation is 1.1. Find the 95% confidence interval of the true mean weight.
A)
B)
C)
D)
A)
B)
C)
D)
سؤال
سؤال
It was found that in a sample of 90 teenage boys, 70% of them have received speeding tickets. What is the 90% confidence interval of the true proportion of teenage boys who have received speeding tickets?
A)
B)
C)
D)

A)
B)
C)
D)
سؤال
سؤال
سؤال
سؤال
سؤال
سؤال
سؤال
سؤال
سؤال
سؤال
A survey of 800 women shoppers found that 17% of them shop on impulse. What is the 98% confidence interval for the true proportion of women shoppers who shop on impulse?
A)
B)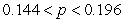
C)
D)
A)
B)
C)
D)
سؤال
سؤال
سؤال
سؤال
If  is equal to 0.85, then
  is equal to ______.
A) 0.85
B) 0.50
C) 0.40
D) 0.15
is equal to 0.85, then is equal to ______.A) 0.85
B) 0.50
C) 0.40
D) 0.15
سؤال
سؤال
سؤال
The Pizza Shop wanted to determine what proportion of its customers ordered only cheese pizza. Out of 80 customers surveyed, 15 ordered only cheese pizza. What is the 99% confidence interval of the true proportion of customers who order only cheese pizza?
A)
B)
C)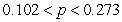
D)
A)
B)
C)
D)
سؤال
سؤال
The value for  for a 99% confidence interval when n = 24 is 9.262.
for a 99% confidence interval when n = 24 is 9.262. سؤال
سؤال
سؤال
سؤال
What is the value for  for a 95% confidence interval when n = 18?
A) 7.564
B) 8.672
C) 9.390
D) 8.231
for a 95% confidence interval when n = 18?A) 7.564
B) 8.672
C) 9.390
D) 8.231
سؤال
The prices (in dollars) for a graphing calculator are shown below for 8 online vendors. Estimate the population standard deviation in price with 90% confidence. 
A)
B)
C)
D)
A)
B)
C)
D)
سؤال
Find the 95% confidence interval for the standard deviation of the lengths of pipes if a sample of 11 pipes has a standard deviation of 14.6 inches.
A)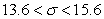
B)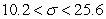
C)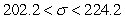
D)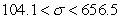
A)
B)
C)
D)
سؤال
What is the value for  for a 98% confidence interval when n = 12?
A) 27.688
B) 24.725
C) 21.920
D) 26.217
for a 98% confidence interval when n = 12?A) 27.688
B) 24.725
C) 21.920
D) 26.217
سؤال
Find the 95% confidence interval for the variance of the heights of maple trees if a sample of 11 trees has a standard deviation of 12.2 feet.
A) 11.2 < < 13.2
B) 8.5 < < 21.4
C) 137.8 < < 159.8
D) 72.7 < < 458.4
A) 11.2 <
< 13.2B) 8.5 <
< 21.4C) 137.8 <
< 159.8D) 72.7 <
< 458.4 سؤال
What is the 95% confidence interval for the standard deviation of birth weights at County General Hospital, if the standard deviation of the last 25 babies born there was 1.1 pounds?
A)
B)
C)
D)
A)
B)
C)
D)
سؤال
For a random sample of 23 European countries, the variance on life expectancy was 7.3 years. What is the 95% confidence interval for the variance of life expectancy in all of Europe?
A)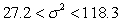
B)
C)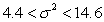
D)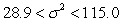
A)
B)
C)
D)
سؤال
سؤال
The value for  for a 95% confidence interval when n = 15 is 26.119.
for a 95% confidence interval when n = 15 is 26.119. سؤال
Find the values for  and
and  when
when  = .05 and n = 27.
A) 13.844 and 41.923
B) 14.573 and 43.194
C) 15.379 and 38.885
D) 16.151 and 40.113
and when = .05 and n = 27.A) 13.844 and 41.923
B) 14.573 and 43.194
C) 15.379 and 38.885
D) 16.151 and 40.113
سؤال
What is the 90% confidence interval for the variance of exam scores for 28 algebra students, if the standard deviation of their last exam was 12.7?
A)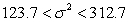
B)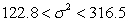
C)
D)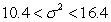
A)
B)
C)
D)

فتح الحزمة
قم بالتسجيل لفتح البطاقات في هذه المجموعة!
Unlock Deck
Unlock Deck
1/75
العب
ملء الشاشة (f)
Deck 7: Confidence Intervals and Sample Size
1
An economics professor randomly selected 100 millionaires in the United States. The average age of these millionaires was 54.8 years. If the standard deviation of the entire population of millionaires is 7.9 years, find the 95% confidence interval for the mean age of all United States millionaires.
A)
B)
C)
D)
A)
B)
C)
D)
C
2
A sample of 35 different payroll departments found that employees worked an average of 240.6 days a year. If the population standard deviation is 18.8 days, find the 90% confidence interval for the average number of days worked by all employees who are paid through payroll departments.
A)
B)
C)
D)
worked by all employees who are paid through payroll departments.A)
B)
C)
D)
C
3
The formula for the confidence interval of the mean for a specific is ____________________.
is ____________________.
4
If a population has a standard deviation of 16, what is the minimum number of samples that need to be averaged in order to be 95% confident that the average of the means is within 3 of the true mean?
A) 216
B) 11
C) 110
D) 22
A) 216
B) 11
C) 110
D) 22
فتح الحزمة
افتح القفل للوصول البطاقات البالغ عددها 75 في هذه المجموعة.
فتح الحزمة
k this deck
5
A study of peach trees found that the average number of peaches per tree was 525. The standard deviation of the population is 105 peaches per tree. A scientist wishes to find the 80% confidence interval for the mean number of peaches per tree. How many trees does she need to sample to obtain an average accurate to within 12 peaches per tree?
A) 77
B) 55
C) 83
D) 126
A) 77
B) 55
C) 83
D) 126
فتح الحزمة
افتح القفل للوصول البطاقات البالغ عددها 75 في هذه المجموعة.
فتح الحزمة
k this deck
6
A study of 65 bolts of carpet showed that their average length was 76.2 yards. The standard deviation of the population is 2.6 yards. Which of the following is the 80% confidence interval for the mean length per bolt of carpet?
A)
B)
C)
D)
A)
B)
C)
D)
فتح الحزمة
افتح القفل للوصول البطاقات البالغ عددها 75 في هذه المجموعة.
فتح الحزمة
k this deck
7
The term
describes the ___________________.
A) unbiased estimator
B) confidence interval
C) maximum error of estimate
D) interval estimate
describes the ___________________.
A) unbiased estimator
B) confidence interval
C) maximum error of estimate
D) interval estimate
فتح الحزمة
افتح القفل للوصول البطاقات البالغ عددها 75 في هذه المجموعة.
فتح الحزمة
k this deck
8
The confidence level of an interval estimate of a parameter is the probability that the interval estimate will contain the parameter.
فتح الحزمة
افتح القفل للوصول البطاقات البالغ عددها 75 في هذه المجموعة.
فتح الحزمة
k this deck
9
According to a study of 90 truckers, a trucker drives, on average, 540 miles per day. If the standard deviation of the miles driven per day for the population of truckers is 40, find the 99% confidence interval of the mean number of miles driven per day by all truckers.
فتح الحزمة
افتح القفل للوصول البطاقات البالغ عددها 75 في هذه المجموعة.
فتح الحزمة
k this deck
10
The average score for 49 teenage boys playing a certain computer game was 80,000 points per player. If the standard deviation of the population is 20,000 points, find the 95% confidence interval of the mean score for all teenage boys.
فتح الحزمة
افتح القفل للوصول البطاقات البالغ عددها 75 في هذه المجموعة.
فتح الحزمة
k this deck
11
A random sample of magnesium concentrations (in parts per million, or ppm) in ground water from various locations follows. Estimate the mean concentration of magnesium in ppm with 90% confidence. Assume .
A)
B)
C)
D)
. A)
B)
C)
D)
فتح الحزمة
افتح القفل للوصول البطاقات البالغ عددها 75 في هذه المجموعة.
فتح الحزمة
k this deck
12
A student looked up the number of years served by 35 of the more than 100 Supreme Court justices. The average number of years served by those 35 justices was 13.8. If the standard deviation of the entire population is 7.3 years, find the 95% confidence interval for the average number of years served by all Supreme Court justices.
A)
B)
C)
D)
A)
B)
C)
D)
فتح الحزمة
افتح القفل للوصول البطاقات البالغ عددها 75 في هذه المجموعة.
فتح الحزمة
k this deck
13
An interval estimate may or may not contain the true value of the parameter being estimated.
فتح الحزمة
افتح القفل للوصول البطاقات البالغ عددها 75 في هذه المجموعة.
فتح الحزمة
k this deck
14
A study of 50 white mice showed that their average weight was 4.2 ounces. The standard deviation of the population is 0.7 ounces. Which of the following is the 90% confidence interval for the mean weight per white mouse?
A)
B)
C)
D)
A)
B)
C)
D)
فتح الحزمة
افتح القفل للوصول البطاقات البالغ عددها 75 في هذه المجموعة.
فتح الحزمة
k this deck
15
A study of 45 professors showed that the average time they spent creating test questions was 15.5 minutes per question. The standard deviation of the population is 5.8. Which of the following is the 98% confidence interval for the average number of minutes it takes to create a test question?
A)
B)
C)
D)
A)
B)
C)
D)
فتح الحزمة
افتح القفل للوصول البطاقات البالغ عددها 75 في هذه المجموعة.
فتح الحزمة
k this deck
16
The average number of mosquitos caught in 81 mosquito traps in a particular environment was 900 per trap. The standard deviation of mosquitos caught in the entire population of traps is 150 mosquitos. What is the 99% confidence interval for the true mean number of mosquitos caught in all mosquito traps?
فتح الحزمة
افتح القفل للوصول البطاقات البالغ عددها 75 في هذه المجموعة.
فتح الحزمة
k this deck
17
A study of 75 apple trees showed that the average number of apples per tree was 925. The standard deviation of the population is 100. Which of the following is the 95% confidence interval for the mean number of apples per tree for all trees?
A)
B)
C)
D)
A)
B)
C)
D)
فتح الحزمة
افتح القفل للوصول البطاقات البالغ عددها 75 في هذه المجموعة.
فتح الحزمة
k this deck
18
The ______________________ is the maximum likely difference between the point estimate of a parameter and the actual value of the parameter.
فتح الحزمة
افتح القفل للوصول البطاقات البالغ عددها 75 في هذه المجموعة.
فتح الحزمة
k this deck
19
What value of is used in confidence interval shown below?
is used in confidence interval shown below? فتح الحزمة
افتح القفل للوصول البطاقات البالغ عددها 75 في هذه المجموعة.
فتح الحزمة
k this deck
20
When computing a confidence interval for a population mean using raw data, round off to two more decimal places than the number of decimal places in the original data.
فتح الحزمة
افتح القفل للوصول البطاقات البالغ عددها 75 في هذه المجموعة.
فتح الحزمة
k this deck
21
In a study using 8 samples, and in which the population variance is unknown, the distribution that should be used to calculate confidence intervals is
A) a standard normal distribution.
B) a t distribution with 7 degrees of freedom.
C) a t distribution with 8 degrees of freedom.
D) a t distribution with 9 degrees of freedom.
A) a standard normal distribution.
B) a t distribution with 7 degrees of freedom.
C) a t distribution with 8 degrees of freedom.
D) a t distribution with 9 degrees of freedom.
فتح الحزمة
افتح القفل للوصول البطاقات البالغ عددها 75 في هذه المجموعة.
فتح الحزمة
k this deck
22
A recent study of 750 internet users in Europe found that 35% of internet users were women. What is the 95% confidence interval of the true proportion of women in Europe who use the internet?
A)
B)
C)
D)
A)
B)
C)
D)
فتح الحزمة
افتح القفل للوصول البطاقات البالغ عددها 75 في هذه المجموعة.
فتح الحزمة
k this deck
23
The prices (in dollars) for a graphing calculator are shown below for 8 online vendors. Estimate the true mean price for this particular calculator with 95% confidence.
A)
B)
C)
D)
A)
B)
C)
D)
فتح الحزمة
افتح القفل للوصول البطاقات البالغ عددها 75 في هذه المجموعة.
فتح الحزمة
k this deck
24
Find when n = 23 for the 99% confidence interval for the mean.
A) 2.82
B) 2.51
C) 1.94
D) 3.46
when n = 23 for the 99% confidence interval for the mean.A) 2.82
B) 2.51
C) 1.94
D) 3.46
فتح الحزمة
افتح القفل للوصول البطاقات البالغ عددها 75 في هذه المجموعة.
فتح الحزمة
k this deck
25
One of the characteristics of the t-distribution is that the curve never touches the ____-axis.
فتح الحزمة
افتح القفل للوصول البطاقات البالغ عددها 75 في هذه المجموعة.
فتح الحزمة
k this deck
26
Jennifer wants to find a 95% confidence interval for the time it takes her to get to work. She kept records for 30 days and found her average time to commute to work was 20.5 minutes with a standard deviation for the population of 3.9 minutes. Jennifer's margin of error would be 1.4 minutes.
فتح الحزمة
افتح القفل للوصول البطاقات البالغ عددها 75 في هذه المجموعة.
فتح الحزمة
k this deck
27
The _________________ are the number of values that are free to vary after a sample statistic has been computed.
فتح الحزمة
افتح القفل للوصول البطاقات البالغ عددها 75 في هذه المجموعة.
فتح الحزمة
k this deck
28
In a study of 100 new cars, 30 are white. Find and , where is the proportion of new cars that are white.
A)
B)
C)
D)
and , where is the proportion of new cars that are white.A)
B)
C)
D)
فتح الحزمة
افتح القفل للوصول البطاقات البالغ عددها 75 في هذه المجموعة.
فتح الحزمة
k this deck
29
A food snack manufacturer samples 7 bags of pretzels off the assembly line and weighs their contents. If the sample mean is 14.2 oz. and the sample standard deviation is 0.60 oz., find the 95% confidence interval of the true mean.
A)
B)
C)
D)
A)
B)
C)
D)
فتح الحزمة
افتح القفل للوصول البطاقات البالغ عددها 75 في هذه المجموعة.
فتح الحزمة
k this deck
30
A study of elephants is conducted to determine the average weight of a certain subspecies of elephants. The standard deviation for the population is 1500 pounds. At a 95% level, how many elephants need to be weighed so the average weight will be accurate to within 250 pounds?
A) 139
B) 165
C) 196
D) 324
A) 139
B) 165
C) 196
D) 324
فتح الحزمة
افتح القفل للوصول البطاقات البالغ عددها 75 في هذه المجموعة.
فتح الحزمة
k this deck
31
The t-distribution must be used when the sample size is greater than 30 and the variable is normally or approximately normally distributed.
فتح الحزمة
افتح القفل للوصول البطاقات البالغ عددها 75 في هذه المجموعة.
فتح الحزمة
k this deck
32
A study of nickels showed that the the standard deviation of the weight of nickels is 150 milligrams. A coin counter manufacturer wishes to find the 80% confidence interval for the average weight of a nickel. How many nickels does he need to weigh to obtain an average accurate to within 10 milligrams?
A) 225
B) 369
C) 613
D) 159
A) 225
B) 369
C) 613
D) 159
فتح الحزمة
افتح القفل للوصول البطاقات البالغ عددها 75 في هذه المجموعة.
فتح الحزمة
k this deck
33
The winning team's score in 7 high school basketball games was recorded. If the sample mean is 68.3 points and the sample standard deviation is 13.0 points, find the 98% confidence interval of the true mean.
A)
B)
C)
D)
A)
B)
C)
D)
فتح الحزمة
افتح القفل للوصول البطاقات البالغ عددها 75 في هذه المجموعة.
فتح الحزمة
k this deck
34
Identify the degree of confidence displayed in the confidence interval shown below.
A) 90%
B) 95%
C) 98%
D) 99%
A) 90%
B) 95%
C) 98%
D) 99%
فتح الحزمة
افتح القفل للوصول البطاقات البالغ عددها 75 في هذه المجموعة.
فتح الحزمة
k this deck
35
What is the value of used in describing the confidence interval shown below.
A) 0.01
B) 0.02
C) 0.04
D) 0.05
A) 0.01
B) 0.02
C) 0.04
D) 0.05
فتح الحزمة
افتح القفل للوصول البطاقات البالغ عددها 75 في هذه المجموعة.
فتح الحزمة
k this deck
36
The t-distribution has a variance that is greater than one.
فتح الحزمة
افتح القفل للوصول البطاقات البالغ عددها 75 في هذه المجموعة.
فتح الحزمة
k this deck
37
The value of used in the figure below is 0.02.
used in the figure below is 0.02. فتح الحزمة
افتح القفل للوصول البطاقات البالغ عددها 75 في هذه المجموعة.
فتح الحزمة
k this deck
38
A previous analysis of paper boxes showed that the the standard deviation of their lengths is 15 millimeters. A packer wishes to find the 90% confidence interval for the average length of a box. How many boxes does he need to measure to be accurate within 3 millimeters?
A) 25
B) 97
C) 69
D) 41
A) 25
B) 97
C) 69
D) 41
فتح الحزمة
افتح القفل للوصول البطاقات البالغ عددها 75 في هذه المجموعة.
فتح الحزمة
k this deck
39
A researcher conducted a study of the access speed of 45 hard drives and concluded that his maximum error of estimate was 20. If he were to conduct a second study to reduce the maximum error of estimate to 5, about how many hard drives should he include in his new sample?
A) 45
B) 90
C) 180
D) 720
A) 45
B) 90
C) 180
D) 720
فتح الحزمة
افتح القفل للوصول البطاقات البالغ عددها 75 في هذه المجموعة.
فتح الحزمة
k this deck
40
3 squirrels were found to have an average weight of 9.3 ounces with a sample standard deviation is 1.1. Find the 95% confidence interval of the true mean weight.
A)
B)
C)
D)
A)
B)
C)
D)
فتح الحزمة
افتح القفل للوصول البطاقات البالغ عددها 75 في هذه المجموعة.
فتح الحزمة
k this deck
41
A report states that 40% of home owners had a vegetable garden. How large a sample is needed to estimate the true proportion of home owners who have vegetable gardens to within 3% with 99% confidence?
A) 444
B) 888
C) 1776
D) 3552
A) 444
B) 888
C) 1776
D) 3552
فتح الحزمة
افتح القفل للوصول البطاقات البالغ عددها 75 في هذه المجموعة.
فتح الحزمة
k this deck
42
It was found that in a sample of 90 teenage boys, 70% of them have received speeding tickets. What is the 90% confidence interval of the true proportion of teenage boys who have received speeding tickets?
A)
B)
C)
D)
A)
B)
C)
D)
فتح الحزمة
افتح القفل للوصول البطاقات البالغ عددها 75 في هذه المجموعة.
فتح الحزمة
k this deck
43
The rounding rule for a confidence interval for a proportion is to round off to three decimal places.
فتح الحزمة
افتح القفل للوصول البطاقات البالغ عددها 75 في هذه المجموعة.
فتح الحزمة
k this deck
44
A report states that 44% of home owners have a vegetable garden. How large a sample is needed to estimate the true proportion of home owners who have vegetable gardens to within 3 percentage points with 92% confidence?
A) 247
B) 420
C) 545
D) 839
A) 247
B) 420
C) 545
D) 839
فتح الحزمة
افتح القفل للوصول البطاقات البالغ عددها 75 في هذه المجموعة.
فتح الحزمة
k this deck
45
A random sample of 70 printers discovered that 25 of them were being used in small businesses . Find the 95% limit for the population proportion of printers that are used in small businesses.
A) 0.150 < p < 0.564
B) 0.245 < p < 0.469
C) 0.263 < p < 0.452
D) 0.320 < p < 0.395
A) 0.150 < p < 0.564
B) 0.245 < p < 0.469
C) 0.263 < p < 0.452
D) 0.320 < p < 0.395
فتح الحزمة
افتح القفل للوصول البطاقات البالغ عددها 75 في هذه المجموعة.
فتح الحزمة
k this deck
46
The Academy of Orthopedic Surgeons states that 80% of women wear shoes that are too small for their feet. A researcher wants to be 98% confident that this proportion is within 3 percentage points of the true proportion. How large a sample is necessary?
A) 966
B) 683
C) 1183
D) 484
A) 966
B) 683
C) 1183
D) 484
فتح الحزمة
افتح القفل للوصول البطاقات البالغ عددها 75 في هذه المجموعة.
فتح الحزمة
k this deck
47
A retailer wants to estimate with 99% confidence the number of people who shop at his store. A previous study showed that 24% of those interviewed had shopped at his store. He wishes to be accurate within 3% of the true proportion. The minimum sample size necessary would be 1,100.
فتح الحزمة
افتح القفل للوصول البطاقات البالغ عددها 75 في هذه المجموعة.
فتح الحزمة
k this deck
48
John Davis, a manager of a supermarket, wants to estimate the proportion of customers who use food stamps at his store. He has no initial estimate of what the sample proportion will be. How large a sample is required to estimate the true proportion to within 3 percentage points with 98% confidence?
A) 756
B) 1,849
C) 1,067
D) 1,509
A) 756
B) 1,849
C) 1,067
D) 1,509
فتح الحزمة
افتح القفل للوصول البطاقات البالغ عددها 75 في هذه المجموعة.
فتح الحزمة
k this deck
49
In a sample of 855 bartenders, 48.0% report hearing complaints from patrons about their jobs. If the margin of error for the proportion of bartenders hearing job complaints is 4.4 percentage points, what is the degree of confidence used?
A) 90%
B) 95%
C) 98%
D) 99%
A) 90%
B) 95%
C) 98%
D) 99%
فتح الحزمة
افتح القفل للوصول البطاقات البالغ عددها 75 في هذه المجموعة.
فتح الحزمة
k this deck
50
A college believes that 22% of applicants to that school have parents who have remarried. How large a sample is needed to estimate the true proportion of students who have parents who have remarried to within 5 percentage points with 99% confidence?
A) 153
B) 373
C) 457
D) 686
A) 153
B) 373
C) 457
D) 686
فتح الحزمة
افتح القفل للوصول البطاقات البالغ عددها 75 في هذه المجموعة.
فتح الحزمة
k this deck
51
The symbol for the sample proportion is ______.
فتح الحزمة
افتح القفل للوصول البطاقات البالغ عددها 75 في هذه المجموعة.
فتح الحزمة
k this deck
52
A survey of 800 women shoppers found that 17% of them shop on impulse. What is the 98% confidence interval for the true proportion of women shoppers who shop on impulse?
A)
B)
C)
D)
A)
B)
C)
D)
فتح الحزمة
افتح القفل للوصول البطاقات البالغ عددها 75 في هذه المجموعة.
فتح الحزمة
k this deck
53
In a sample of 40 mice, a biologist found that 42% were able to run a maze in 30 seconds or less. Find the 90% limit for the population proportion of mice who can run a maze in 30 seconds or less.
A) 35.6% < p < 48.4%
B) 32.0% < p < 52.0%
C) 29.1% < p < 54.9%
D) 22.7% < p < 61.3%
A) 35.6% < p < 48.4%
B) 32.0% < p < 52.0%
C) 29.1% < p < 54.9%
D) 22.7% < p < 61.3%
فتح الحزمة
افتح القفل للوصول البطاقات البالغ عددها 75 في هذه المجموعة.
فتح الحزمة
k this deck
54
A chi-square distribution is negatively skewed.
فتح الحزمة
افتح القفل للوصول البطاقات البالغ عددها 75 في هذه المجموعة.
فتح الحزمة
k this deck
55
A quality control expert wants to estimate the proportion of defective components that are being manufactured by his company. A sample of 300 components showed that 20 were defective. How large a sample is needed to estimate the true proportion of defective components to within 2.5 percentage points with 99% confidence?
فتح الحزمة
افتح القفل للوصول البطاقات البالغ عددها 75 في هذه المجموعة.
فتح الحزمة
k this deck
56
If is equal to 0.85, then is equal to ______.
A) 0.85
B) 0.50
C) 0.40
D) 0.15
is equal to 0.85, then is equal to ______.A) 0.85
B) 0.50
C) 0.40
D) 0.15
فتح الحزمة
افتح القفل للوصول البطاقات البالغ عددها 75 في هذه المجموعة.
فتح الحزمة
k this deck
57
A sample of 400 racing cars showed that 80 of them cost over $700,000. What is the 99% confidence interval for the true proportion of racing cars that cost over $700,000?
فتح الحزمة
افتح القفل للوصول البطاقات البالغ عددها 75 في هذه المجموعة.
فتح الحزمة
k this deck
58
A recent poll of 700 people who work indoors found that 278 smoke. If the researchers want to be 98% confident of their results to within 3.5 percentage points, how large a sample is necessary?
A) 751
B) 1062
C) 33
D) 532
A) 751
B) 1062
C) 33
D) 532
فتح الحزمة
افتح القفل للوصول البطاقات البالغ عددها 75 في هذه المجموعة.
فتح الحزمة
k this deck
59
The Pizza Shop wanted to determine what proportion of its customers ordered only cheese pizza. Out of 80 customers surveyed, 15 ordered only cheese pizza. What is the 99% confidence interval of the true proportion of customers who order only cheese pizza?
A)
B)
C)
D)
A)
B)
C)
D)
فتح الحزمة
افتح القفل للوصول البطاقات البالغ عددها 75 في هذه المجموعة.
فتح الحزمة
k this deck
60
A random sample of 100 voters found that 46% were going to vote for a certain candidate. Find the 95% limit for the population proportion of voters who will vote for that candidate.
A) 36.2% < p < 55.8%
B) 37.0% < p < 55.0%
C) 37.8% < p < 54.2%
D) 41.1% < p < 50.9%
A) 36.2% < p < 55.8%
B) 37.0% < p < 55.0%
C) 37.8% < p < 54.2%
D) 41.1% < p < 50.9%
فتح الحزمة
افتح القفل للوصول البطاقات البالغ عددها 75 في هذه المجموعة.
فتح الحزمة
k this deck
61
The value for for a 99% confidence interval when n = 24 is 9.262.
for a 99% confidence interval when n = 24 is 9.262. فتح الحزمة
افتح القفل للوصول البطاقات البالغ عددها 75 في هذه المجموعة.
فتح الحزمة
k this deck
62
A chi-square variable cannot be negative, and the distributions are positively skewed.
فتح الحزمة
افتح القفل للوصول البطاقات البالغ عددها 75 في هذه المجموعة.
فتح الحزمة
k this deck
63
The formula for the confidence interval for a standard deviation is ____________________.
فتح الحزمة
افتح القفل للوصول البطاقات البالغ عددها 75 في هذه المجموعة.
فتح الحزمة
k this deck
64
The area under each chi-square distribution is equal to _______.
فتح الحزمة
افتح القفل للوصول البطاقات البالغ عددها 75 في هذه المجموعة.
فتح الحزمة
k this deck
65
What is the value for for a 95% confidence interval when n = 18?
A) 7.564
B) 8.672
C) 9.390
D) 8.231
for a 95% confidence interval when n = 18?A) 7.564
B) 8.672
C) 9.390
D) 8.231
فتح الحزمة
افتح القفل للوصول البطاقات البالغ عددها 75 في هذه المجموعة.
فتح الحزمة
k this deck
66
The prices (in dollars) for a graphing calculator are shown below for 8 online vendors. Estimate the population standard deviation in price with 90% confidence.
A)
B)
C)
D)
A)
B)
C)
D)
فتح الحزمة
افتح القفل للوصول البطاقات البالغ عددها 75 في هذه المجموعة.
فتح الحزمة
k this deck
67
Find the 95% confidence interval for the standard deviation of the lengths of pipes if a sample of 11 pipes has a standard deviation of 14.6 inches.
A)
B)
C)
D)
A)
B)
C)
D)
فتح الحزمة
افتح القفل للوصول البطاقات البالغ عددها 75 في هذه المجموعة.
فتح الحزمة
k this deck
68
What is the value for for a 98% confidence interval when n = 12?
A) 27.688
B) 24.725
C) 21.920
D) 26.217
for a 98% confidence interval when n = 12?A) 27.688
B) 24.725
C) 21.920
D) 26.217
فتح الحزمة
افتح القفل للوصول البطاقات البالغ عددها 75 في هذه المجموعة.
فتح الحزمة
k this deck
69
Find the 95% confidence interval for the variance of the heights of maple trees if a sample of 11 trees has a standard deviation of 12.2 feet.
A) 11.2 < < 13.2
B) 8.5 < < 21.4
C) 137.8 < < 159.8
D) 72.7 < < 458.4
A) 11.2 <
< 13.2B) 8.5 <
< 21.4C) 137.8 <
< 159.8D) 72.7 <
< 458.4 فتح الحزمة
افتح القفل للوصول البطاقات البالغ عددها 75 في هذه المجموعة.
فتح الحزمة
k this deck
70
What is the 95% confidence interval for the standard deviation of birth weights at County General Hospital, if the standard deviation of the last 25 babies born there was 1.1 pounds?
A)
B)
C)
D)
A)
B)
C)
D)
فتح الحزمة
افتح القفل للوصول البطاقات البالغ عددها 75 في هذه المجموعة.
فتح الحزمة
k this deck
71
For a random sample of 23 European countries, the variance on life expectancy was 7.3 years. What is the 95% confidence interval for the variance of life expectancy in all of Europe?
A)
B)
C)
D)
A)
B)
C)
D)
فتح الحزمة
افتح القفل للوصول البطاقات البالغ عددها 75 في هذه المجموعة.
فتح الحزمة
k this deck
72
In order to find confidence intervals for variances and standard deviations, one must assume that the variable is _________________.
فتح الحزمة
افتح القفل للوصول البطاقات البالغ عددها 75 في هذه المجموعة.
فتح الحزمة
k this deck
73
The value for for a 95% confidence interval when n = 15 is 26.119.
for a 95% confidence interval when n = 15 is 26.119. فتح الحزمة
افتح القفل للوصول البطاقات البالغ عددها 75 في هذه المجموعة.
فتح الحزمة
k this deck
74
Find the values for and when = .05 and n = 27.
A) 13.844 and 41.923
B) 14.573 and 43.194
C) 15.379 and 38.885
D) 16.151 and 40.113
and when = .05 and n = 27.A) 13.844 and 41.923
B) 14.573 and 43.194
C) 15.379 and 38.885
D) 16.151 and 40.113
فتح الحزمة
افتح القفل للوصول البطاقات البالغ عددها 75 في هذه المجموعة.
فتح الحزمة
k this deck
75
What is the 90% confidence interval for the variance of exam scores for 28 algebra students, if the standard deviation of their last exam was 12.7?
A)
B)
C)
D)
A)
B)
C)
D)
فتح الحزمة
افتح القفل للوصول البطاقات البالغ عددها 75 في هذه المجموعة.
فتح الحزمة
k this deck
فتح الحزمة
افتح القفل للوصول البطاقات البالغ عددها 75 في هذه المجموعة.


