Deck 10: Correlation and Regression
ملء الشاشة (f)
سؤال
سؤال
A study was conducted to determine if there was a linear relationship between a person's age and his/her peak heart rate.
a. Draw the scatter plot for the variables.
b. Give a brief explanation of the type of relationship.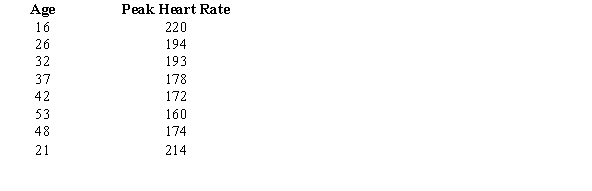
a. Draw the scatter plot for the variables.
b. Give a brief explanation of the type of relationship.
سؤال
سؤال
سؤال
Daniel Wiseman, a scientist for Gres-Trans Corp., wants to determine if the flow rate of a particular material changes with different changes in temperature. The data is plotted in the figure below. What type of relationship exists between the flow rate and the change in temperature? 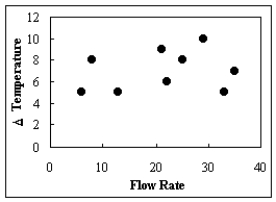
A) negative
B) positive
C) There is no relationship.
D) curvilinear
A) negative
B) positive
C) There is no relationship.
D) curvilinear
سؤال
Ten pairs of points yielded a correlation coefficient  of 0.790. If
  , which of the following statements is correct if
  ? (Do not calculate a t-value.)
A) Because 0.790 is greater than 0.632, the null hypothesis is not rejected.
B) Because 0.790 is greater than 0.632, the null hypothesis is rejected.
C) Because 0.790 is greater than 0.602, the null hypothesis is not rejected.
D) There is no correlation between the variables.
of 0.790. If , which of the following statements is correct if ? (Do not calculate a t-value.)A) Because 0.790 is greater than 0.632, the null hypothesis is not rejected.
B) Because 0.790 is greater than 0.632, the null hypothesis is rejected.
C) Because 0.790 is greater than 0.602, the null hypothesis is not rejected.
D) There is no correlation between the variables.
سؤال
سؤال
سؤال
Test the significance of the correlation coefficient r at  = 0.05 for the data below.
A) Accept because 8.03 < 3.18
B) Reject because 8.35 > 3.18
C) Accept because 8.35 < 2.78
D) Reject because 8.03 > 2.78
= 0.05 for the data below. A) Accept
because 8.03 < 3.18B) Reject
because 8.35 > 3.18C) Accept
because 8.35 < 2.78D) Reject
because 8.03 > 2.78 سؤال
The population correlation coefficient is computed by using all possible pairs of data values  taken from a population.
taken from a population. سؤال
سؤال
سؤال
سؤال
Determine the type of relationship shown in the figure below. 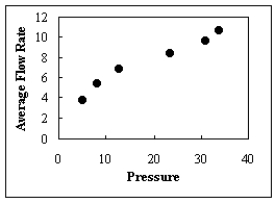
A) positive
B) negative
C) multiple
D) There is no relationship.
A) positive
B) negative
C) multiple
D) There is no relationship.
سؤال
سؤال
Compute the value of the correlation coefficient. 
A) 0.933
B) 0.953
C) 0.907
D) 0.798
A) 0.933
B) 0.953
C) 0.907
D) 0.798
سؤال
An experiment is carried out to determine the relationship between the average speed (rpm) and power (hp) of a mixer. Draw the scatter plot for the variables. 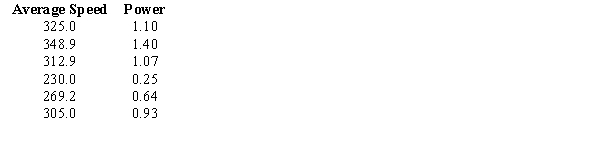
سؤال
Draw a scatter plot for the following data that show the demand for a product (in hundreds) and its price (in dollars) charged in nine different cities. 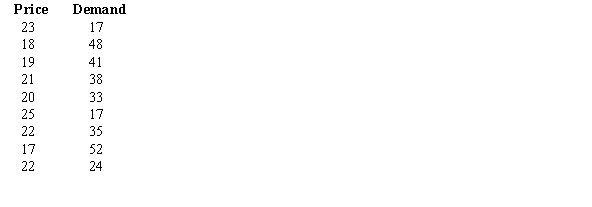
سؤال
A study was conducted to determine if there was a relationship between the prices a non-member of a book club paid for various publications and the prices that a member paid for the same publications. The data gathered is shown below. Compute the value of the correlation coefficient. 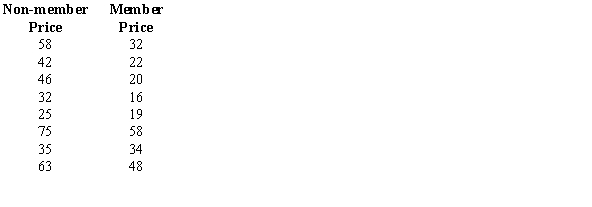
A) 0.762
B) 0.857
C) 0.679
D) 0.932
A) 0.762
B) 0.857
C) 0.679
D) 0.932
سؤال
سؤال
The equation of a regression line is 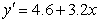 . What is the intercept of this line?
A) -4.6
B) 3.2
C) 4.6
D) 0
. What is the intercept of this line?A) -4.6
B) 3.2
C) 4.6
D) 0
سؤال
Using a regression line of 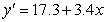 , a value of x = 3.6 would result in a predicted value of
  .
.
, a value of x = 3.6 would result in a predicted value of . سؤال
A psychologist wants to determine if there is a linear relationship between the number of hours a person goes without sleep and the number of mistakes he/she makes on a simple test. The following data is recorded.
a. Draw a scatter plot.
b. Determine the regression line equation and plot the regression line
on the scatter plot.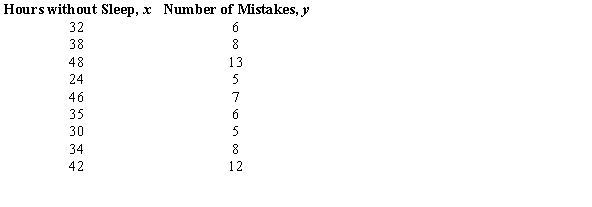
a. Draw a scatter plot.
b. Determine the regression line equation and plot the regression line
on the scatter plot.
سؤال
سؤال
A regression line was calculated as 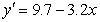 . The slope of this line is -3.2.
. The slope of this line is -3.2. سؤال
سؤال
سؤال
سؤال
سؤال
سؤال
سؤال
سؤال
سؤال
سؤال
Find the equation of the regression line. 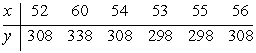
سؤال
سؤال
سؤال
What is the value of  when x = 3, if the equation of the regression line is
 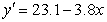 ?
?
A) 4.73
B) 5.29
C) 34.5
D) 11.7
when x = 3, if the equation of the regression line is ?A) 4.73
B) 5.29
C) 34.5
D) 11.7
سؤال
سؤال
A realtor wanted to determine if there was a relationship between the size (in 100 square feet) of a new custom-built home and the price (in thousands of dollars) of the home.
a. Draw a scatter plot.
b. Determine the regression line equation and plot the regression line
on the scatter plot.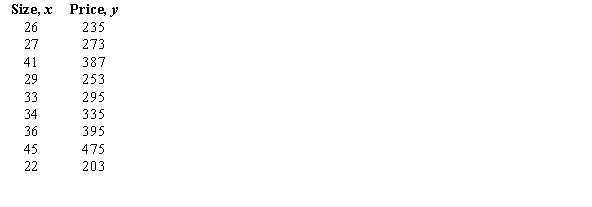
a. Draw a scatter plot.
b. Determine the regression line equation and plot the regression line
on the scatter plot.
سؤال
سؤال
سؤال
The standard error of the estimate is the standard deviation of the observed x-values about the predicted  values.
values. سؤال
سؤال
Two researchers run identical experiments except researcher A collects twice as many points as researcher B. For a specific value x, researcher A estimates a y value of  and researcher B estimates a y value of
  . We would expect that researcher A's 95% prediction interval around
  to be, in general,
A) wider than researcher B's 95% prediction interval around .
.
B) narrower than researcher B's 95% prediction interval around .
.
C) the same as researcher B's 95% prediction interval around .
.
D) wider than researcher B's 95% prediction interval around or narrower than researcher B's 95% prediction interval around
  , with equal probability.
and researcher B estimates a y value of . We would expect that researcher A's 95% prediction interval around to be, in general,A) wider than researcher B's 95% prediction interval around
.B) narrower than researcher B's 95% prediction interval around
.C) the same as researcher B's 95% prediction interval around
.D) wider than researcher B's 95% prediction interval around
or narrower than researcher B's 95% prediction interval around , with equal probability. سؤال
سؤال
سؤال
سؤال
سؤال
Compute the standard error of the estimate for the data below. 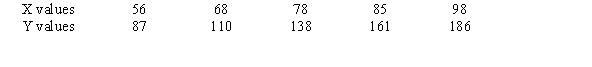
A) 1.54
B) 2.38
C) 3.46
D) 4.17
A) 1.54
B) 2.38
C) 3.46
D) 4.17
سؤال
سؤال
The following data list ages of cars (in years) and monthly repair cost in dollars. What is the standard error of the estimate? 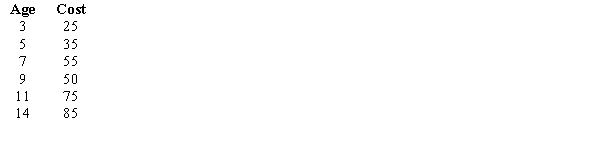
A) 6.36
B) 7.34
C) 8.75
D) 5.49
A) 6.36
B) 7.34
C) 8.75
D) 5.49
سؤال
The standard error of estimate can be used for constructing a(n) __________ interval about a  value.
value. سؤال
سؤال
سؤال
The total blood cholesterol concentrations, in mg/dL, are shown below for a random sample of six people. In the table below, x is the age of the subject and y is the subject's total cholesterol concentration. Find the 95% prediction interval when x = 59 years. 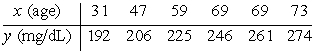
سؤال
Compute the standard error of the estimate for the data below. Round to the thousandths place. 
A) 0.932
B) 1.404
C) 0.880
D) 0.444
A) 0.932
B) 1.404
C) 0.880
D) 0.444
سؤال
سؤال
سؤال
سؤال
A multiple regression line was calculated in which x1 was a student's grade point average and x2 was a student's age. The multiple regression line was calculated as 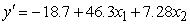 . If a student has a grade point average of 5.9 and is 20 years old, what is the predicted value of
  ?
?
A) 387.2
B) 400.1
C) 421.6
D) 615.5
. If a student has a grade point average of 5.9 and is 20 years old, what is the predicted value of ?A) 387.2
B) 400.1
C) 421.6
D) 615.5
سؤال
سؤال

فتح الحزمة
قم بالتسجيل لفتح البطاقات في هذه المجموعة!
Unlock Deck
Unlock Deck
1/63
العب
ملء الشاشة (f)
Deck 10: Correlation and Regression
1
The two variables in a scatter plot are called the
A) independent variable and dependent variable.
B) relative frequency and relative proportion.
C) spread and pattern.
D) lines and points.
A) independent variable and dependent variable.
B) relative frequency and relative proportion.
C) spread and pattern.
D) lines and points.
A
2
A study was conducted to determine if there was a linear relationship between a person's age and his/her peak heart rate.
a. Draw the scatter plot for the variables.
b. Give a brief explanation of the type of relationship.
a. Draw the scatter plot for the variables.
b. Give a brief explanation of the type of relationship.
a. 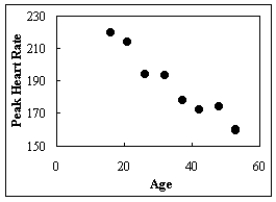 b. There appears to be a negative relationship between age and peak heart rate.
b. There appears to be a negative relationship between age and peak heart rate. 3
The range of the correlation coefficient is from 0 to 1.
False
4
Which of the following does not explain a possible relationship between variables when the null hypothesis is rejected?
A) direct cause-and-effect
B) uncorrelated
C) caused by a third variable
D) negative effect
A) direct cause-and-effect
B) uncorrelated
C) caused by a third variable
D) negative effect
فتح الحزمة
افتح القفل للوصول البطاقات البالغ عددها 63 في هذه المجموعة.
فتح الحزمة
k this deck
5
Daniel Wiseman, a scientist for Gres-Trans Corp., wants to determine if the flow rate of a particular material changes with different changes in temperature. The data is plotted in the figure below. What type of relationship exists between the flow rate and the change in temperature?
A) negative
B) positive
C) There is no relationship.
D) curvilinear
A) negative
B) positive
C) There is no relationship.
D) curvilinear
فتح الحزمة
افتح القفل للوصول البطاقات البالغ عددها 63 في هذه المجموعة.
فتح الحزمة
k this deck
6
Ten pairs of points yielded a correlation coefficient of 0.790. If , which of the following statements is correct if ? (Do not calculate a t-value.)
A) Because 0.790 is greater than 0.632, the null hypothesis is not rejected.
B) Because 0.790 is greater than 0.632, the null hypothesis is rejected.
C) Because 0.790 is greater than 0.602, the null hypothesis is not rejected.
D) There is no correlation between the variables.
of 0.790. If , which of the following statements is correct if ? (Do not calculate a t-value.)A) Because 0.790 is greater than 0.632, the null hypothesis is not rejected.
B) Because 0.790 is greater than 0.632, the null hypothesis is rejected.
C) Because 0.790 is greater than 0.602, the null hypothesis is not rejected.
D) There is no correlation between the variables.
فتح الحزمة
افتح القفل للوصول البطاقات البالغ عددها 63 في هذه المجموعة.
فتح الحزمة
k this deck
7
A positive relationship exists when both variables increase or decrease at the same time.
فتح الحزمة
افتح القفل للوصول البطاقات البالغ عددها 63 في هذه المجموعة.
فتح الحزمة
k this deck
8
A formula for the correlation coefficient r is __________.
فتح الحزمة
افتح القفل للوصول البطاقات البالغ عددها 63 في هذه المجموعة.
فتح الحزمة
k this deck
9
Test the significance of the correlation coefficient r at = 0.05 for the data below.
A) Accept because 8.03 < 3.18
B) Reject because 8.35 > 3.18
C) Accept because 8.35 < 2.78
D) Reject because 8.03 > 2.78
= 0.05 for the data below. A) Accept
because 8.03 < 3.18B) Reject
because 8.35 > 3.18C) Accept
because 8.35 < 2.78D) Reject
because 8.03 > 2.78 فتح الحزمة
افتح القفل للوصول البطاقات البالغ عددها 63 في هذه المجموعة.
فتح الحزمة
k this deck
10
The population correlation coefficient is computed by using all possible pairs of data values taken from a population.
taken from a population. فتح الحزمة
افتح القفل للوصول البطاقات البالغ عددها 63 في هذه المجموعة.
فتح الحزمة
k this deck
11
If there is a strong negative linear relationship between the variables, the value of __________ will be close to -1.
فتح الحزمة
افتح القفل للوصول البطاقات البالغ عددها 63 في هذه المجموعة.
فتح الحزمة
k this deck
12
__________ is a statistical method used to determine whether a relationship between variables exists.
فتح الحزمة
افتح القفل للوصول البطاقات البالغ عددها 63 في هذه المجموعة.
فتح الحزمة
k this deck
13
The rounding rule for the correlation coefficient requires two decimal places.
فتح الحزمة
افتح القفل للوصول البطاقات البالغ عددها 63 في هذه المجموعة.
فتح الحزمة
k this deck
14
Determine the type of relationship shown in the figure below.
A) positive
B) negative
C) multiple
D) There is no relationship.
A) positive
B) negative
C) multiple
D) There is no relationship.
فتح الحزمة
افتح القفل للوصول البطاقات البالغ عددها 63 في هذه المجموعة.
فتح الحزمة
k this deck
15
In a __________ relationship, as one variable increases, the other variable decreases, and vice versa.
فتح الحزمة
افتح القفل للوصول البطاقات البالغ عددها 63 في هذه المجموعة.
فتح الحزمة
k this deck
16
Compute the value of the correlation coefficient.
A) 0.933
B) 0.953
C) 0.907
D) 0.798
A) 0.933
B) 0.953
C) 0.907
D) 0.798
فتح الحزمة
افتح القفل للوصول البطاقات البالغ عددها 63 في هذه المجموعة.
فتح الحزمة
k this deck
17
An experiment is carried out to determine the relationship between the average speed (rpm) and power (hp) of a mixer. Draw the scatter plot for the variables.
فتح الحزمة
افتح القفل للوصول البطاقات البالغ عددها 63 في هذه المجموعة.
فتح الحزمة
k this deck
18
Draw a scatter plot for the following data that show the demand for a product (in hundreds) and its price (in dollars) charged in nine different cities.
فتح الحزمة
افتح القفل للوصول البطاقات البالغ عددها 63 في هذه المجموعة.
فتح الحزمة
k this deck
19
A study was conducted to determine if there was a relationship between the prices a non-member of a book club paid for various publications and the prices that a member paid for the same publications. The data gathered is shown below. Compute the value of the correlation coefficient.
A) 0.762
B) 0.857
C) 0.679
D) 0.932
A) 0.762
B) 0.857
C) 0.679
D) 0.932
فتح الحزمة
افتح القفل للوصول البطاقات البالغ عددها 63 في هذه المجموعة.
فتح الحزمة
k this deck
20
A correlation coefficient of 0.961 would mean that the values of x increase as the values of y decrease.
فتح الحزمة
افتح القفل للوصول البطاقات البالغ عددها 63 في هذه المجموعة.
فتح الحزمة
k this deck
21
The equation of a regression line is . What is the intercept of this line?
A) -4.6
B) 3.2
C) 4.6
D) 0
. What is the intercept of this line?A) -4.6
B) 3.2
C) 4.6
D) 0
فتح الحزمة
افتح القفل للوصول البطاقات البالغ عددها 63 في هذه المجموعة.
فتح الحزمة
k this deck
22
Using a regression line of , a value of x = 3.6 would result in a predicted value of .
, a value of x = 3.6 would result in a predicted value of . فتح الحزمة
افتح القفل للوصول البطاقات البالغ عددها 63 في هذه المجموعة.
فتح الحزمة
k this deck
23
A psychologist wants to determine if there is a linear relationship between the number of hours a person goes without sleep and the number of mistakes he/she makes on a simple test. The following data is recorded.
a. Draw a scatter plot.
b. Determine the regression line equation and plot the regression line
on the scatter plot.
a. Draw a scatter plot.
b. Determine the regression line equation and plot the regression line
on the scatter plot.
فتح الحزمة
افتح القفل للوصول البطاقات البالغ عددها 63 في هذه المجموعة.
فتح الحزمة
k this deck
24
A correlation coefficient r was calculated to be 0.830. The coefficient of nondetermination would be 0.170.
فتح الحزمة
افتح القفل للوصول البطاقات البالغ عددها 63 في هذه المجموعة.
فتح الحزمة
k this deck
25
A regression line was calculated as . The slope of this line is -3.2.
. The slope of this line is -3.2. فتح الحزمة
افتح القفل للوصول البطاقات البالغ عددها 63 في هذه المجموعة.
فتح الحزمة
k this deck
26
If the correlation coefficient is 0.790, what is the explained variation?
A) 37.6%
B) 62.4%
C) 79%
D) 21%
A) 37.6%
B) 62.4%
C) 79%
D) 21%
فتح الحزمة
افتح القفل للوصول البطاقات البالغ عددها 63 في هذه المجموعة.
فتح الحزمة
k this deck
27
If the equation for the regression line is y' = 7x - 9, then a value of x = 2 will result in a predicted value for y of
A) 16
B) 25
C) 23
D) 5
A) 16
B) 25
C) 23
D) 5
فتح الحزمة
افتح القفل للوصول البطاقات البالغ عددها 63 في هذه المجموعة.
فتح الحزمة
k this deck
28
The formula for the coefficient of nondetermination is 1.00 - r2 .
فتح الحزمة
افتح القفل للوصول البطاقات البالغ عددها 63 في هذه المجموعة.
فتح الحزمة
k this deck
29
If the equation for the regression line is y' = -4x + 3, then the slope of this line is
A) 6
B) 3
C) -1
D) -4
A) 6
B) 3
C) -1
D) -4
فتح الحزمة
افتح القفل للوصول البطاقات البالغ عددها 63 في هذه المجموعة.
فتح الحزمة
k this deck
30
The variation due to chance, found by the formula __________, is called the unexplained variation.
فتح الحزمة
افتح القفل للوصول البطاقات البالغ عددها 63 في هذه المجموعة.
فتح الحزمة
k this deck
31
A regression line can be used to show trends in data.
فتح الحزمة
افتح القفل للوصول البطاقات البالغ عددها 63 في هذه المجموعة.
فتح الحزمة
k this deck
32
If the equation for the regression line is y' = 8x + 4, then a value of x = -3 will result in a predicted value for y of
A) 4
B) -4
C) -20
D) 8
A) 4
B) -4
C) -20
D) 8
فتح الحزمة
افتح القفل للوصول البطاقات البالغ عددها 63 في هذه المجموعة.
فتح الحزمة
k this deck
33
If the correlation coefficient is 0.930, what is the unexplained variation?
A) 7%
B) 93%
C) 13.5%
D) 86.5%
A) 7%
B) 93%
C) 13.5%
D) 86.5%
فتح الحزمة
افتح القفل للوصول البطاقات البالغ عددها 63 في هذه المجموعة.
فتح الحزمة
k this deck
34
When r is not significantly different from 0, the best predictor of y is the ____________ of the data values of y.
فتح الحزمة
افتح القفل للوصول البطاقات البالغ عددها 63 في هذه المجموعة.
فتح الحزمة
k this deck
35
Find the equation of the regression line.
فتح الحزمة
افتح القفل للوصول البطاقات البالغ عددها 63 في هذه المجموعة.
فتح الحزمة
k this deck
36
A correlation coefficient r was calculated to be 0.610. The coefficient of determination would be approximately __________.
فتح الحزمة
افتح القفل للوصول البطاقات البالغ عددها 63 في هذه المجموعة.
فتح الحزمة
k this deck
37
If the equation for the regression line is y' = -8x + 3, then the intercept of this line is
A) 6
B) 3
C) -5
D) -8
A) 6
B) 3
C) -5
D) -8
فتح الحزمة
افتح القفل للوصول البطاقات البالغ عددها 63 في هذه المجموعة.
فتح الحزمة
k this deck
38
What is the value of when x = 3, if the equation of the regression line is ?
A) 4.73
B) 5.29
C) 34.5
D) 11.7
when x = 3, if the equation of the regression line is ?A) 4.73
B) 5.29
C) 34.5
D) 11.7
فتح الحزمة
افتح القفل للوصول البطاقات البالغ عددها 63 في هذه المجموعة.
فتح الحزمة
k this deck
39
Regression is a statistical method used to describe the nature of the relationship between variables.
فتح الحزمة
افتح القفل للوصول البطاقات البالغ عددها 63 في هذه المجموعة.
فتح الحزمة
k this deck
40
A realtor wanted to determine if there was a relationship between the size (in 100 square feet) of a new custom-built home and the price (in thousands of dollars) of the home.
a. Draw a scatter plot.
b. Determine the regression line equation and plot the regression line
on the scatter plot.
a. Draw a scatter plot.
b. Determine the regression line equation and plot the regression line
on the scatter plot.
فتح الحزمة
افتح القفل للوصول البطاقات البالغ عددها 63 في هذه المجموعة.
فتح الحزمة
k this deck
41
A researcher has reason to believe that, for an experiment with 40 points, a 95% prediction interval would be of width 8. If the researcher wishes to run a more precise experiment that will result in a 95% prediction interval of width 4, then the researcher will require how many points?
فتح الحزمة
افتح القفل للوصول البطاقات البالغ عددها 63 في هذه المجموعة.
فتح الحزمة
k this deck
42
For a prediction value of y' from a specific value x, which of the following contribute to the prediction error?
A) The error in estimating the slope
B) The error in estimating the intercept
C) The standard error of the estimate
D) All of the above
A) The error in estimating the slope
B) The error in estimating the intercept
C) The standard error of the estimate
D) All of the above
فتح الحزمة
افتح القفل للوصول البطاقات البالغ عددها 63 في هذه المجموعة.
فتح الحزمة
k this deck
43
The standard error of the estimate is the standard deviation of the observed x-values about the predicted values.
values. فتح الحزمة
افتح القفل للوصول البطاقات البالغ عددها 63 في هذه المجموعة.
فتح الحزمة
k this deck
44
With enough variables, it is possible to get an R2 value close to 1, even if the variables have no particular meaning in the model.
فتح الحزمة
افتح القفل للوصول البطاقات البالغ عددها 63 في هذه المجموعة.
فتح الحزمة
k this deck
45
Two researchers run identical experiments except researcher A collects twice as many points as researcher B. For a specific value x, researcher A estimates a y value of and researcher B estimates a y value of . We would expect that researcher A's 95% prediction interval around to be, in general,
A) wider than researcher B's 95% prediction interval around .
B) narrower than researcher B's 95% prediction interval around .
C) the same as researcher B's 95% prediction interval around .
D) wider than researcher B's 95% prediction interval around or narrower than researcher B's 95% prediction interval around , with equal probability.
and researcher B estimates a y value of . We would expect that researcher A's 95% prediction interval around to be, in general,A) wider than researcher B's 95% prediction interval around
.B) narrower than researcher B's 95% prediction interval around
.C) the same as researcher B's 95% prediction interval around
.D) wider than researcher B's 95% prediction interval around
or narrower than researcher B's 95% prediction interval around , with equal probability. فتح الحزمة
افتح القفل للوصول البطاقات البالغ عددها 63 في هذه المجموعة.
فتح الحزمة
k this deck
46
An analysis results in a multiple regression equation of y' = 73 + 24x1+ 7x2. We can conclude that
A) The variable x1 is a very significant factor in this model.
B) The variable x1 is a moderately significant factor in this model.
C) The variable x1 is not a significant factor in this model.
D) This is insufficient information to assess the significance of x1.
A) The variable x1 is a very significant factor in this model.
B) The variable x1 is a moderately significant factor in this model.
C) The variable x1 is not a significant factor in this model.
D) This is insufficient information to assess the significance of x1.
فتح الحزمة
افتح القفل للوصول البطاقات البالغ عددها 63 في هذه المجموعة.
فتح الحزمة
k this deck
47
As a researcher collects more and more data, the 95% prediction intervals in general
A) become narrower and narrower, with the widths getting closer and closer to 0.
B) become narrower and narrower, but the widths are always more than approximately 2 times the standard error of the estimate.
C) become narrower and narrower, but the widths are always more than approximately 4 times the standard error of the estimate.
D) become narrower and narrower, but the widths are always more than approximately 4 times the slope.
فتح الحزمة
افتح القفل للوصول البطاقات البالغ عددها 63 في هذه المجموعة.
فتح الحزمة
k this deck
48
The symbol used for the multiple correlation coefficient is R .
فتح الحزمة
افتح القفل للوصول البطاقات البالغ عددها 63 في هذه المجموعة.
فتح الحزمة
k this deck
49
If the correlation coefficient r is equal to 0.755, find the coefficient of determination and the coefficient of nondetermination.
A) The coefficient of determination is 0.430 and the coefficient of nondetermination is 0.570
B) The coefficient of determination is 0.869 and the coefficient of nondetermination is 0.131
C) The coefficient of determination is 0.570 and the coefficient of nondetermination is 0.430
D) The coefficient of determination is 0.131 and the coefficient of nondetermination is 0.869
فتح الحزمة
افتح القفل للوصول البطاقات البالغ عددها 63 في هذه المجموعة.
فتح الحزمة
k this deck
50
Compute the standard error of the estimate for the data below.
A) 1.54
B) 2.38
C) 3.46
D) 4.17
A) 1.54
B) 2.38
C) 3.46
D) 4.17
فتح الحزمة
افتح القفل للوصول البطاقات البالغ عددها 63 في هذه المجموعة.
فتح الحزمة
k this deck
51
If the correlation coefficient r is equal to 0.394, find the coefficient of nondetermination.
A) 0.845
B) 0.628
C) 0.275
D) 0.155
A) 0.845
B) 0.628
C) 0.275
D) 0.155
فتح الحزمة
افتح القفل للوصول البطاقات البالغ عددها 63 في هذه المجموعة.
فتح الحزمة
k this deck
52
The following data list ages of cars (in years) and monthly repair cost in dollars. What is the standard error of the estimate?
A) 6.36
B) 7.34
C) 8.75
D) 5.49
A) 6.36
B) 7.34
C) 8.75
D) 5.49
فتح الحزمة
افتح القفل للوصول البطاقات البالغ عددها 63 في هذه المجموعة.
فتح الحزمة
k this deck
53
The standard error of estimate can be used for constructing a(n) __________ interval about a value.
value. فتح الحزمة
افتح القفل للوصول البطاقات البالغ عددها 63 في هذه المجموعة.
فتح الحزمة
k this deck
54
In a multiple regression model y' = -11 + 5x1 + 21x2 + 11x3 + 3x4, if the x1 value changes by 2, then the predicted value for y will change by
A) 10
B) 42
C) -1
D) 29
A) 10
B) 42
C) -1
D) 29
فتح الحزمة
افتح القفل للوصول البطاقات البالغ عددها 63 في هذه المجموعة.
فتح الحزمة
k this deck
55
The prediction interval around y' for a specific x is
A) a confidence interval for the true mean value of the y values that correspond to that x.
B) the value of y used to calculate the slope of the regression line.
C) the interval of values of x used to predict y'.
D) the difference between the value of y and the value of x.
A) a confidence interval for the true mean value of the y values that correspond to that x.
B) the value of y used to calculate the slope of the regression line.
C) the interval of values of x used to predict y'.
D) the difference between the value of y and the value of x.
فتح الحزمة
افتح القفل للوصول البطاقات البالغ عددها 63 في هذه المجموعة.
فتح الحزمة
k this deck
56
The total blood cholesterol concentrations, in mg/dL, are shown below for a random sample of six people. In the table below, x is the age of the subject and y is the subject's total cholesterol concentration. Find the 95% prediction interval when x = 59 years.
فتح الحزمة
افتح القفل للوصول البطاقات البالغ عددها 63 في هذه المجموعة.
فتح الحزمة
k this deck
57
Compute the standard error of the estimate for the data below. Round to the thousandths place.
A) 0.932
B) 1.404
C) 0.880
D) 0.444
A) 0.932
B) 1.404
C) 0.880
D) 0.444
فتح الحزمة
افتح القفل للوصول البطاقات البالغ عددها 63 في هذه المجموعة.
فتح الحزمة
k this deck
58
The standard error of estimate is the square root of the unexplained variation.
فتح الحزمة
افتح القفل للوصول البطاقات البالغ عددها 63 في هذه المجموعة.
فتح الحزمة
k this deck
59
If the correlation coefficient r is equal to 0.552, find the coefficient of nondetermination.
A) 0.695
B) 0.740
C) 0.429
D) 0.305
A) 0.695
B) 0.740
C) 0.429
D) 0.305
فتح الحزمة
افتح القفل للوصول البطاقات البالغ عددها 63 في هذه المجموعة.
فتح الحزمة
k this deck
60
If the correlation coefficient r is equal to 0.465, find the coefficient of determination.
A) 0.784
B) 0.682
C) 0.341
D) 0.216
A) 0.784
B) 0.682
C) 0.341
D) 0.216
فتح الحزمة
افتح القفل للوصول البطاقات البالغ عددها 63 في هذه المجموعة.
فتح الحزمة
k this deck
61
A multiple regression line was calculated in which x1 was a student's grade point average and x2 was a student's age. The multiple regression line was calculated as . If a student has a grade point average of 5.9 and is 20 years old, what is the predicted value of ?
A) 387.2
B) 400.1
C) 421.6
D) 615.5
. If a student has a grade point average of 5.9 and is 20 years old, what is the predicted value of ?A) 387.2
B) 400.1
C) 421.6
D) 615.5
فتح الحزمة
افتح القفل للوصول البطاقات البالغ عددها 63 في هذه المجموعة.
فتح الحزمة
k this deck
62
In a multiple regression model y' = -11 + 4x1 + 11x2 + 7x3 + 3x4, if the value of x2 increases by 2 and the value of x3 decreases by 5, then the predicted value for y will
A) decrease by 57.
B) increase by 57.
C) decrease by 13.
D) increase by 13.
A) decrease by 57.
B) increase by 57.
C) decrease by 13.
D) increase by 13.
فتح الحزمة
افتح القفل للوصول البطاقات البالغ عددها 63 في هذه المجموعة.
فتح الحزمة
k this deck
63
If there are three independent variables x1, x2, and x3 available, then the value of R2 for a multiple regression of y using x1, x2, and x3 will always be smaller than the value of r2 for a multiple regression of y using just x1.
فتح الحزمة
افتح القفل للوصول البطاقات البالغ عددها 63 في هذه المجموعة.
فتح الحزمة
k this deck
فتح الحزمة
افتح القفل للوصول البطاقات البالغ عددها 63 في هذه المجموعة.


