Deck 1: Ingredients of Change: Functions an Limits
ملء الشاشة (f)
سؤال
For the function, write the equations for any horizontal asymptote(s). 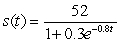
A) and
and 
B) and
and 
C)
D)
E) no horizontal asymptotes
A)
and B)
and C)
D)
E) no horizontal asymptotes
سؤال
Complete the table and use it to predict the limit, if it exists. 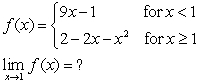
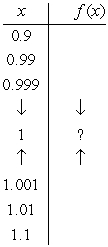
A)
B)
C)
D)
E) does not exist
A)
B)
C)
D)
E) does not exist
سؤال
Numerically estimate the limits. Show the numerical estimation table.  start
start  , increment
  estimate to the nearest integer.
A)
B)
C)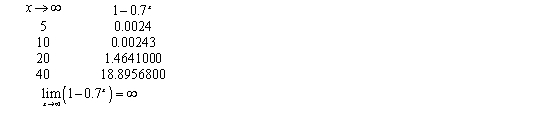
D)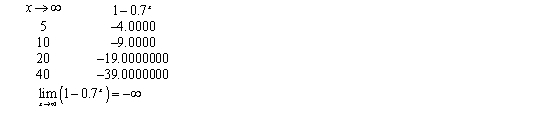
E)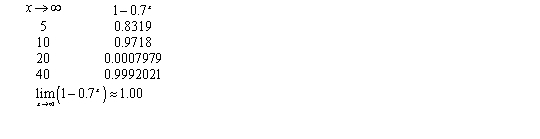
start , increment estimate to the nearest integer.A)
B)
C)
D)
E)
سؤال
Write a linear model for the given rate of change and initial output value. The cost to produce plastic toys increases by 10 cents per toy produced. The fixed cost is 90 dollars.
A)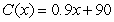
B)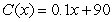
C)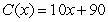
D)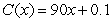
E)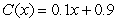
A)
B)
C)
D)
E)
سؤال
Calculate the output value that corresponds to the given input values of the function. 
A)
B)
C)
D)
E)
A)
B)
C)
D)
E)
سؤال
Find the input of the function 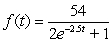 corresponding to the output
  to three decimal places.
A)
B)
C)
D)
E)
corresponding to the output to three decimal places.A)
B)
C)
D)
E)
سؤال
Use properties of limits and algebraic methods to find the limit, if it exists. 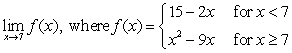
A) -1
B) 14
C) -14
D) 1
E) does not exist
A) -1
B) 14
C) -14
D) 1
E) does not exist
سؤال
Given 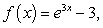 evaluate
  Round to the nearest ten-thousandth.
A) 426.75
B) 400.429
C) 406.429
D) 2.9975
evaluate Round to the nearest ten-thousandth.A) 426.75
B) 400.429
C) 406.429
D)
2.9975 سؤال
Use properties of limits and algebraic methods to find the limit, if it exists. 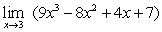
A)
B)
C)
D)
E) does not exist
A)
B)
C)
D)
E) does not exist
سؤال
Evaluate the function at the given values of the independent variables. 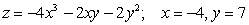
A)
B)
C)
D)
E)
A)
B)
C)
D)
E)
سؤال
Use properties of limits and algebraic methods to find the limit, if it exists. 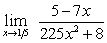
A)
B)
C)
D)
E) does not exist
A)
B)
C)
D)
E) does not exist
سؤال
Calculate the average rate of change in the population (in people per month) between April, 1999, and July, 2001. 
A) -3548 people per month
B) -3992 people per month
C) -19,160 people per month
D) -2903 people per month
E) -8709 people per month
A) -3548 people per month
B) -3992 people per month
C) -19,160 people per month
D) -2903 people per month
E) -8709 people per month
سؤال
For the given function write limit notation for the end behavior. 
A)

B)

C)
D)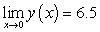

E)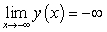

A)
B)
C)
D)
E)
سؤال
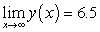
The percentage of mothers in a large city who gave birth to a child in 2005 and returned to the workforce within x months of having the child is modeled as 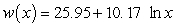 percent What percentage of mothers returned to the workforce within the first year after giving birth?
Round to the nearest thousandth.
A) 51.222%
B) 28.435%
C) 36.925%
D) 38.980%
E) 25.272%
percent What percentage of mothers returned to the workforce within the first year after giving birth?Round to the nearest thousandth.
A) 51.222%
B) 28.435%
C) 36.925%
D) 38.980%
E) 25.272%
سؤال
Use properties of limits and algebraic methods to find the limit, if it exists. 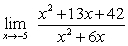
A)
B)
C)
D)
E) does not exist
A)
B)
C)
D)
E) does not exist
سؤال
How much money would you have to invest today at 6% APR compounded monthly to accumulate the sum of $270,000 in 37 years? Round to the nearest hundredth.
A)
B)
C)
D)
E)
A)
B)
C)
D)
E)
سؤال
Find the input of the function  corresponding to the output
  .
.
A)
B)
C)
D)
E)
corresponding to the output .A)
B)
C)
D)
E)
سؤال
Use properties of limits and algebraic methods to find the limit, if it exists. 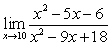
A)
B)
C)
D)
E) does not exist
A)
B)
C)
D)
E) does not exist
سؤال
Calculate the constant percentage change for the given function. 
A) 15%
B) 0.15%
C) 72%
D) 82.8%
E) 10.8%
A) 15%
B) 0.15%
C) 72%
D) 82.8%
E) 10.8%
سؤال
Use the formula 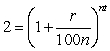 to find the doubling time t, in years, for an investment at r% compounded n times per year. Suppose you make an investment of $1300 at interest rate 12% compounded quarterly. How long will it take for your investment to double?
A) 3.06 years
B) 1.95 years
C) 11.72 years
D) 0.76 years
E) 5.86 years
to find the doubling time t, in years, for an investment at r% compounded n times per year. Suppose you make an investment of $1300 at interest rate 12% compounded quarterly. How long will it take for your investment to double?A) 3.06 years
B) 1.95 years
C) 11.72 years
D) 0.76 years
E) 5.86 years
سؤال
In 1996, the population of a country was estimated at 4 million. For any subsequent year the population  in millions is
 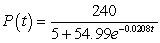 where t is the number of years since 1996. Use a graphing calculator to estimate the population in 2005.
A) 4,743,000
B) 4,699,000
C) 4,655,000
D) 4,833,000
in millions is where t is the number of years since 1996. Use a graphing calculator to estimate the population in 2005.A) 4,743,000
B) 4,699,000
C) 4,655,000
D) 4,833,000
سؤال
Rewrite the following pair of functions as one composite function.  ;
; 
A)
B)
C)
D)
E)
; A)
B)
C)
D)
E)
سؤال
Indicate whether the function is an increasing or decreasing logistic function and identify the upper limiting value of the function 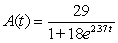 .
.
A) The function is decreasing and the upper limit is 29.00.
B) The function is decreasing and the upper limit is 2.37.
C) The function is decreasing and the upper limit is -2.37.
D) The function is increasing and the upper limit is 0.00.
E) The function is increasing and the upper limit is 29.00.
.A) The function is decreasing and the upper limit is 29.00.
B) The function is decreasing and the upper limit is 2.37.
C) The function is decreasing and the upper limit is -2.37.
D) The function is increasing and the upper limit is 0.00.
E) The function is increasing and the upper limit is 29.00.
سؤال
The total cost for producing  units of a commodity is $4.8 million, and the revenue generated by the sale of
  units is $7.4 million. What is the profit on
  units of the commodity?
A) $12.2 million
B) $1.5 million
C) $2.6 million
D) $4.8 million
E) $7.4 million
units of a commodity is $4.8 million, and the revenue generated by the sale of units is $7.4 million. What is the profit on units of the commodity?A) $12.2 million
B) $1.5 million
C) $2.6 million
D) $4.8 million
E) $7.4 million
سؤال
سؤال
The table gives the percent of the population of a certain city that was foreign born in the given year. Find a cubic function that best fits the data where x is the number of years after 1900 and y is equal to the percent. By trial and error, estimate the year the model predicts that the foreign-born population will be 100%. 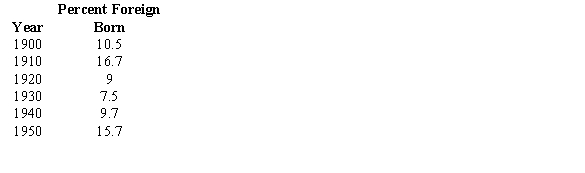
A) foreign born population will be 100% in 1965.
B) foreign born population will be 100% in 1975.
C) foreign born population will be 100% in 1975.
D) foreign born population will be 100% in 1965.
E) foreign born population will be 100% in 1985.
A)
foreign born population will be 100% in 1965.B)
foreign born population will be 100% in 1975.C)
foreign born population will be 100% in 1975.D)
foreign born population will be 100% in 1965.E)
foreign born population will be 100% in 1985. سؤال
Indicate whether the function is an increasing or decreasing logistic function and identify the upper limiting value of the function 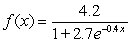 .
.
A) The function is decreasing and the upper limit is 2.7.
B) The function is decreasing and the upper limit is -0.4.
C) The function is decreasing and the upper limit is 0.4.
D) The function is increasing and the upper limit is 4.2.
E) The function is increasing and the upper limit is 0.0.
.A) The function is decreasing and the upper limit is 2.7.
B) The function is decreasing and the upper limit is -0.4.
C) The function is decreasing and the upper limit is 0.4.
D) The function is increasing and the upper limit is 4.2.
E) The function is increasing and the upper limit is 0.0.
سؤال
Choose the function type for the mathematical model that best represents the given data set. 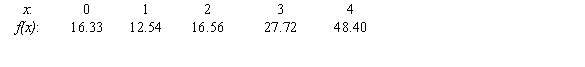
A) logistic
B) quadratic
C) linear
D) exponential
E) logarithmic
A) logistic
B) quadratic
C) linear
D) exponential
E) logarithmic
سؤال
سؤال
سؤال
The following table gives the percent of the U.S. population with Internet connections for the years 1997 to 2003. Use a calculator to find the logistic function that models these data. Use x as the number of years past 1995.  Source: U.S. Department of Commerce
A)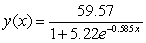
B)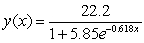
C)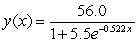
D)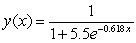
E)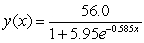
Source: U.S. Department of CommerceA)
B)
C)
D)
E)
سؤال
Indicate whether the function is an increasing or decreasing logistic function and identify the upper limiting value of the function 
A) The function is increasing and the upper limit is 18.00.
B) The function is decreasing and the upper limit is 18.00.
C) The function is increasing and the upper limit is 68.00.
D) The function is decreasing and the upper limit is 68.00.
E) The function is decreasing and the upper limit is 0.00.
A) The function is increasing and the upper limit is 18.00.
B) The function is decreasing and the upper limit is 18.00.
C) The function is increasing and the upper limit is 68.00.
D) The function is decreasing and the upper limit is 68.00.
E) The function is decreasing and the upper limit is 0.00.
سؤال
To offset college expenses, at the beginning of your freshman year you obtain a nonsubsidized student loan for $18,000. Interest on this loan accrues at a rate of 3.15% compounded monthly. However, you do not have to make any payments against either the principal or the interest until after you graduate. Write a model giving the total amount you will owe on this loan after t years in college.
A)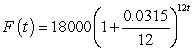
B)
C)
D)
E)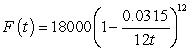
A)
B)
C)
D)
E)
سؤال
Find the equation of the quadratic function that is the best fit for the given data. 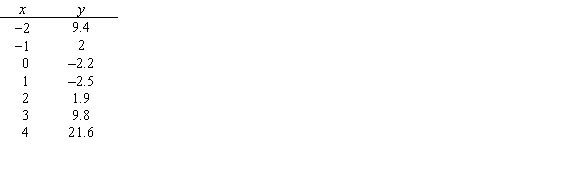
A)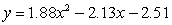
B)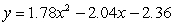
C)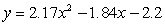
D)
E)
A)
B)
C)
D)
E)
سؤال
A chemical reaction begins when a certain mixture reaches  C. The reaction activity is measured in units (U) per 100 microliters
  of the mixture. Measurements during the first 18 minutes after the mixture reaches
  C are listed in the accompanying table. Estimate the limiting value.
A) 3.86
B) 1.93
C) 4.06
D) 3.83
E) 1.73
C. The reaction activity is measured in units (U) per 100 microliters of the mixture. Measurements during the first 18 minutes after the mixture reaches C are listed in the accompanying table. Estimate the limiting value. A) 3.86
B) 1.93
C) 4.06
D) 3.83
E) 1.73
سؤال
Rewrite the following pair of functions as one composite function.  ;
; 
A)
B)
C)
D)
E)
; A)
B)
C)
D)
E)
سؤال
Write the product of the two functions. Evaluate the constructed function at 2. 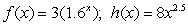
A)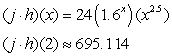
B)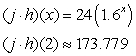
C)
D)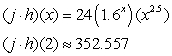
E)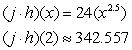
A)
B)
C)
D)
E)
سؤال
سؤال
What is the period of the following function? 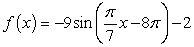
A) 14
B) 56
C) 2
D) 9
E) 11
A) 14
B) 56
C) 2
D) 9
E) 11
سؤال
سؤال
The table below gives the normal daily mean temperatures, based on a 30-year period 1961 through 1990, for a certain city. Use the data to estimate the period. 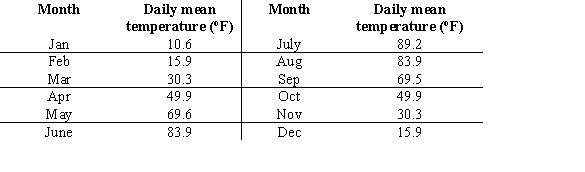
A) 11 months
B) 2 months
C) 4 months
D) 12 months
E) 360 months
A) 11 months
B) 2 months
C) 4 months
D) 12 months
E) 360 months
سؤال
Find the amplitude of the following function. Round to two decimal places. 
A) 5.00
B) 2.00
C) 1.26
D) 3.14
E) 4.00
A) 5.00
B) 2.00
C) 1.26
D) 3.14
E) 4.00
سؤال
What is the amplitude of the following function? 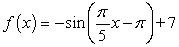
A) 5
B) 7
C) 10
D) 1
E) -1
A) 5
B) 7
C) 10
D) 1
E) -1
سؤال
Find the period of the following function. Round to two decimal places. 
A) 1.00
B) 6.28
C) 4.00
D) 1.57
E) 8.00
A) 1.00
B) 6.28
C) 4.00
D) 1.57
E) 8.00
سؤال
What is the horizontal shift of the following function? 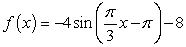
A) right
B) left 8
C) right 3
D) left
E) left 3
A) right
B) left 8
C) right 3
D) left
E) left 3
سؤال
Some populations of animals exhibit periodic behavior over time. During the 1960s and 1970s, two scientists carefully studied the population of the Carabid beetle in a region of the Netherlands. Assume that the table below shows the results from their study. Renumber the input data as years since 1965. Using only the data, estimate the horizontal shift, where a shift of zero corresponds to the year 1964. Round your answer to the nearest year. 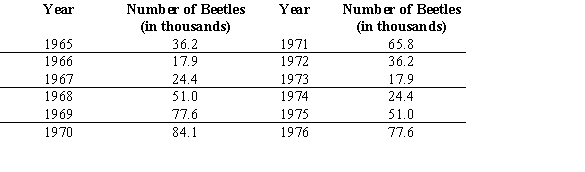
A) 4 years
B) 34 years
C) 7 years
D) 5 years
E) 3 years
A) 4 years
B) 34 years
C) 7 years
D) 5 years
E) 3 years
سؤال
Find the amplitude of the following function. Round to two decimal places. 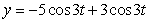
A) 3.00
B) 8.00
C) 5.00
D) 0.00
E) 2.00
A) 3.00
B) 8.00
C) 5.00
D) 0.00
E) 2.00
سؤال
The table below gives the normal daily mean temperatures, based on a 30-year period 1961 through 1990, for a certain city. Which of the following sine models best represents the mean daily temperature, where x denotes the number of the month in a calendar year. 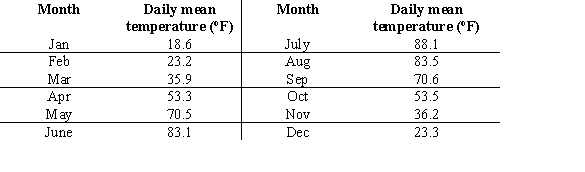
A)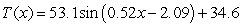
B)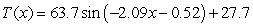
C)
D)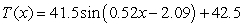
E)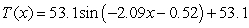
A)
B)
C)
D)
E)
سؤال
Some populations of animals exhibit periodic behavior over time. During the 1960s and 1970s, two scientists carefully studied the population of the Carabid beetle in a region of the Netherlands. Assume that the table below shows the results from their study. Without the aid of technology, choose the sine model which is the most reasonable fit to data, where x is the number of years since 1964. 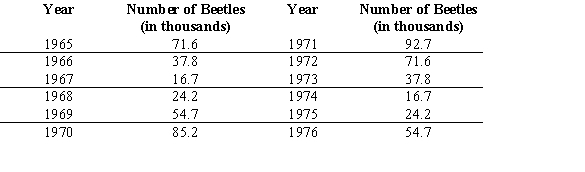
A)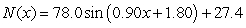
B)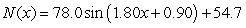
C)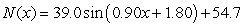
D)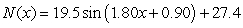
E)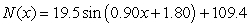
A)
B)
C)
D)
E)
سؤال
The table below gives the normal daily mean temperatures, based on a 30-year period 1961 through 1990, for a certain city. Use the data to estimate the amplitude to the nearest degree. 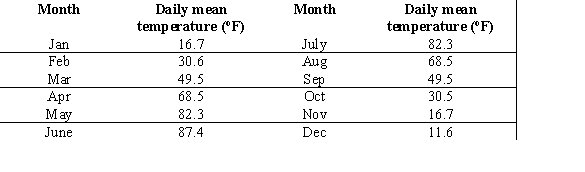
A)
B)
C)
D)
E)
A)
B)
C)
D)
E)

فتح الحزمة
قم بالتسجيل لفتح البطاقات في هذه المجموعة!
Unlock Deck
Unlock Deck
1/50
العب
ملء الشاشة (f)
Deck 1: Ingredients of Change: Functions an Limits
1
For the function, write the equations for any horizontal asymptote(s).
A) and
B) and
C)
D)
E) no horizontal asymptotes
A)
and B)
and C)
D)
E) no horizontal asymptotes
and 2
Complete the table and use it to predict the limit, if it exists.
A)
B)
C)
D)
E) does not exist
A)
B)
C)
D)
E) does not exist
does not exist
3
Numerically estimate the limits. Show the numerical estimation table. start , increment estimate to the nearest integer.
A)
B)
C)
D)
E)
start , increment estimate to the nearest integer.A)
B)
C)
D)
E)
4
Write a linear model for the given rate of change and initial output value. The cost to produce plastic toys increases by 10 cents per toy produced. The fixed cost is 90 dollars.
A)
B)
C)
D)
E)
A)
B)
C)
D)
E)
فتح الحزمة
افتح القفل للوصول البطاقات البالغ عددها 50 في هذه المجموعة.
فتح الحزمة
k this deck
5
Calculate the output value that corresponds to the given input values of the function.
A)
B)
C)
D)
E)
A)
B)
C)
D)
E)
فتح الحزمة
افتح القفل للوصول البطاقات البالغ عددها 50 في هذه المجموعة.
فتح الحزمة
k this deck
6
Find the input of the function corresponding to the output to three decimal places.
A)
B)
C)
D)
E)
corresponding to the output to three decimal places.A)
B)
C)
D)
E)
فتح الحزمة
افتح القفل للوصول البطاقات البالغ عددها 50 في هذه المجموعة.
فتح الحزمة
k this deck
7
Use properties of limits and algebraic methods to find the limit, if it exists.
A) -1
B) 14
C) -14
D) 1
E) does not exist
A) -1
B) 14
C) -14
D) 1
E) does not exist
فتح الحزمة
افتح القفل للوصول البطاقات البالغ عددها 50 في هذه المجموعة.
فتح الحزمة
k this deck
8
Given evaluate Round to the nearest ten-thousandth.
A) 426.75
B) 400.429
C) 406.429
D) 2.9975
evaluate Round to the nearest ten-thousandth.A) 426.75
B) 400.429
C) 406.429
D)
2.9975 فتح الحزمة
افتح القفل للوصول البطاقات البالغ عددها 50 في هذه المجموعة.
فتح الحزمة
k this deck
9
Use properties of limits and algebraic methods to find the limit, if it exists.
A)
B)
C)
D)
E) does not exist
A)
B)
C)
D)
E) does not exist
فتح الحزمة
افتح القفل للوصول البطاقات البالغ عددها 50 في هذه المجموعة.
فتح الحزمة
k this deck
10
Evaluate the function at the given values of the independent variables.
A)
B)
C)
D)
E)
A)
B)
C)
D)
E)
فتح الحزمة
افتح القفل للوصول البطاقات البالغ عددها 50 في هذه المجموعة.
فتح الحزمة
k this deck
11
Use properties of limits and algebraic methods to find the limit, if it exists.
A)
B)
C)
D)
E) does not exist
A)
B)
C)
D)
E) does not exist
فتح الحزمة
افتح القفل للوصول البطاقات البالغ عددها 50 في هذه المجموعة.
فتح الحزمة
k this deck
12
Calculate the average rate of change in the population (in people per month) between April, 1999, and July, 2001.
A) -3548 people per month
B) -3992 people per month
C) -19,160 people per month
D) -2903 people per month
E) -8709 people per month
A) -3548 people per month
B) -3992 people per month
C) -19,160 people per month
D) -2903 people per month
E) -8709 people per month
فتح الحزمة
افتح القفل للوصول البطاقات البالغ عددها 50 في هذه المجموعة.
فتح الحزمة
k this deck
13
For the given function write limit notation for the end behavior.
A)
B)
C)
D)
E)
A)
B)
C)
D)
E)
فتح الحزمة
افتح القفل للوصول البطاقات البالغ عددها 50 في هذه المجموعة.
فتح الحزمة
k this deck
14
The percentage of mothers in a large city who gave birth to a child in 2005 and returned to the workforce within x months of having the child is modeled as percent What percentage of mothers returned to the workforce within the first year after giving birth?
Round to the nearest thousandth.
A) 51.222%
B) 28.435%
C) 36.925%
D) 38.980%
E) 25.272%
percent What percentage of mothers returned to the workforce within the first year after giving birth?Round to the nearest thousandth.
A) 51.222%
B) 28.435%
C) 36.925%
D) 38.980%
E) 25.272%
فتح الحزمة
افتح القفل للوصول البطاقات البالغ عددها 50 في هذه المجموعة.
فتح الحزمة
k this deck
15
Use properties of limits and algebraic methods to find the limit, if it exists.
A)
B)
C)
D)
E) does not exist
A)
B)
C)
D)
E) does not exist
فتح الحزمة
افتح القفل للوصول البطاقات البالغ عددها 50 في هذه المجموعة.
فتح الحزمة
k this deck
16
How much money would you have to invest today at 6% APR compounded monthly to accumulate the sum of $270,000 in 37 years? Round to the nearest hundredth.
A)
B)
C)
D)
E)
A)
B)
C)
D)
E)
فتح الحزمة
افتح القفل للوصول البطاقات البالغ عددها 50 في هذه المجموعة.
فتح الحزمة
k this deck
17
Find the input of the function corresponding to the output .
A)
B)
C)
D)
E)
corresponding to the output .A)
B)
C)
D)
E)
فتح الحزمة
افتح القفل للوصول البطاقات البالغ عددها 50 في هذه المجموعة.
فتح الحزمة
k this deck
18
Use properties of limits and algebraic methods to find the limit, if it exists.
A)
B)
C)
D)
E) does not exist
A)
B)
C)
D)
E) does not exist
فتح الحزمة
افتح القفل للوصول البطاقات البالغ عددها 50 في هذه المجموعة.
فتح الحزمة
k this deck
19
Calculate the constant percentage change for the given function.
A) 15%
B) 0.15%
C) 72%
D) 82.8%
E) 10.8%
A) 15%
B) 0.15%
C) 72%
D) 82.8%
E) 10.8%
فتح الحزمة
افتح القفل للوصول البطاقات البالغ عددها 50 في هذه المجموعة.
فتح الحزمة
k this deck
20
Use the formula to find the doubling time t, in years, for an investment at r% compounded n times per year. Suppose you make an investment of $1300 at interest rate 12% compounded quarterly. How long will it take for your investment to double?
A) 3.06 years
B) 1.95 years
C) 11.72 years
D) 0.76 years
E) 5.86 years
to find the doubling time t, in years, for an investment at r% compounded n times per year. Suppose you make an investment of $1300 at interest rate 12% compounded quarterly. How long will it take for your investment to double?A) 3.06 years
B) 1.95 years
C) 11.72 years
D) 0.76 years
E) 5.86 years
فتح الحزمة
افتح القفل للوصول البطاقات البالغ عددها 50 في هذه المجموعة.
فتح الحزمة
k this deck
21
In 1996, the population of a country was estimated at 4 million. For any subsequent year the population in millions is where t is the number of years since 1996. Use a graphing calculator to estimate the population in 2005.
A) 4,743,000
B) 4,699,000
C) 4,655,000
D) 4,833,000
in millions is where t is the number of years since 1996. Use a graphing calculator to estimate the population in 2005.A) 4,743,000
B) 4,699,000
C) 4,655,000
D) 4,833,000
فتح الحزمة
افتح القفل للوصول البطاقات البالغ عددها 50 في هذه المجموعة.
فتح الحزمة
k this deck
22
Rewrite the following pair of functions as one composite function. ;
A)
B)
C)
D)
E)
; A)
B)
C)
D)
E)
فتح الحزمة
افتح القفل للوصول البطاقات البالغ عددها 50 في هذه المجموعة.
فتح الحزمة
k this deck
23
Indicate whether the function is an increasing or decreasing logistic function and identify the upper limiting value of the function .
A) The function is decreasing and the upper limit is 29.00.
B) The function is decreasing and the upper limit is 2.37.
C) The function is decreasing and the upper limit is -2.37.
D) The function is increasing and the upper limit is 0.00.
E) The function is increasing and the upper limit is 29.00.
.A) The function is decreasing and the upper limit is 29.00.
B) The function is decreasing and the upper limit is 2.37.
C) The function is decreasing and the upper limit is -2.37.
D) The function is increasing and the upper limit is 0.00.
E) The function is increasing and the upper limit is 29.00.
فتح الحزمة
افتح القفل للوصول البطاقات البالغ عددها 50 في هذه المجموعة.
فتح الحزمة
k this deck
24
The total cost for producing units of a commodity is $4.8 million, and the revenue generated by the sale of units is $7.4 million. What is the profit on units of the commodity?
A) $12.2 million
B) $1.5 million
C) $2.6 million
D) $4.8 million
E) $7.4 million
units of a commodity is $4.8 million, and the revenue generated by the sale of units is $7.4 million. What is the profit on units of the commodity?A) $12.2 million
B) $1.5 million
C) $2.6 million
D) $4.8 million
E) $7.4 million
فتح الحزمة
افتح القفل للوصول البطاقات البالغ عددها 50 في هذه المجموعة.
فتح الحزمة
k this deck
25
Your credit card statement indicates a finance charge of 20.00 % per month on the outstanding balance. What is the effective rate of interest (APY) to the nearest hundredth?
A) 20.00 %
B) 21.94 %
C) 21.67 %
D) 240.00 %
E) 1.67 %
A) 20.00 %
B) 21.94 %
C) 21.67 %
D) 240.00 %
E) 1.67 %
فتح الحزمة
افتح القفل للوصول البطاقات البالغ عددها 50 في هذه المجموعة.
فتح الحزمة
k this deck
26
The table gives the percent of the population of a certain city that was foreign born in the given year. Find a cubic function that best fits the data where x is the number of years after 1900 and y is equal to the percent. By trial and error, estimate the year the model predicts that the foreign-born population will be 100%.
A) foreign born population will be 100% in 1965.
B) foreign born population will be 100% in 1975.
C) foreign born population will be 100% in 1975.
D) foreign born population will be 100% in 1965.
E) foreign born population will be 100% in 1985.
A)
foreign born population will be 100% in 1965.B)
foreign born population will be 100% in 1975.C)
foreign born population will be 100% in 1975.D)
foreign born population will be 100% in 1965.E)
foreign born population will be 100% in 1985. فتح الحزمة
افتح القفل للوصول البطاقات البالغ عددها 50 في هذه المجموعة.
فتح الحزمة
k this deck
27
Indicate whether the function is an increasing or decreasing logistic function and identify the upper limiting value of the function .
A) The function is decreasing and the upper limit is 2.7.
B) The function is decreasing and the upper limit is -0.4.
C) The function is decreasing and the upper limit is 0.4.
D) The function is increasing and the upper limit is 4.2.
E) The function is increasing and the upper limit is 0.0.
.A) The function is decreasing and the upper limit is 2.7.
B) The function is decreasing and the upper limit is -0.4.
C) The function is decreasing and the upper limit is 0.4.
D) The function is increasing and the upper limit is 4.2.
E) The function is increasing and the upper limit is 0.0.
فتح الحزمة
افتح القفل للوصول البطاقات البالغ عددها 50 في هذه المجموعة.
فتح الحزمة
k this deck
28
Choose the function type for the mathematical model that best represents the given data set.
A) logistic
B) quadratic
C) linear
D) exponential
E) logarithmic
A) logistic
B) quadratic
C) linear
D) exponential
E) logarithmic
فتح الحزمة
افتح القفل للوصول البطاقات البالغ عددها 50 في هذه المجموعة.
فتح الحزمة
k this deck
29
Calculate the total amount due after two years on a loan of $1100 with a simple interest charge of 7%.
A) $1254
B) $1204
C) $1304
D) $1354
E) $1154
A) $1254
B) $1204
C) $1304
D) $1354
E) $1154
فتح الحزمة
افتح القفل للوصول البطاقات البالغ عددها 50 في هذه المجموعة.
فتح الحزمة
k this deck
30
In 1990, there were 2 women among the CEOs of Fortune 500 companies. In 2009, this number had risen to 18 women. What was the percentage change in the number of Fortune 500 women CEOs between 1990 and 2009?
A) 800%
B) 8%
C) 180%
D) 20%
E) 91%
A) 800%
B) 8%
C) 180%
D) 20%
E) 91%
فتح الحزمة
افتح القفل للوصول البطاقات البالغ عددها 50 في هذه المجموعة.
فتح الحزمة
k this deck
31
The following table gives the percent of the U.S. population with Internet connections for the years 1997 to 2003. Use a calculator to find the logistic function that models these data. Use x as the number of years past 1995. Source: U.S. Department of Commerce
A)
B)
C)
D)
E)
Source: U.S. Department of CommerceA)
B)
C)
D)
E)
فتح الحزمة
افتح القفل للوصول البطاقات البالغ عددها 50 في هذه المجموعة.
فتح الحزمة
k this deck
32
Indicate whether the function is an increasing or decreasing logistic function and identify the upper limiting value of the function
A) The function is increasing and the upper limit is 18.00.
B) The function is decreasing and the upper limit is 18.00.
C) The function is increasing and the upper limit is 68.00.
D) The function is decreasing and the upper limit is 68.00.
E) The function is decreasing and the upper limit is 0.00.
A) The function is increasing and the upper limit is 18.00.
B) The function is decreasing and the upper limit is 18.00.
C) The function is increasing and the upper limit is 68.00.
D) The function is decreasing and the upper limit is 68.00.
E) The function is decreasing and the upper limit is 0.00.
فتح الحزمة
افتح القفل للوصول البطاقات البالغ عددها 50 في هذه المجموعة.
فتح الحزمة
k this deck
33
To offset college expenses, at the beginning of your freshman year you obtain a nonsubsidized student loan for $18,000. Interest on this loan accrues at a rate of 3.15% compounded monthly. However, you do not have to make any payments against either the principal or the interest until after you graduate. Write a model giving the total amount you will owe on this loan after t years in college.
A)
B)
C)
D)
E)
A)
B)
C)
D)
E)
فتح الحزمة
افتح القفل للوصول البطاقات البالغ عددها 50 في هذه المجموعة.
فتح الحزمة
k this deck
34
Find the equation of the quadratic function that is the best fit for the given data.
A)
B)
C)
D)
E)
A)
B)
C)
D)
E)
فتح الحزمة
افتح القفل للوصول البطاقات البالغ عددها 50 في هذه المجموعة.
فتح الحزمة
k this deck
35
A chemical reaction begins when a certain mixture reaches C. The reaction activity is measured in units (U) per 100 microliters of the mixture. Measurements during the first 18 minutes after the mixture reaches C are listed in the accompanying table. Estimate the limiting value.
A) 3.86
B) 1.93
C) 4.06
D) 3.83
E) 1.73
C. The reaction activity is measured in units (U) per 100 microliters of the mixture. Measurements during the first 18 minutes after the mixture reaches C are listed in the accompanying table. Estimate the limiting value. A) 3.86
B) 1.93
C) 4.06
D) 3.83
E) 1.73
فتح الحزمة
افتح القفل للوصول البطاقات البالغ عددها 50 في هذه المجموعة.
فتح الحزمة
k this deck
36
Rewrite the following pair of functions as one composite function. ;
A)
B)
C)
D)
E)
; A)
B)
C)
D)
E)
فتح الحزمة
افتح القفل للوصول البطاقات البالغ عددها 50 في هذه المجموعة.
فتح الحزمة
k this deck
37
Write the product of the two functions. Evaluate the constructed function at 2.
A)
B)
C)
D)
E)
A)
B)
C)
D)
E)
فتح الحزمة
افتح القفل للوصول البطاقات البالغ عددها 50 في هذه المجموعة.
فتح الحزمة
k this deck
38
How long would it take an investment to double if the interest rate is 4.2%, compounded monthly? Round your answer to two decimal places.
A) 16.85 years
B) 0.48 year
C) 17.68 years
D) 16.53 years
E) 1.38 years
A) 16.85 years
B) 0.48 year
C) 17.68 years
D) 16.53 years
E) 1.38 years
فتح الحزمة
افتح القفل للوصول البطاقات البالغ عددها 50 في هذه المجموعة.
فتح الحزمة
k this deck
39
What is the period of the following function?
A) 14
B) 56
C) 2
D) 9
E) 11
A) 14
B) 56
C) 2
D) 9
E) 11
فتح الحزمة
افتح القفل للوصول البطاقات البالغ عددها 50 في هذه المجموعة.
فتح الحزمة
k this deck
40
It cost a company $6.75 to produce 75 glass bottles. What was the average cost of production of a glass bottle to the nearest cent?
A) $0.07
B) $0.75
C) $0.14
D) $40.88
E) $0.09
A) $0.07
B) $0.75
C) $0.14
D) $40.88
E) $0.09
فتح الحزمة
افتح القفل للوصول البطاقات البالغ عددها 50 في هذه المجموعة.
فتح الحزمة
k this deck
41
The table below gives the normal daily mean temperatures, based on a 30-year period 1961 through 1990, for a certain city. Use the data to estimate the period.
A) 11 months
B) 2 months
C) 4 months
D) 12 months
E) 360 months
A) 11 months
B) 2 months
C) 4 months
D) 12 months
E) 360 months
فتح الحزمة
افتح القفل للوصول البطاقات البالغ عددها 50 في هذه المجموعة.
فتح الحزمة
k this deck
42
Find the amplitude of the following function. Round to two decimal places.
A) 5.00
B) 2.00
C) 1.26
D) 3.14
E) 4.00
A) 5.00
B) 2.00
C) 1.26
D) 3.14
E) 4.00
فتح الحزمة
افتح القفل للوصول البطاقات البالغ عددها 50 في هذه المجموعة.
فتح الحزمة
k this deck
43
What is the amplitude of the following function?
A) 5
B) 7
C) 10
D) 1
E) -1
A) 5
B) 7
C) 10
D) 1
E) -1
فتح الحزمة
افتح القفل للوصول البطاقات البالغ عددها 50 في هذه المجموعة.
فتح الحزمة
k this deck
44
Find the period of the following function. Round to two decimal places.
A) 1.00
B) 6.28
C) 4.00
D) 1.57
E) 8.00
A) 1.00
B) 6.28
C) 4.00
D) 1.57
E) 8.00
فتح الحزمة
افتح القفل للوصول البطاقات البالغ عددها 50 في هذه المجموعة.
فتح الحزمة
k this deck
45
What is the horizontal shift of the following function?
A) right
B) left 8
C) right 3
D) left
E) left 3
A) right
B) left 8
C) right 3
D) left
E) left 3
فتح الحزمة
افتح القفل للوصول البطاقات البالغ عددها 50 في هذه المجموعة.
فتح الحزمة
k this deck
46
Some populations of animals exhibit periodic behavior over time. During the 1960s and 1970s, two scientists carefully studied the population of the Carabid beetle in a region of the Netherlands. Assume that the table below shows the results from their study. Renumber the input data as years since 1965. Using only the data, estimate the horizontal shift, where a shift of zero corresponds to the year 1964. Round your answer to the nearest year.
A) 4 years
B) 34 years
C) 7 years
D) 5 years
E) 3 years
A) 4 years
B) 34 years
C) 7 years
D) 5 years
E) 3 years
فتح الحزمة
افتح القفل للوصول البطاقات البالغ عددها 50 في هذه المجموعة.
فتح الحزمة
k this deck
47
Find the amplitude of the following function. Round to two decimal places.
A) 3.00
B) 8.00
C) 5.00
D) 0.00
E) 2.00
A) 3.00
B) 8.00
C) 5.00
D) 0.00
E) 2.00
فتح الحزمة
افتح القفل للوصول البطاقات البالغ عددها 50 في هذه المجموعة.
فتح الحزمة
k this deck
48
The table below gives the normal daily mean temperatures, based on a 30-year period 1961 through 1990, for a certain city. Which of the following sine models best represents the mean daily temperature, where x denotes the number of the month in a calendar year.
A)
B)
C)
D)
E)
A)
B)
C)
D)
E)
فتح الحزمة
افتح القفل للوصول البطاقات البالغ عددها 50 في هذه المجموعة.
فتح الحزمة
k this deck
49
Some populations of animals exhibit periodic behavior over time. During the 1960s and 1970s, two scientists carefully studied the population of the Carabid beetle in a region of the Netherlands. Assume that the table below shows the results from their study. Without the aid of technology, choose the sine model which is the most reasonable fit to data, where x is the number of years since 1964.
A)
B)
C)
D)
E)
A)
B)
C)
D)
E)
فتح الحزمة
افتح القفل للوصول البطاقات البالغ عددها 50 في هذه المجموعة.
فتح الحزمة
k this deck
50
The table below gives the normal daily mean temperatures, based on a 30-year period 1961 through 1990, for a certain city. Use the data to estimate the amplitude to the nearest degree.
A)
B)
C)
D)
E)
A)
B)
C)
D)
E)
فتح الحزمة
افتح القفل للوصول البطاقات البالغ عددها 50 في هذه المجموعة.
فتح الحزمة
k this deck
فتح الحزمة
افتح القفل للوصول البطاقات البالغ عددها 50 في هذه المجموعة.


