Deck 13: Multiple Regression Analysis
ملء الشاشة (f)
سؤال
سؤال
سؤال
سؤال
سؤال
سؤال
سؤال
سؤال
سؤال
سؤال
سؤال
سؤال
سؤال
سؤال
سؤال
سؤال
سؤال
سؤال
سؤال
سؤال
سؤال
سؤال
سؤال
سؤال
سؤال
سؤال
سؤال
سؤال
سؤال
سؤال
سؤال
A multiple regression analysis produced the following tables. 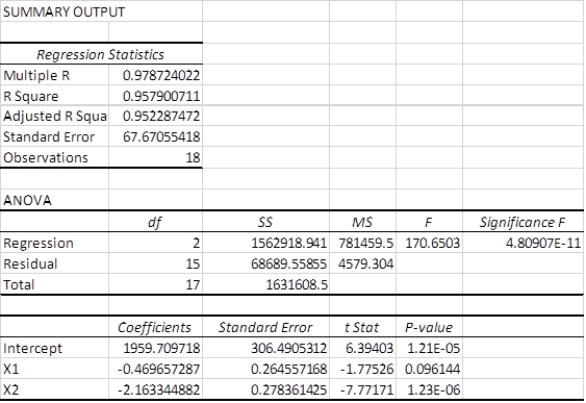 The regression equation for this analysis is ____________.
A)y = 1959.71 + 0.46 x1 + 2.16 x2
B)y = 1959.71 - 0.46 x1 + 2.16 x2
C)y = 1959.71 - 0.46 x1 - 2.16 x2
D)y =1959.71 + 0.46 x1 - 2.16 x2
E)y =- 0.46 x1 - 2.16 x2
The regression equation for this analysis is ____________.A)y = 1959.71 + 0.46 x1 + 2.16 x2
B)y = 1959.71 - 0.46 x1 + 2.16 x2
C)y = 1959.71 - 0.46 x1 - 2.16 x2
D)y =1959.71 + 0.46 x1 - 2.16 x2
E)y =- 0.46 x1 - 2.16 x2
سؤال
سؤال
A multiple regression analysis produced the following tables. 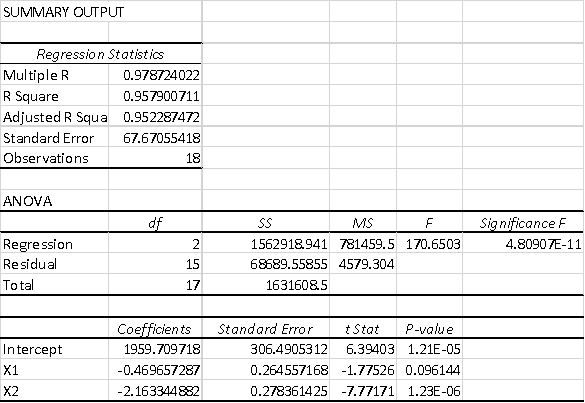 For x1= 360 and x2 = 220,the predicted value of y is ____________.
A)1314.70
B)1959.71
C)1077.58
D)2635.19
E)2265.57
For x1= 360 and x2 = 220,the predicted value of y is ____________.A)1314.70
B)1959.71
C)1077.58
D)2635.19
E)2265.57
سؤال
سؤال
سؤال
A multiple regression analysis produced the following tables. 
 The sample size for this analysis is ____________.
A)19
B)17
C)34
D)15
E)18
The sample size for this analysis is ____________.A)19
B)17
C)34
D)15
E)18
سؤال
سؤال
سؤال
A multiple regression analysis produced the following tables. 
 The regression equation for this analysis is ____________.
A)y = 616.6849 + 3.33833 x1 + 1.780075 x2
B)y = 154.5535 - 1.43058 x1 + 5.30407 x2
C)y = 616.6849 - 3.33833 x1 - 1.780075 x2
D)y = 154.5535 + 2.333548 x1 + 0.335605 x2
E)y = 616.6849 - 3.33833 x1 + 1.780075 x2
The regression equation for this analysis is ____________.A)y = 616.6849 + 3.33833 x1 + 1.780075 x2
B)y = 154.5535 - 1.43058 x1 + 5.30407 x2
C)y = 616.6849 - 3.33833 x1 - 1.780075 x2
D)y = 154.5535 + 2.333548 x1 + 0.335605 x2
E)y = 616.6849 - 3.33833 x1 + 1.780075 x2
سؤال
سؤال
The following ANOVA table is from a multiple regression analysis with n = 35 and four independent variables.  The MSE value is __________.
A)8.57
B)8.82
C)10.00
D)75.00
E)20.00
The MSE value is __________.A)8.57
B)8.82
C)10.00
D)75.00
E)20.00
سؤال
سؤال
A multiple regression analysis produced the following tables. 
 These results indicate that ____________.
A)none of the predictor variables are significant at the 5% level
B)each predictor variable is significant at the 5% level
C)x1 is significant at the 5% level
D)x2 is significant at the 5% level
E)the intercept is not significant at 5% level
These results indicate that ____________.A)none of the predictor variables are significant at the 5% level
B)each predictor variable is significant at the 5% level
C)x1 is significant at the 5% level
D)x2 is significant at the 5% level
E)the intercept is not significant at 5% level
سؤال
The following ANOVA table is from a multiple regression analysis with n = 35 and four independent variables.  The number of degrees of freedom for error is __________.
A)1
B)4
C)34
D)30
E)35
The number of degrees of freedom for error is __________.A)1
B)4
C)34
D)30
E)35
سؤال
A multiple regression analysis produced the following tables. 
Using = 0.05 to test the null hypothesis H0: 1 = 0,the correct decision is ____.
A)fail to reject the null hypothesis
B)reject the null hypothesis
C)fail to reject the alternative hypothesis
D)reject the alternative hypothesis
E)there is not enought information provided to make a decision
Using = 0.05 to test the null hypothesis H0: 1 = 0,the correct decision is ____.
A)fail to reject the null hypothesis
B)reject the null hypothesis
C)fail to reject the alternative hypothesis
D)reject the alternative hypothesis
E)there is not enought information provided to make a decision
سؤال
A multiple regression analysis produced the following tables. 

Using = 0.05 to test the null hypothesis H0: 1 = 0,the critical t value is ____.
A)± 1.753
B)± 2.110
C)± 2.131
D)± 1.740
E)± 2.500
Using = 0.05 to test the null hypothesis H0: 1 = 0,the critical t value is ____.
A)± 1.753
B)± 2.110
C)± 2.131
D)± 1.740
E)± 2.500
سؤال
The following ANOVA table is from a multiple regression analysis with n = 35 and four independent variables.  The adjusted R2 value is __________.
A)0.80
B)0.70
C)0.66
D)0.76
E)0.30
The adjusted R2 value is __________.A)0.80
B)0.70
C)0.66
D)0.76
E)0.30
سؤال
A multiple regression analysis produced the following tables. 

Using = 0.10 to test the null hypothesis H0: 2 = 0,the critical t value is ____.
A)±1.345
B)±1.356
C)±1.761
D)±2.782
E)±1.782
Using = 0.10 to test the null hypothesis H0: 2 = 0,the critical t value is ____.
A)±1.345
B)±1.356
C)±1.761
D)±2.782
E)±1.782
سؤال
A multiple regression analysis produced the following tables. 
 These results indicate that ____________.
A)none of the predictor variables are significant at the 5% level
B)each predictor variable is significant at the 5% level
C)x1 is the only predictor variable significant at the 5% level
D)x2 is the only predictor variable significant at the 5% level
E)the intercept is not significant at the 5% level
These results indicate that ____________.A)none of the predictor variables are significant at the 5% level
B)each predictor variable is significant at the 5% level
C)x1 is the only predictor variable significant at the 5% level
D)x2 is the only predictor variable significant at the 5% level
E)the intercept is not significant at the 5% level
سؤال
A multiple regression analysis produced the following tables.  These results indicate that ____________.
A)none of the predictor variables are significant at the 10% level
B)each predictor variable is significant at the 10% level
C)x1 is significant at the 10% level
D)x2 is significant at the 10% level
E)the intercept is not significant at 10% level
These results indicate that ____________.A)none of the predictor variables are significant at the 10% level
B)each predictor variable is significant at the 10% level
C)x1 is significant at the 10% level
D)x2 is significant at the 10% level
E)the intercept is not significant at 10% level
سؤال
The following ANOVA table is from a multiple regression analysis with n = 35 and four independent variables.  The observed F value is __________.
A)17.50
B)2.33
C)0.70
D)0.43
E)0.50
The observed F value is __________.A)17.50
B)2.33
C)0.70
D)0.43
E)0.50
سؤال
A multiple regression analysis produced the following tables.  The sample size for this analysis is ____________.
A)12
B)15
C)17
D)18
E)24
The sample size for this analysis is ____________.A)12
B)15
C)17
D)18
E)24
سؤال
The following ANOVA table is from a multiple regression analysis with n = 35 and four independent variables.  The R2 value is __________.
A)0.80
B)0.70
C)0.66
D)0.76
E)0.30
The R2 value is __________.A)0.80
B)0.70
C)0.66
D)0.76
E)0.30
سؤال
The following ANOVA table is from a multiple regression analysis with n = 35 and four independent variables.  The value of the standard error of the estimate se is __________.
A)13.23
B)3.16
C)17.32
D)26.46
E)10.00
The value of the standard error of the estimate se is __________.A)13.23
B)3.16
C)17.32
D)26.46
E)10.00
سؤال
The following ANOVA table is from a multiple regression analysis with n = 35 and four independent variables.  The number of degrees of freedom for regression is __________.
A)1
B)4
C)34
D)30
E)35
The number of degrees of freedom for regression is __________.A)1
B)4
C)34
D)30
E)35
سؤال
A multiple regression analysis produced the following tables. 

Using = 0.01 to test the null hypothesis H0: 1 = 2 = 0,the critical F value is ____.
A)8.68
B)6.36
C)8.40
D)6.11
E)3.36
Using = 0.01 to test the null hypothesis H0: 1 = 2 = 0,the critical F value is ____.
A)8.68
B)6.36
C)8.40
D)6.11
E)3.36
سؤال
A multiple regression analysis produced the following tables. 
Using = 0.05 to test the null hypothesis H0: 2 = 0,the correct decision is ____.
A)fail to reject the null hypothesis
B)reject the null hypothesis
C)fail to reject the alternative hypothesis
D)reject the alternative hypothesis
E)there is not enought information provided to make a decision
Using = 0.05 to test the null hypothesis H0: 2 = 0,the correct decision is ____.
A)fail to reject the null hypothesis
B)reject the null hypothesis
C)fail to reject the alternative hypothesis
D)reject the alternative hypothesis
E)there is not enought information provided to make a decision
سؤال
A multiple regression analysis produced the following tables. 

Using = 0.05 to test the null hypothesis H0: 1 = 2 = 0,the critical F value is ____.
A)3.74
B)3.89
C)4.75
D)4.60
E)2.74
Using = 0.05 to test the null hypothesis H0: 1 = 2 = 0,the critical F value is ____.
A)3.74
B)3.89
C)4.75
D)4.60
E)2.74
سؤال
A multiple regression analysis produced the following tables. 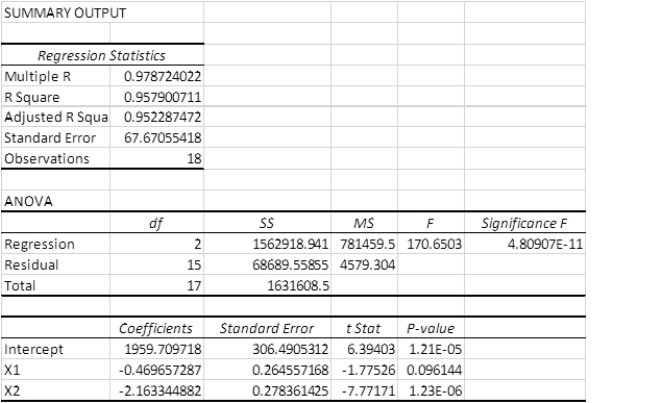
Using = 0.01 to test the model,these results indicate that ____________.
A)at least one of the regression variables is a significant predictor of y
B)none of the regression variables are significant predictors of y
C)y cannot be sufficiently predicted using these data
D)y is a good predictor of the regression variables in the model
E)the y intercept in this model is the best predictor variable
سؤال
The following ANOVA table is from a multiple regression analysis with n = 35 and four independent variables.  The MSR value is __________.
A)700.00
B)350.00
C)233.33
D)175.00
E)275.00
The MSR value is __________.A)700.00
B)350.00
C)233.33
D)175.00
E)275.00
سؤال
The following ANOVA table is from a multiple regression analysis.  The MSE value is __________.
A)31
B)500
C)16
D)2300
E)8.7
The MSE value is __________.A)31
B)500
C)16
D)2300
E)8.7
سؤال
A multiple regression analysis produced the following tables. 

Using = 0.01 to test the null hypothesis H0: 1 = 2 = 0,the critical F value is ____.
A)5.99
B)5.70
C)1.96
D)4.84
E)6.70
Using = 0.01 to test the null hypothesis H0: 1 = 2 = 0,the critical F value is ____.
A)5.99
B)5.70
C)1.96
D)4.84
E)6.70
سؤال
The following ANOVA table is from a multiple regression analysis.  The R2 value is __________.
A)0.65
B)0.53
C)0.35
D)0.43
E)1.37
The R2 value is __________.A)0.65
B)0.53
C)0.35
D)0.43
E)1.37
سؤال
A multiple regression analysis produced the following tables. 
 For x1= 30 and x2 = 100,the predicted value of y is ____________.
A)753.77
B)1,173.00
C)1,355.26
D)615.13
E)6153.13
For x1= 30 and x2 = 100,the predicted value of y is ____________.A)753.77
B)1,173.00
C)1,355.26
D)615.13
E)6153.13
سؤال
A multiple regression analysis produced the following tables. 
 The coefficient of multiple determination is ____________.
A)0.2079
B)0.0860
C)0.5440
D)0.7921
E)0.5000
The coefficient of multiple determination is ____________.A)0.2079
B)0.0860
C)0.5440
D)0.7921
E)0.5000
سؤال
A multiple regression analysis produced the following tables. 

Using = 0.01 to test the null hypothesis H0: 2 = 0,the critical t value is ____.
A)± 1.174
B)± 2.093
C)± 2.131
D)± 4.012
E)± 3.012
Using = 0.01 to test the null hypothesis H0: 2 = 0,the critical t value is ____.
A)± 1.174
B)± 2.093
C)± 2.131
D)± 4.012
E)± 3.012
سؤال
A multiple regression analysis produced the following tables. 
 The regression equation for this analysis is ____________.
A)y = 302689 + 1153309 x1 + 1455998 x2
B)y = -139.609 + 24.24619 x1 + 32.10171 x2
C)y = 2548.989 + 22.25267 x1 + 17.44559 x2
D)y = -0.05477 + 1.089586 x1 + 1.840105 x2
E)y = 0.05477 + 1.089586 x1 + 1.840105 x2
The regression equation for this analysis is ____________.A)y = 302689 + 1153309 x1 + 1455998 x2
B)y = -139.609 + 24.24619 x1 + 32.10171 x2
C)y = 2548.989 + 22.25267 x1 + 17.44559 x2
D)y = -0.05477 + 1.089586 x1 + 1.840105 x2
E)y = 0.05477 + 1.089586 x1 + 1.840105 x2
سؤال
A multiple regression analysis produced the following tables. 
 These results indicate that ____________.
A)none of the predictor variables are significant at the 5% level
B)each predictor variable is significant at the 5% level
C)x1 is the only predictor variable significant at the 5% level
D)x2 is the only predictor variable significant at the 5% level
E)the intercept is not significant at 5% level
These results indicate that ____________.A)none of the predictor variables are significant at the 5% level
B)each predictor variable is significant at the 5% level
C)x1 is the only predictor variable significant at the 5% level
D)x2 is the only predictor variable significant at the 5% level
E)the intercept is not significant at 5% level
سؤال
A multiple regression analysis produced the following tables. 
 These results indicate that ____________.
A)none of the predictor variables are significant at the 5% level
B)each predictor variable is significant at the 5% level
C)x1 is the only predictor variable significant at the 5% level
D)x2 is the only predictor variable significant at the 5% level
E)all variables are significant at 5% level
These results indicate that ____________.A)none of the predictor variables are significant at the 5% level
B)each predictor variable is significant at the 5% level
C)x1 is the only predictor variable significant at the 5% level
D)x2 is the only predictor variable significant at the 5% level
E)all variables are significant at 5% level
سؤال
The following ANOVA table is from a multiple regression analysis.  The sample size for the analysis is __________.
A)30
B)26
C)3
D)29
E)31
The sample size for the analysis is __________.A)30
B)26
C)3
D)29
E)31
سؤال
A multiple regression analysis produced the following tables. 
 The coefficient of multiple determination is ____________.
A)0.0592
B)0.9138
C)0.1149
D)0.9559
E)1.0000
The coefficient of multiple determination is ____________.A)0.0592
B)0.9138
C)0.1149
D)0.9559
E)1.0000
سؤال
The following ANOVA table is from a multiple regression analysis.  The value of the standard error of the estimate se is __________.
A)30.77
B)5.55
C)4.03
D)3.20
E)0.73
The value of the standard error of the estimate se is __________.A)30.77
B)5.55
C)4.03
D)3.20
E)0.73
سؤال
A multiple regression analysis produced the following tables. 
 The sample size for this analysis is ____________.
A)17
B)13
C)16
D)11
E)15
The sample size for this analysis is ____________.A)17
B)13
C)16
D)11
E)15
سؤال
The following ANOVA table is from a multiple regression analysis.  The adjusted R2 value is __________.
A)0.65
B)0.39
C)0.61
D)0.53
E)0.78
The adjusted R2 value is __________.A)0.65
B)0.39
C)0.61
D)0.53
E)0.78
سؤال
The following ANOVA table is from a multiple regression analysis.  The observed F value is __________.
A)16.25
B)30.77
C)500
D)0.049
E)0.039
The observed F value is __________.A)16.25
B)30.77
C)500
D)0.049
E)0.039
سؤال
The following ANOVA table is from a multiple regression analysis.  The SSE value is __________.
A)30
B)1500
C)500
D)800
E)2300
The SSE value is __________.A)30
B)1500
C)500
D)800
E)2300
سؤال
A multiple regression analysis produced the following tables. 
 The adjusted R2 is ____________.
A)0.9138
B)0.9408
C)0.8981
D)0.8851
E)0.8891
The adjusted R2 is ____________.A)0.9138
B)0.9408
C)0.8981
D)0.8851
E)0.8891
سؤال
A multiple regression analysis produced the following tables. 
 For x1= 40 and x2 = 90,the predicted value of y is ____________.
A)753.77
B)1,173.00
C)1,355.26
D)3,719.39
E)1,565.75
For x1= 40 and x2 = 90,the predicted value of y is ____________.A)753.77
B)1,173.00
C)1,355.26
D)3,719.39
E)1,565.75
سؤال
The following ANOVA table is from a multiple regression analysis.  The number of independent variables in the analysis is __________.
A)30
B)26
C)1
D)3
E)2
The number of independent variables in the analysis is __________.A)30
B)26
C)1
D)3
E)2
سؤال
The following ANOVA table is from a multiple regression analysis.  The MSR value is __________.
A)1500
B)50
C)2300
D)500
E)31
The MSR value is __________.A)1500
B)50
C)2300
D)500
E)31

فتح الحزمة
قم بالتسجيل لفتح البطاقات في هذه المجموعة!
Unlock Deck
Unlock Deck
1/86
العب
ملء الشاشة (f)
Deck 13: Multiple Regression Analysis
1
In the model y = 0 + 1x1 + 2x2 + 3x3 + , is a constant.
False
2
In a multiple regression analysis with N observations and k independent variables,the degrees of freedom for the residual error is given by (N - k).
False
3
The model y = 0 + 1x1 + 2x2 + 3x3 + is a first-order regression model.
True
4
The standard error of the estimate of a multiple regression model is essentially the standard deviation of the residuals for the regression model.
فتح الحزمة
افتح القفل للوصول البطاقات البالغ عددها 86 في هذه المجموعة.
فتح الحزمة
k this deck
5
In a multiple regression model,the partial regression coefficient of an independent variable represents the increase in the y variable when that independent variable is increased by one unit if the values of all other independent variables are held constant.
فتح الحزمة
افتح القفل للوصول البطاقات البالغ عددها 86 في هذه المجموعة.
فتح الحزمة
k this deck
6
A slope in a multiple regression model is known as a partial slope because it ignores the effects of other explanatory variables.
فتح الحزمة
افتح القفل للوصول البطاقات البالغ عددها 86 في هذه المجموعة.
فتح الحزمة
k this deck
7
Multiple t-tests are used to determine whether the independent variables in the regression model are significant.
فتح الحزمة
افتح القفل للوصول البطاقات البالغ عددها 86 في هذه المجموعة.
فتح الحزمة
k this deck
8
The F value that is used to test for the overall significance of a multiple regression model is calculated by dividing the sum of mean squares regression (SSreg)by the sum of squares error (SSerr).
فتح الحزمة
افتح القفل للوصول البطاقات البالغ عددها 86 في هذه المجموعة.
فتح الحزمة
k this deck
9
In a multiple regression analysis with N observations and k independent variables,the degrees of freedom for the residual error is given by (N - k - 1).
فتح الحزمة
افتح القفل للوصول البطاقات البالغ عددها 86 في هذه المجموعة.
فتح الحزمة
k this deck
10
In a multiple regression model,the proportion of the variation of the dependent variable,y,accounted for the independent variables in the regression model is given by the coefficient of multiple correlation.
فتح الحزمة
افتح القفل للوصول البطاقات البالغ عددها 86 في هذه المجموعة.
فتح الحزمة
k this deck
11
The F test is used to determine whether the overall regression model is significant.
فتح الحزمة
افتح القفل للوصول البطاقات البالغ عددها 86 في هذه المجموعة.
فتح الحزمة
k this deck
12
Regression analysis with two dependent variables and two or more independent variables is called multiple regression.
فتح الحزمة
افتح القفل للوصول البطاقات البالغ عددها 86 في هذه المجموعة.
فتح الحزمة
k this deck
13
If we reject H0: β1= β2=0 using the F-test,then we should conclude that both slopes are different from zero.
فتح الحزمة
افتح القفل للوصول البطاقات البالغ عددها 86 في هذه المجموعة.
فتح الحزمة
k this deck
14
The model y = 0 + 1x1 + 2x2 + is a second-order regression model.
فتح الحزمة
افتح القفل للوصول البطاقات البالغ عددها 86 في هذه المجموعة.
فتح الحزمة
k this deck
15
In the multiple regression model y = 0 + 1x1 + 2x2 + 3x3 + ,the coefficients of the x variables are called partial regression coefficients.
فتح الحزمة
افتح القفل للوصول البطاقات البالغ عددها 86 في هذه المجموعة.
فتح الحزمة
k this deck
16
The mean square error (MSerr)is calculated by dividing the sum of squares error (SSerr)by the number of observations in the data set (N).
فتح الحزمة
افتح القفل للوصول البطاقات البالغ عددها 86 في هذه المجموعة.
فتح الحزمة
k this deck
17
In the model y = 0 + 1x1 + 2x2 + 3x3 + ,y is the independent variable.
فتح الحزمة
افتح القفل للوصول البطاقات البالغ عددها 86 في هذه المجموعة.
فتح الحزمة
k this deck
18
The F value that is used to test for the overall significance of a multiple regression model is calculated by dividing the mean square regression (MSreg)by the mean square error (MSerr).
فتح الحزمة
افتح القفل للوصول البطاقات البالغ عددها 86 في هذه المجموعة.
فتح الحزمة
k this deck
19
The mean square error (MSerr)is calculated by dividing the sum of squares error (SSerr)by the number of error degrees of freedom (dferr).
فتح الحزمة
افتح القفل للوصول البطاقات البالغ عددها 86 في هذه المجموعة.
فتح الحزمة
k this deck
20
The standard error of the estimate of a multiple regression model is computed by taking the square root of the mean squares of error.
فتح الحزمة
افتح القفل للوصول البطاقات البالغ عددها 86 في هذه المجموعة.
فتح الحزمة
k this deck
21
A human resources analyst is developing a regression model to predict electricity production plant manager compensation as a function of production capacity of the plant,number of employees at the plant,and plant technology (coal,oil,and nuclear).The "plant technology" variable in this model is ______.
A)a response variable
B)a dependent variable
C)a quantitative variable
D)an independent variable
E)a constant
A)a response variable
B)a dependent variable
C)a quantitative variable
D)an independent variable
E)a constant
فتح الحزمة
افتح القفل للوصول البطاقات البالغ عددها 86 في هذه المجموعة.
فتح الحزمة
k this deck
22
A human resources analyst is developing a regression model to predict electricity production plant manager compensation as a function of production capacity of the plant,number of employees at the plant,and plant technology (coal,oil,and nuclear).The response variable in this model is ______.
A)plant manager compensation
B)plant capacity
C)number of employees
D)plant technology
E)nuclear
A)plant manager compensation
B)plant capacity
C)number of employees
D)plant technology
E)nuclear
فتح الحزمة
افتح القفل للوصول البطاقات البالغ عددها 86 في هذه المجموعة.
فتح الحزمة
k this deck
23
A market analyst is developing a regression model to predict monthly household expenditures on groceries as a function of family size,household income,and household neighborhood (urban,suburban,and rural).The "income" variable in this model is ____.
A)an indicator variable
B)a response variable
C)a qualitative variable
D)a dependent variable
E)an independent variable
A)an indicator variable
B)a response variable
C)a qualitative variable
D)a dependent variable
E)an independent variable
فتح الحزمة
افتح القفل للوصول البطاقات البالغ عددها 86 في هذه المجموعة.
فتح الحزمة
k this deck
24
A cost accountant is developing a regression model to predict the total cost of producing a batch of printed circuit boards as a linear function of batch size (the number of boards produced in one lot or batch),production plant (Kingsland,and Yorktown),and production shift (day,and evening).The response variable in this model is ______.
A)batch size
B)production shift
C)production plant
D)total cost
E)variable cost
A)batch size
B)production shift
C)production plant
D)total cost
E)variable cost
فتح الحزمة
افتح القفل للوصول البطاقات البالغ عددها 86 في هذه المجموعة.
فتح الحزمة
k this deck
25
The value of R2 always goes up when a nontrivial explanatory variable is added to a regression model.
فتح الحزمة
افتح القفل للوصول البطاقات البالغ عددها 86 في هذه المجموعة.
فتح الحزمة
k this deck
26
A human resources analyst is developing a regression model to predict electricity production plant manager compensation as a function of production capacity of the plant,number of employees at the plant,and plant technology (coal,oil,and nuclear).The "number of employees at the plant" variable in this model is ______.
A)a qualitative variable
B)a dependent variable
C)a response variable
D)an indicator variable
E)an independent variable
A)a qualitative variable
B)a dependent variable
C)a response variable
D)an indicator variable
E)an independent variable
فتح الحزمة
افتح القفل للوصول البطاقات البالغ عددها 86 في هذه المجموعة.
فتح الحزمة
k this deck
27
Minitab and Excel output for a multiple regression model show the t tests for the regression coefficients but do not provide a t test for the regression constant.
فتح الحزمة
افتح القفل للوصول البطاقات البالغ عددها 86 في هذه المجموعة.
فتح الحزمة
k this deck
28
A cost accountant is developing a regression model to predict the total cost of producing a batch of printed circuit boards as a linear function of batch size (the number of boards produced in one lot or batch),production plant (Kingsland,and Yorktown),and production shift (day,and evening).In this model,"batch size" is ______.
A)a response variable
B)an indicator variable
C)a dependent variable
D)a qualitative variable
E)an independent variable
A)a response variable
B)an indicator variable
C)a dependent variable
D)a qualitative variable
E)an independent variable
فتح الحزمة
افتح القفل للوصول البطاقات البالغ عددها 86 في هذه المجموعة.
فتح الحزمة
k this deck
29
A market analyst is developing a regression model to predict monthly household expenditures on groceries as a function of family size,household income,and household neighborhood (urban,suburban,and rural).The "neighborhood" variable in this model is ______.
A)an independent variable
B)a response variable
C)a quantitative variable
D)a dependent variable
E)a constant
A)an independent variable
B)a response variable
C)a quantitative variable
D)a dependent variable
E)a constant
فتح الحزمة
افتح القفل للوصول البطاقات البالغ عددها 86 في هذه المجموعة.
فتح الحزمة
k this deck
30
The multiple regression formulas used to estimate the regression coefficients are designed to ________________.
A)minimize the total sum of squares (SST)
B)minimize the sum of squares of error (SSE)
C)maximize the standard error of the estimate
D)maximize the p-value for the calculated F value
E)minimize the mean error
A)minimize the total sum of squares (SST)
B)minimize the sum of squares of error (SSE)
C)maximize the standard error of the estimate
D)maximize the p-value for the calculated F value
E)minimize the mean error
فتح الحزمة
افتح القفل للوصول البطاقات البالغ عددها 86 في هذه المجموعة.
فتح الحزمة
k this deck
31
A multiple regression analysis produced the following tables. The regression equation for this analysis is ____________.
A)y = 1959.71 + 0.46 x1 + 2.16 x2
B)y = 1959.71 - 0.46 x1 + 2.16 x2
C)y = 1959.71 - 0.46 x1 - 2.16 x2
D)y =1959.71 + 0.46 x1 - 2.16 x2
E)y =- 0.46 x1 - 2.16 x2
The regression equation for this analysis is ____________.A)y = 1959.71 + 0.46 x1 + 2.16 x2
B)y = 1959.71 - 0.46 x1 + 2.16 x2
C)y = 1959.71 - 0.46 x1 - 2.16 x2
D)y =1959.71 + 0.46 x1 - 2.16 x2
E)y =- 0.46 x1 - 2.16 x2
فتح الحزمة
افتح القفل للوصول البطاقات البالغ عددها 86 في هذه المجموعة.
فتح الحزمة
k this deck
32
A market analyst is developing a regression model to predict monthly household expenditures on groceries as a function of family size,household income,and household neighborhood (urban,suburban,and rural).The response variable in this model is _____.
A)family size
B)expenditures on groceries
C)household income
D)suburban
E)household neighborhood
A)family size
B)expenditures on groceries
C)household income
D)suburban
E)household neighborhood
فتح الحزمة
افتح القفل للوصول البطاقات البالغ عددها 86 في هذه المجموعة.
فتح الحزمة
k this deck
33
A multiple regression analysis produced the following tables. For x1= 360 and x2 = 220,the predicted value of y is ____________.
A)1314.70
B)1959.71
C)1077.58
D)2635.19
E)2265.57
For x1= 360 and x2 = 220,the predicted value of y is ____________.A)1314.70
B)1959.71
C)1077.58
D)2635.19
E)2265.57
فتح الحزمة
افتح القفل للوصول البطاقات البالغ عددها 86 في هذه المجموعة.
فتح الحزمة
k this deck
34
Minitab and Excel output for a multiple regression model show the F test for the overall model,but do not provide the t tests for the regression coefficients.
فتح الحزمة
افتح القفل للوصول البطاقات البالغ عددها 86 في هذه المجموعة.
فتح الحزمة
k this deck
35
A real estate appraiser is developing a regression model to predict the market value of single family residential houses as a function of heated area,number of bedrooms,number of bathrooms,age of the house,and central heating (yes,no).The response variable in this model is _______.
A)heated area
B)number of bedrooms
C)market value
D)central heating
E)residential houses
A)heated area
B)number of bedrooms
C)market value
D)central heating
E)residential houses
فتح الحزمة
افتح القفل للوصول البطاقات البالغ عددها 86 في هذه المجموعة.
فتح الحزمة
k this deck
36
A multiple regression analysis produced the following tables. The sample size for this analysis is ____________.
A)19
B)17
C)34
D)15
E)18
The sample size for this analysis is ____________.A)19
B)17
C)34
D)15
E)18
فتح الحزمة
افتح القفل للوصول البطاقات البالغ عددها 86 في هذه المجموعة.
فتح الحزمة
k this deck
37
A cost accountant is developing a regression model to predict the total cost of producing a batch of printed circuit boards as a linear function of batch size (the number of boards produced in one lot or batch),production plant (Kingsland,and Yorktown),and production shift (day,and evening).In this model,"shift" is ______.
A)a response variable
B)an independent variable
C)a quantitative variable
D)a dependent variable
E)a constant
A)a response variable
B)an independent variable
C)a quantitative variable
D)a dependent variable
E)a constant
فتح الحزمة
افتح القفل للوصول البطاقات البالغ عددها 86 في هذه المجموعة.
فتح الحزمة
k this deck
38
The value of adjusted R2 always goes up when a nontrivial explanatory variable is added to a regression model.
فتح الحزمة
افتح القفل للوصول البطاقات البالغ عددها 86 في هذه المجموعة.
فتح الحزمة
k this deck
39
A multiple regression analysis produced the following tables. The regression equation for this analysis is ____________.
A)y = 616.6849 + 3.33833 x1 + 1.780075 x2
B)y = 154.5535 - 1.43058 x1 + 5.30407 x2
C)y = 616.6849 - 3.33833 x1 - 1.780075 x2
D)y = 154.5535 + 2.333548 x1 + 0.335605 x2
E)y = 616.6849 - 3.33833 x1 + 1.780075 x2
The regression equation for this analysis is ____________.A)y = 616.6849 + 3.33833 x1 + 1.780075 x2
B)y = 154.5535 - 1.43058 x1 + 5.30407 x2
C)y = 616.6849 - 3.33833 x1 - 1.780075 x2
D)y = 154.5535 + 2.333548 x1 + 0.335605 x2
E)y = 616.6849 - 3.33833 x1 + 1.780075 x2
فتح الحزمة
افتح القفل للوصول البطاقات البالغ عددها 86 في هذه المجموعة.
فتح الحزمة
k this deck
40
A real estate appraiser is developing a regression model to predict the market value of single family residential houses as a function of heated area,number of bedrooms,number of bathrooms,age of the house,and central heating (yes,no).The "central heating" variable in this model is _______.
A)a response variable
B)an independent variable
C)a quantitative variable
D)a dependent variable
E)a constant
A)a response variable
B)an independent variable
C)a quantitative variable
D)a dependent variable
E)a constant
فتح الحزمة
افتح القفل للوصول البطاقات البالغ عددها 86 في هذه المجموعة.
فتح الحزمة
k this deck
41
The following ANOVA table is from a multiple regression analysis with n = 35 and four independent variables. The MSE value is __________.
A)8.57
B)8.82
C)10.00
D)75.00
E)20.00
The MSE value is __________.A)8.57
B)8.82
C)10.00
D)75.00
E)20.00
فتح الحزمة
افتح القفل للوصول البطاقات البالغ عددها 86 في هذه المجموعة.
فتح الحزمة
k this deck
42
In regression analysis,outliers may be identified by examining the ________.
A)coefficient of determination
B)coefficient of correlation
C)p-values for the partial coefficients
D)residuals
E)R-squared value
A)coefficient of determination
B)coefficient of correlation
C)p-values for the partial coefficients
D)residuals
E)R-squared value
فتح الحزمة
افتح القفل للوصول البطاقات البالغ عددها 86 في هذه المجموعة.
فتح الحزمة
k this deck
43
A multiple regression analysis produced the following tables. These results indicate that ____________.
A)none of the predictor variables are significant at the 5% level
B)each predictor variable is significant at the 5% level
C)x1 is significant at the 5% level
D)x2 is significant at the 5% level
E)the intercept is not significant at 5% level
These results indicate that ____________.A)none of the predictor variables are significant at the 5% level
B)each predictor variable is significant at the 5% level
C)x1 is significant at the 5% level
D)x2 is significant at the 5% level
E)the intercept is not significant at 5% level
فتح الحزمة
افتح القفل للوصول البطاقات البالغ عددها 86 في هذه المجموعة.
فتح الحزمة
k this deck
44
The following ANOVA table is from a multiple regression analysis with n = 35 and four independent variables. The number of degrees of freedom for error is __________.
A)1
B)4
C)34
D)30
E)35
The number of degrees of freedom for error is __________.A)1
B)4
C)34
D)30
E)35
فتح الحزمة
افتح القفل للوصول البطاقات البالغ عددها 86 في هذه المجموعة.
فتح الحزمة
k this deck
45
A multiple regression analysis produced the following tables.
Using = 0.05 to test the null hypothesis H0: 1 = 0,the correct decision is ____.
A)fail to reject the null hypothesis
B)reject the null hypothesis
C)fail to reject the alternative hypothesis
D)reject the alternative hypothesis
E)there is not enought information provided to make a decision
Using = 0.05 to test the null hypothesis H0: 1 = 0,the correct decision is ____.
A)fail to reject the null hypothesis
B)reject the null hypothesis
C)fail to reject the alternative hypothesis
D)reject the alternative hypothesis
E)there is not enought information provided to make a decision
فتح الحزمة
افتح القفل للوصول البطاقات البالغ عددها 86 في هذه المجموعة.
فتح الحزمة
k this deck
46
A multiple regression analysis produced the following tables.
Using = 0.05 to test the null hypothesis H0: 1 = 0,the critical t value is ____.
A)± 1.753
B)± 2.110
C)± 2.131
D)± 1.740
E)± 2.500
Using = 0.05 to test the null hypothesis H0: 1 = 0,the critical t value is ____.
A)± 1.753
B)± 2.110
C)± 2.131
D)± 1.740
E)± 2.500
فتح الحزمة
افتح القفل للوصول البطاقات البالغ عددها 86 في هذه المجموعة.
فتح الحزمة
k this deck
47
The following ANOVA table is from a multiple regression analysis with n = 35 and four independent variables. The adjusted R2 value is __________.
A)0.80
B)0.70
C)0.66
D)0.76
E)0.30
The adjusted R2 value is __________.A)0.80
B)0.70
C)0.66
D)0.76
E)0.30
فتح الحزمة
افتح القفل للوصول البطاقات البالغ عددها 86 في هذه المجموعة.
فتح الحزمة
k this deck
48
A multiple regression analysis produced the following tables.
Using = 0.10 to test the null hypothesis H0: 2 = 0,the critical t value is ____.
A)±1.345
B)±1.356
C)±1.761
D)±2.782
E)±1.782
Using = 0.10 to test the null hypothesis H0: 2 = 0,the critical t value is ____.
A)±1.345
B)±1.356
C)±1.761
D)±2.782
E)±1.782
فتح الحزمة
افتح القفل للوصول البطاقات البالغ عددها 86 في هذه المجموعة.
فتح الحزمة
k this deck
49
A multiple regression analysis produced the following tables. These results indicate that ____________.
A)none of the predictor variables are significant at the 5% level
B)each predictor variable is significant at the 5% level
C)x1 is the only predictor variable significant at the 5% level
D)x2 is the only predictor variable significant at the 5% level
E)the intercept is not significant at the 5% level
These results indicate that ____________.A)none of the predictor variables are significant at the 5% level
B)each predictor variable is significant at the 5% level
C)x1 is the only predictor variable significant at the 5% level
D)x2 is the only predictor variable significant at the 5% level
E)the intercept is not significant at the 5% level
فتح الحزمة
افتح القفل للوصول البطاقات البالغ عددها 86 في هذه المجموعة.
فتح الحزمة
k this deck
50
A multiple regression analysis produced the following tables. These results indicate that ____________.
A)none of the predictor variables are significant at the 10% level
B)each predictor variable is significant at the 10% level
C)x1 is significant at the 10% level
D)x2 is significant at the 10% level
E)the intercept is not significant at 10% level
These results indicate that ____________.A)none of the predictor variables are significant at the 10% level
B)each predictor variable is significant at the 10% level
C)x1 is significant at the 10% level
D)x2 is significant at the 10% level
E)the intercept is not significant at 10% level
فتح الحزمة
افتح القفل للوصول البطاقات البالغ عددها 86 في هذه المجموعة.
فتح الحزمة
k this deck
51
The following ANOVA table is from a multiple regression analysis with n = 35 and four independent variables. The observed F value is __________.
A)17.50
B)2.33
C)0.70
D)0.43
E)0.50
The observed F value is __________.A)17.50
B)2.33
C)0.70
D)0.43
E)0.50
فتح الحزمة
افتح القفل للوصول البطاقات البالغ عددها 86 في هذه المجموعة.
فتح الحزمة
k this deck
52
A multiple regression analysis produced the following tables. The sample size for this analysis is ____________.
A)12
B)15
C)17
D)18
E)24
The sample size for this analysis is ____________.A)12
B)15
C)17
D)18
E)24
فتح الحزمة
افتح القفل للوصول البطاقات البالغ عددها 86 في هذه المجموعة.
فتح الحزمة
k this deck
53
The following ANOVA table is from a multiple regression analysis with n = 35 and four independent variables. The R2 value is __________.
A)0.80
B)0.70
C)0.66
D)0.76
E)0.30
The R2 value is __________.A)0.80
B)0.70
C)0.66
D)0.76
E)0.30
فتح الحزمة
افتح القفل للوصول البطاقات البالغ عددها 86 في هذه المجموعة.
فتح الحزمة
k this deck
54
The following ANOVA table is from a multiple regression analysis with n = 35 and four independent variables. The value of the standard error of the estimate se is __________.
A)13.23
B)3.16
C)17.32
D)26.46
E)10.00
The value of the standard error of the estimate se is __________.A)13.23
B)3.16
C)17.32
D)26.46
E)10.00
فتح الحزمة
افتح القفل للوصول البطاقات البالغ عددها 86 في هذه المجموعة.
فتح الحزمة
k this deck
55
The following ANOVA table is from a multiple regression analysis with n = 35 and four independent variables. The number of degrees of freedom for regression is __________.
A)1
B)4
C)34
D)30
E)35
The number of degrees of freedom for regression is __________.A)1
B)4
C)34
D)30
E)35
فتح الحزمة
افتح القفل للوصول البطاقات البالغ عددها 86 في هذه المجموعة.
فتح الحزمة
k this deck
56
A multiple regression analysis produced the following tables.
Using = 0.01 to test the null hypothesis H0: 1 = 2 = 0,the critical F value is ____.
A)8.68
B)6.36
C)8.40
D)6.11
E)3.36
Using = 0.01 to test the null hypothesis H0: 1 = 2 = 0,the critical F value is ____.
A)8.68
B)6.36
C)8.40
D)6.11
E)3.36
فتح الحزمة
افتح القفل للوصول البطاقات البالغ عددها 86 في هذه المجموعة.
فتح الحزمة
k this deck
57
A multiple regression analysis produced the following tables.
Using = 0.05 to test the null hypothesis H0: 2 = 0,the correct decision is ____.
A)fail to reject the null hypothesis
B)reject the null hypothesis
C)fail to reject the alternative hypothesis
D)reject the alternative hypothesis
E)there is not enought information provided to make a decision
Using = 0.05 to test the null hypothesis H0: 2 = 0,the correct decision is ____.
A)fail to reject the null hypothesis
B)reject the null hypothesis
C)fail to reject the alternative hypothesis
D)reject the alternative hypothesis
E)there is not enought information provided to make a decision
فتح الحزمة
افتح القفل للوصول البطاقات البالغ عددها 86 في هذه المجموعة.
فتح الحزمة
k this deck
58
A multiple regression analysis produced the following tables.
Using = 0.05 to test the null hypothesis H0: 1 = 2 = 0,the critical F value is ____.
A)3.74
B)3.89
C)4.75
D)4.60
E)2.74
Using = 0.05 to test the null hypothesis H0: 1 = 2 = 0,the critical F value is ____.
A)3.74
B)3.89
C)4.75
D)4.60
E)2.74
فتح الحزمة
افتح القفل للوصول البطاقات البالغ عددها 86 في هذه المجموعة.
فتح الحزمة
k this deck
59
A multiple regression analysis produced the following tables.
Using = 0.01 to test the model,these results indicate that ____________.
A)at least one of the regression variables is a significant predictor of y
B)none of the regression variables are significant predictors of y
C)y cannot be sufficiently predicted using these data
D)y is a good predictor of the regression variables in the model
E)the y intercept in this model is the best predictor variable
فتح الحزمة
افتح القفل للوصول البطاقات البالغ عددها 86 في هذه المجموعة.
فتح الحزمة
k this deck
60
The following ANOVA table is from a multiple regression analysis with n = 35 and four independent variables. The MSR value is __________.
A)700.00
B)350.00
C)233.33
D)175.00
E)275.00
The MSR value is __________.A)700.00
B)350.00
C)233.33
D)175.00
E)275.00
فتح الحزمة
افتح القفل للوصول البطاقات البالغ عددها 86 في هذه المجموعة.
فتح الحزمة
k this deck
61
The following ANOVA table is from a multiple regression analysis. The MSE value is __________.
A)31
B)500
C)16
D)2300
E)8.7
The MSE value is __________.A)31
B)500
C)16
D)2300
E)8.7
فتح الحزمة
افتح القفل للوصول البطاقات البالغ عددها 86 في هذه المجموعة.
فتح الحزمة
k this deck
62
A multiple regression analysis produced the following tables.
Using = 0.01 to test the null hypothesis H0: 1 = 2 = 0,the critical F value is ____.
A)5.99
B)5.70
C)1.96
D)4.84
E)6.70
Using = 0.01 to test the null hypothesis H0: 1 = 2 = 0,the critical F value is ____.
A)5.99
B)5.70
C)1.96
D)4.84
E)6.70
فتح الحزمة
افتح القفل للوصول البطاقات البالغ عددها 86 في هذه المجموعة.
فتح الحزمة
k this deck
63
The following ANOVA table is from a multiple regression analysis. The R2 value is __________.
A)0.65
B)0.53
C)0.35
D)0.43
E)1.37
The R2 value is __________.A)0.65
B)0.53
C)0.35
D)0.43
E)1.37
فتح الحزمة
افتح القفل للوصول البطاقات البالغ عددها 86 في هذه المجموعة.
فتح الحزمة
k this deck
64
A multiple regression analysis produced the following tables. For x1= 30 and x2 = 100,the predicted value of y is ____________.
A)753.77
B)1,173.00
C)1,355.26
D)615.13
E)6153.13
For x1= 30 and x2 = 100,the predicted value of y is ____________.A)753.77
B)1,173.00
C)1,355.26
D)615.13
E)6153.13
فتح الحزمة
افتح القفل للوصول البطاقات البالغ عددها 86 في هذه المجموعة.
فتح الحزمة
k this deck
65
A multiple regression analysis produced the following tables. The coefficient of multiple determination is ____________.
A)0.2079
B)0.0860
C)0.5440
D)0.7921
E)0.5000
The coefficient of multiple determination is ____________.A)0.2079
B)0.0860
C)0.5440
D)0.7921
E)0.5000
فتح الحزمة
افتح القفل للوصول البطاقات البالغ عددها 86 في هذه المجموعة.
فتح الحزمة
k this deck
66
A multiple regression analysis produced the following tables.
Using = 0.01 to test the null hypothesis H0: 2 = 0,the critical t value is ____.
A)± 1.174
B)± 2.093
C)± 2.131
D)± 4.012
E)± 3.012
Using = 0.01 to test the null hypothesis H0: 2 = 0,the critical t value is ____.
A)± 1.174
B)± 2.093
C)± 2.131
D)± 4.012
E)± 3.012
فتح الحزمة
افتح القفل للوصول البطاقات البالغ عددها 86 في هذه المجموعة.
فتح الحزمة
k this deck
67
A multiple regression analysis produced the following tables. The regression equation for this analysis is ____________.
A)y = 302689 + 1153309 x1 + 1455998 x2
B)y = -139.609 + 24.24619 x1 + 32.10171 x2
C)y = 2548.989 + 22.25267 x1 + 17.44559 x2
D)y = -0.05477 + 1.089586 x1 + 1.840105 x2
E)y = 0.05477 + 1.089586 x1 + 1.840105 x2
The regression equation for this analysis is ____________.A)y = 302689 + 1153309 x1 + 1455998 x2
B)y = -139.609 + 24.24619 x1 + 32.10171 x2
C)y = 2548.989 + 22.25267 x1 + 17.44559 x2
D)y = -0.05477 + 1.089586 x1 + 1.840105 x2
E)y = 0.05477 + 1.089586 x1 + 1.840105 x2
فتح الحزمة
افتح القفل للوصول البطاقات البالغ عددها 86 في هذه المجموعة.
فتح الحزمة
k this deck
68
A multiple regression analysis produced the following tables. These results indicate that ____________.
A)none of the predictor variables are significant at the 5% level
B)each predictor variable is significant at the 5% level
C)x1 is the only predictor variable significant at the 5% level
D)x2 is the only predictor variable significant at the 5% level
E)the intercept is not significant at 5% level
These results indicate that ____________.A)none of the predictor variables are significant at the 5% level
B)each predictor variable is significant at the 5% level
C)x1 is the only predictor variable significant at the 5% level
D)x2 is the only predictor variable significant at the 5% level
E)the intercept is not significant at 5% level
فتح الحزمة
افتح القفل للوصول البطاقات البالغ عددها 86 في هذه المجموعة.
فتح الحزمة
k this deck
69
A multiple regression analysis produced the following tables. These results indicate that ____________.
A)none of the predictor variables are significant at the 5% level
B)each predictor variable is significant at the 5% level
C)x1 is the only predictor variable significant at the 5% level
D)x2 is the only predictor variable significant at the 5% level
E)all variables are significant at 5% level
These results indicate that ____________.A)none of the predictor variables are significant at the 5% level
B)each predictor variable is significant at the 5% level
C)x1 is the only predictor variable significant at the 5% level
D)x2 is the only predictor variable significant at the 5% level
E)all variables are significant at 5% level
فتح الحزمة
افتح القفل للوصول البطاقات البالغ عددها 86 في هذه المجموعة.
فتح الحزمة
k this deck
70
The following ANOVA table is from a multiple regression analysis. The sample size for the analysis is __________.
A)30
B)26
C)3
D)29
E)31
The sample size for the analysis is __________.A)30
B)26
C)3
D)29
E)31
فتح الحزمة
افتح القفل للوصول البطاقات البالغ عددها 86 في هذه المجموعة.
فتح الحزمة
k this deck
71
A multiple regression analysis produced the following tables. The coefficient of multiple determination is ____________.
A)0.0592
B)0.9138
C)0.1149
D)0.9559
E)1.0000
The coefficient of multiple determination is ____________.A)0.0592
B)0.9138
C)0.1149
D)0.9559
E)1.0000
فتح الحزمة
افتح القفل للوصول البطاقات البالغ عددها 86 في هذه المجموعة.
فتح الحزمة
k this deck
72
The following ANOVA table is from a multiple regression analysis. The value of the standard error of the estimate se is __________.
A)30.77
B)5.55
C)4.03
D)3.20
E)0.73
The value of the standard error of the estimate se is __________.A)30.77
B)5.55
C)4.03
D)3.20
E)0.73
فتح الحزمة
افتح القفل للوصول البطاقات البالغ عددها 86 في هذه المجموعة.
فتح الحزمة
k this deck
73
A multiple regression analysis produced the following tables. The sample size for this analysis is ____________.
A)17
B)13
C)16
D)11
E)15
The sample size for this analysis is ____________.A)17
B)13
C)16
D)11
E)15
فتح الحزمة
افتح القفل للوصول البطاقات البالغ عددها 86 في هذه المجموعة.
فتح الحزمة
k this deck
74
The following ANOVA table is from a multiple regression analysis. The adjusted R2 value is __________.
A)0.65
B)0.39
C)0.61
D)0.53
E)0.78
The adjusted R2 value is __________.A)0.65
B)0.39
C)0.61
D)0.53
E)0.78
فتح الحزمة
افتح القفل للوصول البطاقات البالغ عددها 86 في هذه المجموعة.
فتح الحزمة
k this deck
75
The following ANOVA table is from a multiple regression analysis. The observed F value is __________.
A)16.25
B)30.77
C)500
D)0.049
E)0.039
The observed F value is __________.A)16.25
B)30.77
C)500
D)0.049
E)0.039
فتح الحزمة
افتح القفل للوصول البطاقات البالغ عددها 86 في هذه المجموعة.
فتح الحزمة
k this deck
76
The following ANOVA table is from a multiple regression analysis. The SSE value is __________.
A)30
B)1500
C)500
D)800
E)2300
The SSE value is __________.A)30
B)1500
C)500
D)800
E)2300
فتح الحزمة
افتح القفل للوصول البطاقات البالغ عددها 86 في هذه المجموعة.
فتح الحزمة
k this deck
77
A multiple regression analysis produced the following tables. The adjusted R2 is ____________.
A)0.9138
B)0.9408
C)0.8981
D)0.8851
E)0.8891
The adjusted R2 is ____________.A)0.9138
B)0.9408
C)0.8981
D)0.8851
E)0.8891
فتح الحزمة
افتح القفل للوصول البطاقات البالغ عددها 86 في هذه المجموعة.
فتح الحزمة
k this deck
78
A multiple regression analysis produced the following tables. For x1= 40 and x2 = 90,the predicted value of y is ____________.
A)753.77
B)1,173.00
C)1,355.26
D)3,719.39
E)1,565.75
For x1= 40 and x2 = 90,the predicted value of y is ____________.A)753.77
B)1,173.00
C)1,355.26
D)3,719.39
E)1,565.75
فتح الحزمة
افتح القفل للوصول البطاقات البالغ عددها 86 في هذه المجموعة.
فتح الحزمة
k this deck
79
The following ANOVA table is from a multiple regression analysis. The number of independent variables in the analysis is __________.
A)30
B)26
C)1
D)3
E)2
The number of independent variables in the analysis is __________.A)30
B)26
C)1
D)3
E)2
فتح الحزمة
افتح القفل للوصول البطاقات البالغ عددها 86 في هذه المجموعة.
فتح الحزمة
k this deck
80
The following ANOVA table is from a multiple regression analysis. The MSR value is __________.
A)1500
B)50
C)2300
D)500
E)31
The MSR value is __________.A)1500
B)50
C)2300
D)500
E)31
فتح الحزمة
افتح القفل للوصول البطاقات البالغ عددها 86 في هذه المجموعة.
فتح الحزمة
k this deck
فتح الحزمة
افتح القفل للوصول البطاقات البالغ عددها 86 في هذه المجموعة.


