Deck 18: Statistical Quality Control
ملء الشاشة (f)
سؤال
سؤال
سؤال
سؤال
سؤال
سؤال
سؤال
سؤال
سؤال
سؤال
سؤال
سؤال
سؤال
سؤال
سؤال
سؤال
سؤال
سؤال
سؤال
سؤال
سؤال
A graph that displays computed means for a series of small random samples over a period of time is called a(n)_______.
A) chart
chart
B)R chart
C)p chart
D)c chart
E)S chart
A)
chartB)R chart
C)p chart
D)c chart
E)S chart
سؤال
سؤال
سؤال
سؤال
سؤال
According to the following Pareto chart,the Pareto principle would suggest a quality improvement team focus their efforts on which of the following complaints?

A)user interface only
B)user interface and speaker quality
C)user interface,speaker quality and camera
D)speaker quality and camera
E)all of the complaints should be a focus
A)user interface only
B)user interface and speaker quality
C)user interface,speaker quality and camera
D)speaker quality and camera
E)all of the complaints should be a focus
سؤال
سؤال
سؤال
سؤال
سؤال
سؤال
سؤال
سؤال
سؤال
An  chart is being developed using 15 samples of size 9 each.The average of 15 sample means is 6.20.The average of the 15 ranges is 0.30.The upper control limit is _______________.
A)6.301
B)6.267
C)6.133
D)6.099
E)6.312
chart is being developed using 15 samples of size 9 each.The average of 15 sample means is 6.20.The average of the 15 ranges is 0.30.The upper control limit is _______________.A)6.301
B)6.267
C)6.133
D)6.099
E)6.312
سؤال
سؤال
According to the following Pareto chart,the most common complaint was ______. 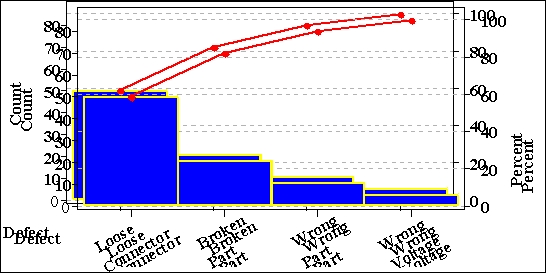

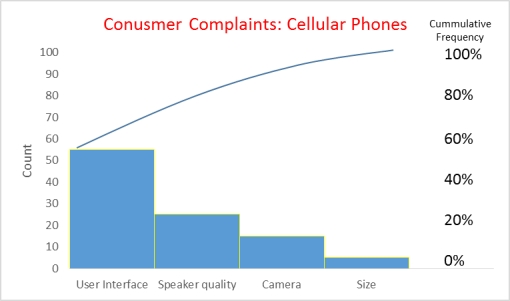
A)user interface
B)speaker quality
C)camera
D)size
E)all of the above
A)user interface
B)speaker quality
C)camera
D)size
E)all of the above
سؤال
سؤال
A plot of the sample ranges over regular time intervals is called a(n)_______.
A) chart
chart
B)R chart
C)p chart
D)c chart
E)S chart
A)
chartB)R chart
C)p chart
D)c chart
E)S chart
سؤال
An  chart is being developed using 15 samples of size 9 each.The average of 15 sample means is 6.20.The average of the 15 ranges is 0.30.The lower control limit is _______________.
A)6.301
B)6.267
C)6.133
D)6.099
E)6.312
chart is being developed using 15 samples of size 9 each.The average of 15 sample means is 6.20.The average of the 15 ranges is 0.30.The lower control limit is _______________.A)6.301
B)6.267
C)6.133
D)6.099
E)6.312
سؤال
سؤال
سؤال
سؤال
سؤال
سؤال
Sarah Soliz,Director of Quality Programs,is designing  and R charts for the rod shearing process at Stockton Steel.She has 26 samples of rod length,and each sample included measurements of 5 rods.The mean of the 26 sample means is 112 inches,and mean of the 26 ranges is 0.15 inch.The centerline for her R chart is ____.
A)0.15
B)26
C)5
D)112
E)15
and R charts for the rod shearing process at Stockton Steel.She has 26 samples of rod length,and each sample included measurements of 5 rods.The mean of the 26 sample means is 112 inches,and mean of the 26 ranges is 0.15 inch.The centerline for her R chart is ____.A)0.15
B)26
C)5
D)112
E)15
سؤال
Sarah Soliz,Director of Quality Programs,is designing  and R charts for the rod shearing process at Stockton Steel.She has 26 samples of rod length,and each sample included measurements of 5 rods.The mean of the 26 sample means is 112 inches,and mean of the 26 ranges is 0.15 inch.The lower control limit for her
  chart is ____.
A)25.913
B)4.913
C)111.91
D)108.10
E)112.84
and R charts for the rod shearing process at Stockton Steel.She has 26 samples of rod length,and each sample included measurements of 5 rods.The mean of the 26 sample means is 112 inches,and mean of the 26 ranges is 0.15 inch.The lower control limit for her chart is ____.A)25.913
B)4.913
C)111.91
D)108.10
E)112.84
سؤال
سؤال
Sarah Soliz,Director of Quality Programs,is designing  and R charts for the rod shearing process at Stockton Steel.She has 26 samples of rod length,and each sample included measurements of 5 rods.The mean of the 26 sample means is 112 inches,and mean of the 26 ranges is 0.15 inch.The upper control limit for her
  chart is ________.
A)112.09
B)5.087
C)26.087
D)115.90
E)110.09
and R charts for the rod shearing process at Stockton Steel.She has 26 samples of rod length,and each sample included measurements of 5 rods.The mean of the 26 sample means is 112 inches,and mean of the 26 ranges is 0.15 inch.The upper control limit for her chart is ________.A)112.09
B)5.087
C)26.087
D)115.90
E)110.09
سؤال
سؤال
سؤال
Sarah Soliz,Director of Quality Programs,is designing  and R charts for the rod shearing process at Stockton Steel.She has 26 samples of rod length,and each sample included measurements of 5 rods.The mean of the 26 sample means is 112 inches,and mean of the 26 ranges is 0.15 inch.The upper control limit for her R chart is ____.
A)0.150
B)10.57
C)0.317
D)2.114
E)0.713
and R charts for the rod shearing process at Stockton Steel.She has 26 samples of rod length,and each sample included measurements of 5 rods.The mean of the 26 sample means is 112 inches,and mean of the 26 ranges is 0.15 inch.The upper control limit for her R chart is ____.A)0.150
B)10.57
C)0.317
D)2.114
E)0.713
سؤال
سؤال
سؤال
A graph that plots the proportions of items in noncompliance for multiple samples is called a(n)_______.
A) chart
chart
B)R chart
C)p chart
D)c chart
E)Pareto chart
A)
chartB)R chart
C)p chart
D)c chart
E)Pareto chart
سؤال
Sarah Soliz,Director of Quality Programs,is designing  and R charts for the rod shearing process at Stockton Steel.She has 26 samples of rod length,and each sample included measurements of 5 rods.The mean of the 26 sample means is 112 inches,and mean of the 26 ranges is 0.15 inch.The centerline for her
  chart is _________.
A)5
B)26
C)0.15
D)11.2
E)112
and R charts for the rod shearing process at Stockton Steel.She has 26 samples of rod length,and each sample included measurements of 5 rods.The mean of the 26 sample means is 112 inches,and mean of the 26 ranges is 0.15 inch.The centerline for her chart is _________.A)5
B)26
C)0.15
D)11.2
E)112
سؤال
Sarah Soliz,Director of Quality Programs,is designing  and R charts for the rod shearing process at Stockton Steel.She has 26 samples of rod length,and each sample included measurements of 5 rods.The mean of the 26 sample means is 112 inches,and mean of the 26 ranges is 0.15 inch.The lower control limit for her R chart is ____.
A)0.150
B)0.000
C)0.317
D)2.114
E)1.000
and R charts for the rod shearing process at Stockton Steel.She has 26 samples of rod length,and each sample included measurements of 5 rods.The mean of the 26 sample means is 112 inches,and mean of the 26 ranges is 0.15 inch.The lower control limit for her R chart is ____.A)0.150
B)0.000
C)0.317
D)2.114
E)1.000
سؤال
سؤال
A graph that plots the number of nonconformances per item for multiple samples is called a(n)_______.
A) chart
chart
B)R chart
C)p chart
D)c chart
E)Pareto chart
A)
chartB)R chart
C)p chart
D)c chart
E)Pareto chart
سؤال
سؤال
سؤال
سؤال
سؤال
سؤال
سؤال
سؤال
سؤال
You are conducting a study on the blood glucose levels of 9 patients who are on strict diets and exercise routines.To monitor the mean and range of the blood glucose levels of your patients,you take a blood glucose reading every day for each patient for 20 days.The mean of the 9 sample means is 101.03,and the mean of the 9 standard deviations is 29.243.The lower control limit for your  chart is ________.
A)70.85
B)92.11
C)73
D)71.75
E)60.5
chart is ________.A)70.85
B)92.11
C)73
D)71.75
E)60.5

فتح الحزمة
قم بالتسجيل لفتح البطاقات في هذه المجموعة!
Unlock Deck
Unlock Deck
1/68
العب
ملء الشاشة (f)
Deck 18: Statistical Quality Control
1
Control charts are used to examine the output of a process for disturbing patterns or for data points that indicate that the process is out of control.
True
2
Quality control is the collection of strategies,techniques,and actions taken by an organization to assure itself that it is producing a quality product.
True
3
A c chart used for statistical quality control is a chart that shows the count of defects in the process output.
True
4
Inspecting the attributes of a finished product to determine whether the product is acceptable,is in need of rework,or is to be rejected is called after-process quality control.
فتح الحزمة
افتح القفل للوصول البطاقات البالغ عددها 68 في هذه المجموعة.
فتح الحزمة
k this deck
5
A schematic representation of all the activities and interactions that occur in a process is called a flowchart.
فتح الحزمة
افتح القفل للوصول البطاقات البالغ عددها 68 في هذه المجموعة.
فتح الحزمة
k this deck
6
Two general types of control charts are (1)control charts for manufactured items and (2)control charts for services.
فتح الحزمة
افتح القفل للوصول البطاقات البالغ عددها 68 في هذه المجموعة.
فتح الحزمة
k this deck
7
The term Total Quality Management (TQM)was coined by the well-known quality guru,Edward Deming.
فتح الحزمة
افتح القفل للوصول البطاقات البالغ عددها 68 في هذه المجموعة.
فتح الحزمة
k this deck
8
The Six Sigma approach essentially calls for the process to approach defect-free status.
فتح الحزمة
افتح القفل للوصول البطاقات البالغ عددها 68 في هذه المجموعة.
فتح الحزمة
k this deck
9
A control chart is used to control the flow of materials into a process.
فتح الحزمة
افتح القفل للوصول البطاقات البالغ عددها 68 في هذه المجموعة.
فتح الحزمة
k this deck
10
Two general types of control charts are (1)control charts for measurements and (2)control charts for compliance items.
فتح الحزمة
افتح القفل للوصول البطاقات البالغ عددها 68 في هذه المجموعة.
فتح الحزمة
k this deck
11
A scatter diagram is a graphical mechanism for examining the relationship between two variables.
فتح الحزمة
افتح القفل للوصول البطاقات البالغ عددها 68 في هذه المجموعة.
فتح الحزمة
k this deck
12
A Pareto chart is a diagnostic tool that displays possible causes of a quality problem and the interrelationships among the causes.
فتح الحزمة
افتح القفل للوصول البطاقات البالغ عددها 68 في هذه المجموعة.
فتح الحزمة
k this deck
13
Six Sigma is a methodology for quality and does not relate to a measurement value of the process.
فتح الحزمة
افتح القفل للوصول البطاقات البالغ عددها 68 في هذه المجموعة.
فتح الحزمة
k this deck
14
One definition that captures the spirit of most quality efforts in the business world is that quality results when a product delivers what is stipulated for it in its specifications.
فتح الحزمة
افتح القفل للوصول البطاقات البالغ عددها 68 في هذه المجموعة.
فتح الحزمة
k this deck
15
Measuring product attributes at regular intervals throughout the manufacturing process in an effort to pinpoint problem areas is called in-process quality control.
فتح الحزمة
افتح القفل للوصول البطاقات البالغ عددها 68 في هذه المجموعة.
فتح الحزمة
k this deck
16
If a process is in control,less than 0.3% of all the points that represent the process output such as the average measurement or the proportion defective should be beyond the upper and lower control limits.
فتح الحزمة
افتح القفل للوصول البطاقات البالغ عددها 68 في هذه المجموعة.
فتح الحزمة
k this deck
17
A quality circle is a round-table of top-level quality managers.
فتح الحزمة
افتح القفل للوصول البطاقات البالغ عددها 68 في هذه المجموعة.
فتح الحزمة
k this deck
18
Edward Deming is a quality guru whose principles of quality management can be summarized through four basic tenets,or "Absolutes".
فتح الحزمة
افتح القفل للوصول البطاقات البالغ عددها 68 في هذه المجموعة.
فتح الحزمة
k this deck
19
Quality control can be undertaken in two distinct ways: after-process control and before-process control.
فتح الحزمة
افتح القفل للوصول البطاقات البالغ عددها 68 في هذه المجموعة.
فتح الحزمة
k this deck
20
If no variation occurred between manufactured items,the resulting points on a control chart would form a horizontal line.
فتح الحزمة
افتح القفل للوصول البطاقات البالغ عددها 68 في هذه المجموعة.
فتح الحزمة
k this deck
21
A graph that displays computed means for a series of small random samples over a period of time is called a(n)_______.
A) chart
B)R chart
C)p chart
D)c chart
E)S chart
A)
chartB)R chart
C)p chart
D)c chart
E)S chart
فتح الحزمة
افتح القفل للوصول البطاقات البالغ عددها 68 في هذه المجموعة.
فتح الحزمة
k this deck
22
Upper and lower control limits are usually based upon _______.
A)± 3 standard deviations
B)± 2 standard deviations
C)± 1 standard deviation
D)± 4 standard deviations
E)± 6 standard deviations
A)± 3 standard deviations
B)± 2 standard deviations
C)± 1 standard deviation
D)± 4 standard deviations
E)± 6 standard deviations
فتح الحزمة
افتح القفل للوصول البطاقات البالغ عددها 68 في هذه المجموعة.
فتح الحزمة
k this deck
23
A recognized brand name product means higher quality to many consumers.Among Garvin's five quality types,this is an example of ___________________.
A)user quality
B)transcendent quality
C)product quality
D)manufacturing-based quality
E)value quality
A)user quality
B)transcendent quality
C)product quality
D)manufacturing-based quality
E)value quality
فتح الحزمة
افتح القفل للوصول البطاقات البالغ عددها 68 في هذه المجموعة.
فتح الحزمة
k this deck
24
Failure Mode Effect Analysis is best described as _________.
A).a quality scheme for building a failure free product or process.
B).a descriptive tool for analyzing measurement data and identifying failures.
C).a new approach to identifying potential failures.
D).a methodology for identifying the potential negative outcomes related to the failure of a specific product or process.
E.an approach to business making which minimizes failures through quality circles
فتح الحزمة
افتح القفل للوصول البطاقات البالغ عددها 68 في هذه المجموعة.
فتح الحزمة
k this deck
25
According to Garvin,product quality is ____________________.
A)value perceived by the customer
B)an innate excellence of the product
C)not measurable in the product
D)fitness for the consumer's intended use
E)measurable in the product
A)value perceived by the customer
B)an innate excellence of the product
C)not measurable in the product
D)fitness for the consumer's intended use
E)measurable in the product
فتح الحزمة
افتح القفل للوصول البطاقات البالغ عددها 68 في هذه المجموعة.
فتح الحزمة
k this deck
26
According to the following Pareto chart,the Pareto principle would suggest a quality improvement team focus their efforts on which of the following complaints?
A)user interface only
B)user interface and speaker quality
C)user interface,speaker quality and camera
D)speaker quality and camera
E)all of the complaints should be a focus
A)user interface only
B)user interface and speaker quality
C)user interface,speaker quality and camera
D)speaker quality and camera
E)all of the complaints should be a focus
فتح الحزمة
افتح القفل للوصول البطاقات البالغ عددها 68 في هذه المجموعة.
فتح الحزمة
k this deck
27
Which of the following statements best describes Design for Six Sigma?
A)A process for designing a quality improvement team.
B)The measure and improve steps of a six sigma initiative.
C)A framework for implementing Deming's 14 points.
D)A root cause analysis using 100% inspection.
E)A quality scheme that emphasizes designing the product or process to perform defect-free.
فتح الحزمة
افتح القفل للوصول البطاقات البالغ عددها 68 في هذه المجموعة.
فتح الحزمة
k this deck
28
According to Garvin,transcendent quality implies that a product __________.
A)conforms to design and engineering specifications
B)has an innate excellence
C)has no measurable attributes
D)is fit for the consumer's intended use
E)has measurable attributes
A)conforms to design and engineering specifications
B)has an innate excellence
C)has no measurable attributes
D)is fit for the consumer's intended use
E)has measurable attributes
فتح الحزمة
افتح القفل للوصول البطاقات البالغ عددها 68 في هذه المجموعة.
فتح الحزمة
k this deck
29
An advantage of a just-in-time inventory system is _________.
A)fewer managerial controls on inventory
B)lower inventory holding costs
C)larger shipment and production lots
D)fewer orders per operational year
E)more inspection and handling of materials
A)fewer managerial controls on inventory
B)lower inventory holding costs
C)larger shipment and production lots
D)fewer orders per operational year
E)more inspection and handling of materials
فتح الحزمة
افتح القفل للوصول البطاقات البالغ عددها 68 في هذه المجموعة.
فتح الحزمة
k this deck
30
A quality circle studying the problem of incorrect prices on purchase orders identified several potential causes: incorrect information from requesting department,out-of-date catalogs from suppliers,defective computer software,and worker practices in the purchasing department.These potential cause-and-effect relationships are best illustrated by a _______________.
A)check list
B)Pareto chart
C)control chart
D)point-and-figure chart
E)Fishbone diagram
A)check list
B)Pareto chart
C)control chart
D)point-and-figure chart
E)Fishbone diagram
فتح الحزمة
افتح القفل للوصول البطاقات البالغ عددها 68 في هذه المجموعة.
فتح الحزمة
k this deck
31
Higher output wattage means higher quality to some consumers of audio amplifiers.Among Garvin's five quality types,this is an example of ______________.
A)user quality
B)transcendent quality
C)product quality
D)manufacturing-based quality
E)value quality
A)user quality
B)transcendent quality
C)product quality
D)manufacturing-based quality
E)value quality
فتح الحزمة
افتح القفل للوصول البطاقات البالغ عددها 68 في هذه المجموعة.
فتح الحزمة
k this deck
32
An R Chart is to be developed for use in quality control.The average of the ranges is calculated to be 0.45.The sample sizes were 9 each.What would the upper control limit be?
A)0.8172
B)0.6012
C)0.0828
D)0.1566
E)0.7434
A)0.8172
B)0.6012
C)0.0828
D)0.1566
E)0.7434
فتح الحزمة
افتح القفل للوصول البطاقات البالغ عددها 68 في هذه المجموعة.
فتح الحزمة
k this deck
33
A company that uses benchmarking as a quality improvement practice will ________.
A)emulate the best practices and techniques used in their industry
B)institutionalize the not-invented-here philosophy
C)not analyze the competition's product
D)rely exclusively on government research for product improvements
E)be in the furniture business
A)emulate the best practices and techniques used in their industry
B)institutionalize the not-invented-here philosophy
C)not analyze the competition's product
D)rely exclusively on government research for product improvements
E)be in the furniture business
فتح الحزمة
افتح القفل للوصول البطاقات البالغ عددها 68 في هذه المجموعة.
فتح الحزمة
k this deck
34
An R Chart is to be developed for use in quality control.The average of the ranges is calculated to be 0.45.The sample sizes were 9 each.What would the lower control limit be?
A)0.8172
B)0.6012
C)0.0828
D)0.1566
E)0.7434
A)0.8172
B)0.6012
C)0.0828
D)0.1566
E)0.7434
فتح الحزمة
افتح القفل للوصول البطاقات البالغ عددها 68 في هذه المجموعة.
فتح الحزمة
k this deck
35
An chart is being developed using 15 samples of size 9 each.The average of 15 sample means is 6.20.The average of the 15 ranges is 0.30.The upper control limit is _______________.
A)6.301
B)6.267
C)6.133
D)6.099
E)6.312
chart is being developed using 15 samples of size 9 each.The average of 15 sample means is 6.20.The average of the 15 ranges is 0.30.The upper control limit is _______________.A)6.301
B)6.267
C)6.133
D)6.099
E)6.312
فتح الحزمة
افتح القفل للوصول البطاقات البالغ عددها 68 في هذه المجموعة.
فتح الحزمة
k this deck
36
A manufacturer of washing machines promotes lower water usage per load cycle when compared to the average brand.Among Garvin's five quality types,this is an example of ________.
A)user quality
B)transcendent quality
C)product quality
D)manufacturing-based quality
E)value quality
A)user quality
B)transcendent quality
C)product quality
D)manufacturing-based quality
E)value quality
فتح الحزمة
افتح القفل للوصول البطاقات البالغ عددها 68 في هذه المجموعة.
فتح الحزمة
k this deck
37
According to the following Pareto chart,the most common complaint was ______.
A)user interface
B)speaker quality
C)camera
D)size
E)all of the above
A)user interface
B)speaker quality
C)camera
D)size
E)all of the above
فتح الحزمة
افتح القفل للوصول البطاقات البالغ عددها 68 في هذه المجموعة.
فتح الحزمة
k this deck
38
Reengineering is ___________________________.
A)a fine-tuning of the present process
B)downsizing of a company
C)another name for Deming's 14 points
D)the complete redesign of core business processes
E)incremental improvement of a core process
A)a fine-tuning of the present process
B)downsizing of a company
C)another name for Deming's 14 points
D)the complete redesign of core business processes
E)incremental improvement of a core process
فتح الحزمة
افتح القفل للوصول البطاقات البالغ عددها 68 في هذه المجموعة.
فتح الحزمة
k this deck
39
A plot of the sample ranges over regular time intervals is called a(n)_______.
A) chart
B)R chart
C)p chart
D)c chart
E)S chart
A)
chartB)R chart
C)p chart
D)c chart
E)S chart
فتح الحزمة
افتح القفل للوصول البطاقات البالغ عددها 68 في هذه المجموعة.
فتح الحزمة
k this deck
40
An chart is being developed using 15 samples of size 9 each.The average of 15 sample means is 6.20.The average of the 15 ranges is 0.30.The lower control limit is _______________.
A)6.301
B)6.267
C)6.133
D)6.099
E)6.312
chart is being developed using 15 samples of size 9 each.The average of 15 sample means is 6.20.The average of the 15 ranges is 0.30.The lower control limit is _______________.A)6.301
B)6.267
C)6.133
D)6.099
E)6.312
فتح الحزمة
افتح القفل للوصول البطاقات البالغ عددها 68 في هذه المجموعة.
فتح الحزمة
k this deck
41
Jake Flanaghan,Vice President for inpatient pharmacy,at Great Atlantic Medical Center,is designing a c chart to monitor the number of inpatient medication errors that occur each month.The total number of medication errors for January - December last year was 37.The centerline for Jake's c chart is ___________.
A)3.08
B)37
C)8.35
D)-2.18
E)0.00
A)3.08
B)37
C)8.35
D)-2.18
E)0.00
فتح الحزمة
افتح القفل للوصول البطاقات البالغ عددها 68 في هذه المجموعة.
فتح الحزمة
k this deck
42
An R Chart is to be developed for use in quality control.The average of the ranges is calculated to be 0.60.This was based on several samples of size 7 each.What would the lower control limit be?
A)0.046
B)0.000
C)1.154
D)4.200
E)0.004
A)0.046
B)0.000
C)1.154
D)4.200
E)0.004
فتح الحزمة
افتح القفل للوصول البطاقات البالغ عددها 68 في هذه المجموعة.
فتح الحزمة
k this deck
43
Ophelia O'Brien,VP of Consumer Credit of American First Banks (AFB),is designing a p chart to monitor the default rate on personal loans at the AFB member banks.Her data includes the proportion in default for 30 samples of personal loans.Each sample contains 50 loans,and the average of the 30 proportions is 0.05.The centerline for Ophelia's p chart is _____________.
A)30
B)0.50
C)50
D)1.5
E)0.05
A)30
B)0.50
C)50
D)1.5
E)0.05
فتح الحزمة
افتح القفل للوصول البطاقات البالغ عددها 68 في هذه المجموعة.
فتح الحزمة
k this deck
44
A p Chart is to be developed for use in quality control.The value of p is calculated to be 0.54.The sample size is 249.What would the upper control limit be?
A)0.5941
B)0.6348
C)0.4452
D)0.5460
E)0.5340
A)0.5941
B)0.6348
C)0.4452
D)0.5460
E)0.5340
فتح الحزمة
افتح القفل للوصول البطاقات البالغ عددها 68 في هذه المجموعة.
فتح الحزمة
k this deck
45
Ophelia O'Brien,VP of Consumer Credit of American First Banks (AFB),is designing a p chart to monitor the default rate on personal loans at the AFB member banks.Her data includes the proportion in default for 30 samples of personal loans.Each sample contains 50 loans,and the average of the 30 proportions is 0.05.The upper control limit for Ophelia's p chart is _____________.
A)0.0925
B)0.0500
C)0.0308
D)0.1825
E)0.1425
A)0.0925
B)0.0500
C)0.0308
D)0.1825
E)0.1425
فتح الحزمة
افتح القفل للوصول البطاقات البالغ عددها 68 في هذه المجموعة.
فتح الحزمة
k this deck
46
Sarah Soliz,Director of Quality Programs,is designing and R charts for the rod shearing process at Stockton Steel.She has 26 samples of rod length,and each sample included measurements of 5 rods.The mean of the 26 sample means is 112 inches,and mean of the 26 ranges is 0.15 inch.The centerline for her R chart is ____.
A)0.15
B)26
C)5
D)112
E)15
and R charts for the rod shearing process at Stockton Steel.She has 26 samples of rod length,and each sample included measurements of 5 rods.The mean of the 26 sample means is 112 inches,and mean of the 26 ranges is 0.15 inch.The centerline for her R chart is ____.A)0.15
B)26
C)5
D)112
E)15
فتح الحزمة
افتح القفل للوصول البطاقات البالغ عددها 68 في هذه المجموعة.
فتح الحزمة
k this deck
47
Sarah Soliz,Director of Quality Programs,is designing and R charts for the rod shearing process at Stockton Steel.She has 26 samples of rod length,and each sample included measurements of 5 rods.The mean of the 26 sample means is 112 inches,and mean of the 26 ranges is 0.15 inch.The lower control limit for her chart is ____.
A)25.913
B)4.913
C)111.91
D)108.10
E)112.84
and R charts for the rod shearing process at Stockton Steel.She has 26 samples of rod length,and each sample included measurements of 5 rods.The mean of the 26 sample means is 112 inches,and mean of the 26 ranges is 0.15 inch.The lower control limit for her chart is ____.A)25.913
B)4.913
C)111.91
D)108.10
E)112.84
فتح الحزمة
افتح القفل للوصول البطاقات البالغ عددها 68 في هذه المجموعة.
فتح الحزمة
k this deck
48
A p Chart is to be developed for use in quality control.The value of p is calculated to be 0.05.The sample size is 50.What would the upper control limit be?
A)0.142
B)-0.042
C)0.408
D)0.092
E)0.642
A)0.142
B)-0.042
C)0.408
D)0.092
E)0.642
فتح الحزمة
افتح القفل للوصول البطاقات البالغ عددها 68 في هذه المجموعة.
فتح الحزمة
k this deck
49
Sarah Soliz,Director of Quality Programs,is designing and R charts for the rod shearing process at Stockton Steel.She has 26 samples of rod length,and each sample included measurements of 5 rods.The mean of the 26 sample means is 112 inches,and mean of the 26 ranges is 0.15 inch.The upper control limit for her chart is ________.
A)112.09
B)5.087
C)26.087
D)115.90
E)110.09
and R charts for the rod shearing process at Stockton Steel.She has 26 samples of rod length,and each sample included measurements of 5 rods.The mean of the 26 sample means is 112 inches,and mean of the 26 ranges is 0.15 inch.The upper control limit for her chart is ________.A)112.09
B)5.087
C)26.087
D)115.90
E)110.09
فتح الحزمة
افتح القفل للوصول البطاقات البالغ عددها 68 في هذه المجموعة.
فتح الحزمة
k this deck
50
Nels Neugent,Purchasing Manager at Mid-West Medical Center,is designing a p chart to monitor the proportion of defective purchase orders issued at Mid-West.He has the proportions defective for 22 samples of purchase orders.Each sample contains 150 purchase orders,and the average proportion defective is 0.08.The upper control limit for Nels's p chart is ___________.
A)0.1736
B)0.1465
C)0.1312
D)0.0940
E)0.1845
A)0.1736
B)0.1465
C)0.1312
D)0.0940
E)0.1845
فتح الحزمة
افتح القفل للوصول البطاقات البالغ عددها 68 في هذه المجموعة.
فتح الحزمة
k this deck
51
Nels Neugent,Purchasing Manager at Mid-West Medical Center,is designing a p chart to monitor the proportion of defective purchase orders issued at Mid-West.He has the proportions defective for 22 samples of purchase orders.Each sample contains 150 purchase orders,and the average proportion defective is 0.08.The lower control limit for Nels's p chart is ___________.
A)0.0447
B)0.0283
C)0.0135
D)0.0000
E)0.5090
A)0.0447
B)0.0283
C)0.0135
D)0.0000
E)0.5090
فتح الحزمة
افتح القفل للوصول البطاقات البالغ عددها 68 في هذه المجموعة.
فتح الحزمة
k this deck
52
Sarah Soliz,Director of Quality Programs,is designing and R charts for the rod shearing process at Stockton Steel.She has 26 samples of rod length,and each sample included measurements of 5 rods.The mean of the 26 sample means is 112 inches,and mean of the 26 ranges is 0.15 inch.The upper control limit for her R chart is ____.
A)0.150
B)10.57
C)0.317
D)2.114
E)0.713
and R charts for the rod shearing process at Stockton Steel.She has 26 samples of rod length,and each sample included measurements of 5 rods.The mean of the 26 sample means is 112 inches,and mean of the 26 ranges is 0.15 inch.The upper control limit for her R chart is ____.A)0.150
B)10.57
C)0.317
D)2.114
E)0.713
فتح الحزمة
افتح القفل للوصول البطاقات البالغ عددها 68 في هذه المجموعة.
فتح الحزمة
k this deck
53
Ophelia O'Brien,VP of Consumer Credit of American First Banks (AFB),is designing a p chart to monitor the default rate on personal loans at the AFB member banks.Her data includes the proportion in default for 30 samples of personal loans.Each sample contains 50 loans,and the average of the 30 proportions is 0.05.The lower control limit for Ophelia's p chart is _____________.
A)0.0000
B)0.0204
C)0.0308
D)0.0149
E)-1.0000
A)0.0000
B)0.0204
C)0.0308
D)0.0149
E)-1.0000
فتح الحزمة
افتح القفل للوصول البطاقات البالغ عددها 68 في هذه المجموعة.
فتح الحزمة
k this deck
54
Nels Neugent,Purchasing Manager at Mid-West Medical Center,is designing a p chart to monitor the proportion of defective purchase orders issued at Mid-West.He has the proportions defective for 22 samples of purchase orders.Each sample contains 150 purchase orders,and the average proportion defective is 0.08.The centerline for Nels's p chart is ___________.
A)0.08
B)75
C)22
D)1.76
E)0.008
A)0.08
B)75
C)22
D)1.76
E)0.008
فتح الحزمة
افتح القفل للوصول البطاقات البالغ عددها 68 في هذه المجموعة.
فتح الحزمة
k this deck
55
A graph that plots the proportions of items in noncompliance for multiple samples is called a(n)_______.
A) chart
B)R chart
C)p chart
D)c chart
E)Pareto chart
A)
chartB)R chart
C)p chart
D)c chart
E)Pareto chart
فتح الحزمة
افتح القفل للوصول البطاقات البالغ عددها 68 في هذه المجموعة.
فتح الحزمة
k this deck
56
Sarah Soliz,Director of Quality Programs,is designing and R charts for the rod shearing process at Stockton Steel.She has 26 samples of rod length,and each sample included measurements of 5 rods.The mean of the 26 sample means is 112 inches,and mean of the 26 ranges is 0.15 inch.The centerline for her chart is _________.
A)5
B)26
C)0.15
D)11.2
E)112
and R charts for the rod shearing process at Stockton Steel.She has 26 samples of rod length,and each sample included measurements of 5 rods.The mean of the 26 sample means is 112 inches,and mean of the 26 ranges is 0.15 inch.The centerline for her chart is _________.A)5
B)26
C)0.15
D)11.2
E)112
فتح الحزمة
افتح القفل للوصول البطاقات البالغ عددها 68 في هذه المجموعة.
فتح الحزمة
k this deck
57
Sarah Soliz,Director of Quality Programs,is designing and R charts for the rod shearing process at Stockton Steel.She has 26 samples of rod length,and each sample included measurements of 5 rods.The mean of the 26 sample means is 112 inches,and mean of the 26 ranges is 0.15 inch.The lower control limit for her R chart is ____.
A)0.150
B)0.000
C)0.317
D)2.114
E)1.000
and R charts for the rod shearing process at Stockton Steel.She has 26 samples of rod length,and each sample included measurements of 5 rods.The mean of the 26 sample means is 112 inches,and mean of the 26 ranges is 0.15 inch.The lower control limit for her R chart is ____.A)0.150
B)0.000
C)0.317
D)2.114
E)1.000
فتح الحزمة
افتح القفل للوصول البطاقات البالغ عددها 68 في هذه المجموعة.
فتح الحزمة
k this deck
58
An R Chart is to be developed for use in quality control.The average of the ranges is calculated to be 0.60.This was based on several samples of size 7 each.What would the upper control limit be?
A)1.514
B)1.924
C)4.200
D)0.600
E)1.154
A)1.514
B)1.924
C)4.200
D)0.600
E)1.154
فتح الحزمة
افتح القفل للوصول البطاقات البالغ عددها 68 في هذه المجموعة.
فتح الحزمة
k this deck
59
A graph that plots the number of nonconformances per item for multiple samples is called a(n)_______.
A) chart
B)R chart
C)p chart
D)c chart
E)Pareto chart
A)
chartB)R chart
C)p chart
D)c chart
E)Pareto chart
فتح الحزمة
افتح القفل للوصول البطاقات البالغ عددها 68 في هذه المجموعة.
فتح الحزمة
k this deck
60
Jake Flanaghan,Vice President for inpatient pharmacy,at Great Atlantic Medical Center,is designing a c chart to monitor the number of inpatient medication errors that occur each month.The total number of medication errors for January - December last year was 37.The upper control limit for Jake's c chart is ___________.
A)3.08
B)37
C)8.35
D)-2.18
E)0.00
A)3.08
B)37
C)8.35
D)-2.18
E)0.00
فتح الحزمة
افتح القفل للوصول البطاقات البالغ عددها 68 في هذه المجموعة.
فتح الحزمة
k this deck
61
Jack Joyner,Director of Quality Control at Covington Castings (CC),is designing a c chart to monitor the number of nonconformances per aluminum casting produced at CC.The total number of nonconformances for 26 castings is 91.The lower control limit for Jack's c chart is ___________.
A)1.37
B)-2.11
C)3.50
D)-1.00
E)0.00
A)1.37
B)-2.11
C)3.50
D)-1.00
E)0.00
فتح الحزمة
افتح القفل للوصول البطاقات البالغ عددها 68 في هذه المجموعة.
فتح الحزمة
k this deck
62
Which of the following quality control chart conditions is an indicator that the process is potentially out-of-control?
A)several consecutive data points between the UCL and the LCL
B)a data point below the LCL
C)a data point below the UCL
D)a data point in the outer 1/3 region
E)a data point on the center line
A)several consecutive data points between the UCL and the LCL
B)a data point below the LCL
C)a data point below the UCL
D)a data point in the outer 1/3 region
E)a data point on the center line
فتح الحزمة
افتح القفل للوصول البطاقات البالغ عددها 68 في هذه المجموعة.
فتح الحزمة
k this deck
63
Which of the following quality control chart conditions is an indicator that the process is,potentially,out-of-control?
A)several consecutive data points between the UCL and the LCL
B)a data point above the LCL
C)a data point below the UCL
D)an upward trend of nine data points
E)a data point in the outer 1/3 region
A)several consecutive data points between the UCL and the LCL
B)a data point above the LCL
C)a data point below the UCL
D)an upward trend of nine data points
E)a data point in the outer 1/3 region
فتح الحزمة
افتح القفل للوصول البطاقات البالغ عددها 68 في هذه المجموعة.
فتح الحزمة
k this deck
64
Which of the following quality control chart conditions is an indicator that the process is potentially out-of-control?
A)several consecutive data points between the UCL and the LCL
B)a data point above the LCL
C)a data point above the UCL
D)a data point in the outer 1/3 region
E)a data point on the center line
A)several consecutive data points between the UCL and the LCL
B)a data point above the LCL
C)a data point above the UCL
D)a data point in the outer 1/3 region
E)a data point on the center line
فتح الحزمة
افتح القفل للوصول البطاقات البالغ عددها 68 في هذه المجموعة.
فتح الحزمة
k this deck
65
Jack Joyner,Director of Quality Control at Covington Castings (CC),is designing a c chart to monitor the number of nonconformances per aluminum casting produced at CC.The total number of nonconformances for 26 castings is 91.The centerline for Jack's c chart is ___________.
A)117.00
B)0.2857
C)3.50
D)65.00
E)26.00
A)117.00
B)0.2857
C)3.50
D)65.00
E)26.00
فتح الحزمة
افتح القفل للوصول البطاقات البالغ عددها 68 في هذه المجموعة.
فتح الحزمة
k this deck
66
.Jake Flanaghan,Vice President for inpatient pharmacy,at Great Atlantic Medical Center,is designing a c chart to monitor the number of inpatient medication errors that occur each month.The total number of medication errors for January - December last year was 37.The lower control limit for Jake's c chart is ___________.
A)3.08
B)37
C)8.35
D)-2.18
E)0.00
A)3.08
B)37
C)8.35
D)-2.18
E)0.00
فتح الحزمة
افتح القفل للوصول البطاقات البالغ عددها 68 في هذه المجموعة.
فتح الحزمة
k this deck
67
Jack Joyner,Director of Quality Control at Covington Castings (CC),is designing a c chart to monitor the number of nonconformances per aluminum casting produced at CC.The total number of nonconformances for 26 castings is 91.The upper control limit for Jack's c chart is ___________.
A)9.11
B)13.40
C)3.50
D)7.61
E)1.00
A)9.11
B)13.40
C)3.50
D)7.61
E)1.00
فتح الحزمة
افتح القفل للوصول البطاقات البالغ عددها 68 في هذه المجموعة.
فتح الحزمة
k this deck
68
You are conducting a study on the blood glucose levels of 9 patients who are on strict diets and exercise routines.To monitor the mean and range of the blood glucose levels of your patients,you take a blood glucose reading every day for each patient for 20 days.The mean of the 9 sample means is 101.03,and the mean of the 9 standard deviations is 29.243.The lower control limit for your chart is ________.
A)70.85
B)92.11
C)73
D)71.75
E)60.5
chart is ________.A)70.85
B)92.11
C)73
D)71.75
E)60.5
فتح الحزمة
افتح القفل للوصول البطاقات البالغ عددها 68 في هذه المجموعة.
فتح الحزمة
k this deck
فتح الحزمة
افتح القفل للوصول البطاقات البالغ عددها 68 في هذه المجموعة.


