Deck 7: Sampling and Sampling Distributions
ملء الشاشة (f)
سؤال
سؤال
سؤال
سؤال
سؤال
سؤال
سؤال
سؤال
For any population  with expected value µ and standard deviation σ,the sampling distribution of
  will be approximately normal if the sample size n is sufficiently small.As a general guideline,the normal distribution approximation is justified when
  .
.
with expected value µ and standard deviation σ,the sampling distribution of will be approximately normal if the sample size n is sufficiently small.As a general guideline,the normal distribution approximation is justified when . سؤال
For any population proportion p,the sampling distribution of  will be approximately normal if the sample size n is sufficiently large.As a general guideline,the normal distribution approximation is justified when
  and
and  .
.
will be approximately normal if the sample size n is sufficiently large.As a general guideline,the normal distribution approximation is justified when and . سؤال
سؤال
سؤال
سؤال
سؤال
سؤال
For any sample size n,the sampling distribution of  is normal if the population
  from which the sample is drawn is uniformly distributed.
is normal if the population from which the sample is drawn is uniformly distributed. سؤال
سؤال
The standard deviation of  equals the population standard deviation divided by the square root of the sample size,or equivalently,
  .
.
equals the population standard deviation divided by the square root of the sample size,or equivalently, . سؤال
سؤال
سؤال
سؤال
سؤال
سؤال
Which of the following is considered an estimate?
A)
B)
C)
D)
A)
B)
C)
D)
سؤال
سؤال
سؤال
Over the entire six years that students attend an Ohio elementary school,they are absent,on average,28 days due to influenza.Assume that the standard deviation over this time period is  days.Upon graduation from elementary school,a random sample of 36 students is taken and asked how many days of school they missed due to influenza. Refer to Exhibit 7-1.The probability that the sample mean is between 25 and 30 school days is ___________.
A)0.0228
B)0.0918
C)0.8854
D)0.9082
days.Upon graduation from elementary school,a random sample of 36 students is taken and asked how many days of school they missed due to influenza. Refer to Exhibit 7-1.The probability that the sample mean is between 25 and 30 school days is ___________.A)0.0228
B)0.0918
C)0.8854
D)0.9082
سؤال
سؤال
سؤال
If a population is known to be normally distributed,what can be said of the sampling distribution of the sample mean drawn from this population?
A)For any sample size n,the sampling distribution of the sample mean is normally distributed.
B)For a sample size ,the sampling distribution of the sample mean is normally distributed.
C)For a sample size ,the sampling distribution of the sample mean is normally distributed.
D)For a sample size
A)For any sample size n,the sampling distribution of the sample mean is normally distributed.
B)For a sample size
,the sampling distribution of the sample mean is normally distributed.C)For a sample size
,the sampling distribution of the sample mean is normally distributed.D)For a sample size
سؤال
Which of the following is not a population parameter?
A)
B)µ
C)σ
D)σ2
A)
B)µ
C)σ
D)σ2
سؤال
What is the relationship between the standard deviation of the sample mean and the population standard deviation?
A)
B)
C)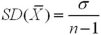
D)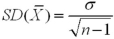
A)
B)
C)
D)
سؤال
Which of the following is an example of a sample statistic?
A)
B)µ
C)σ
D)σ2
A)
B)µ
C)σ
D)σ2
سؤال
Over the entire six years that students attend an Ohio elementary school,they are absent,on average,28 days due to influenza.Assume that the standard deviation over this time period is  days.Upon graduation from elementary school,a random sample of 36 students is taken and asked how many days of school they missed due to influenza. Refer to Exhibit 7-1.The probability that the sample mean is less than 30 school days is _______.
A)0.0918
B)0.4129
C)0.5871
D)0.9082
days.Upon graduation from elementary school,a random sample of 36 students is taken and asked how many days of school they missed due to influenza. Refer to Exhibit 7-1.The probability that the sample mean is less than 30 school days is _______.A)0.0918
B)0.4129
C)0.5871
D)0.9082
سؤال
سؤال
سؤال
What is the relationship between the expected value of the sample mean and the expected value of the population?
A)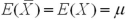
B)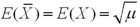
C)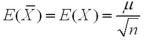
D)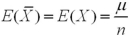
A)
B)
C)
D)
سؤال
سؤال
Over the entire six years that students attend an Ohio elementary school,they are absent,on average,28 days due to influenza.Assume that the standard deviation over this time period is  days.Upon graduation from elementary school,a random sample of 36 students is taken and asked how many days of school they missed due to influenza. Refer to Exhibit 7-1.What is the expected value for the sampling distribution of the number of school days missed due to influenza?
A)6
B)9
C)28
D)168
days.Upon graduation from elementary school,a random sample of 36 students is taken and asked how many days of school they missed due to influenza. Refer to Exhibit 7-1.What is the expected value for the sampling distribution of the number of school days missed due to influenza?A)6
B)9
C)28
D)168
سؤال
Over the entire six years that students attend an Ohio elementary school,they are absent,on average,28 days due to influenza.Assume that the standard deviation over this time period is  days.Upon graduation from elementary school,a random sample of 36 students is taken and asked how many days of school they missed due to influenza. Refer to Exhibit 7-1.What is the standard deviation for the sampling distribution of the number of school days missed due to influenza?
A)1.22
B)1.50
C)2.25
D)9.00
days.Upon graduation from elementary school,a random sample of 36 students is taken and asked how many days of school they missed due to influenza. Refer to Exhibit 7-1.What is the standard deviation for the sampling distribution of the number of school days missed due to influenza?A)1.22
B)1.50
C)2.25
D)9.00
سؤال
Which of the following is considered an estimator?
A)
B)µ
C)σ
D)σ2
A)
B)µ
C)σ
D)σ2
سؤال
سؤال
Suppose that,on average,electricians earn approximately  dollars per year in the United States.Assume that the distribution for electrician's yearly earnings is normally distributed and that the standard deviation is
  dollars. Refer to Exhibit 7-2.What is the probability that the average salary of four randomly selected electricians is more than $50,000 but less than $60,000?
A)0.5899
B)0.7486
C)0.8413
D)0.9048
dollars per year in the United States.Assume that the distribution for electrician's yearly earnings is normally distributed and that the standard deviation is dollars. Refer to Exhibit 7-2.What is the probability that the average salary of four randomly selected electricians is more than $50,000 but less than $60,000?A)0.5899
B)0.7486
C)0.8413
D)0.9048
سؤال
سؤال
سؤال
سؤال
Suppose that,on average,electricians earn approximately  dollars per year in the United States.Assume that the distribution for electrician's yearly earnings is normally distributed and that the standard deviation is
  dollars. Refer to Exhibit 7-2.Given a sample of four electricians,what is the standard deviation for the sampling distribution of the sample mean?
A)6,000
B)12,000
C)36,000
D)54,000
dollars per year in the United States.Assume that the distribution for electrician's yearly earnings is normally distributed and that the standard deviation is dollars. Refer to Exhibit 7-2.Given a sample of four electricians,what is the standard deviation for the sampling distribution of the sample mean?A)6,000
B)12,000
C)36,000
D)54,000
سؤال
Suppose that,on average,electricians earn approximately  dollars per year in the United States.Assume that the distribution for electrician's yearly earnings is normally distributed and that the standard deviation is
  dollars. Refer to Exhibit 7-2.What is the probability that the average salary of four randomly selected electricians exceeds $60,000?
A)0.1587
B)0.3085
C)0.6915
D)0.8413
dollars per year in the United States.Assume that the distribution for electrician's yearly earnings is normally distributed and that the standard deviation is dollars. Refer to Exhibit 7-2.What is the probability that the average salary of four randomly selected electricians exceeds $60,000?A)0.1587
B)0.3085
C)0.6915
D)0.8413
سؤال
سؤال
سؤال
A random sample of size 36 is taken from a population with mean  and standard deviation
  . Refer to Exhibit 7-5.The probability that the sample mean is between 15 and 18 is _______.
A)0.0228
B)0.8185
C)0.8413
D)0.8641
and standard deviation . Refer to Exhibit 7-5.The probability that the sample mean is between 15 and 18 is _______.A)0.0228
B)0.8185
C)0.8413
D)0.8641
سؤال
سؤال
According to the central limit theorem,the distribution of the sample means is normal if _______________.
A)The underlying population is normal
B)The sample size
C)If the standard deviation of the population is known
D)Both A and B are correct
A)The underlying population is normal
B)The sample size
C)If the standard deviation of the population is known
D)Both A and B are correct
سؤال
Using the central limit theorem,applied to the sampling distribution of the sample proportion,what conditions must be met?
A)
B)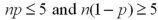
C)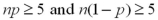
D)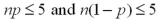
A)
B)
C)
D)
سؤال
A random sample of size 36 is taken from a population with mean  and standard deviation
  . Refer to Exhibit 7-5.The probability that the sample mean is greater than 18 is _______.
A)0.1587
B)0.4325
C)0.5675
D)0.8413
and standard deviation . Refer to Exhibit 7-5.The probability that the sample mean is greater than 18 is _______.A)0.1587
B)0.4325
C)0.5675
D)0.8413
سؤال
Professor Elderman has given the same multiple choice final exam in his Principles of Microeconomics class for many years.After examining his records from the past 10 years,he finds that the scores have a mean of 76 and a standard deviation of 12. Refer to Exhibit 7-4.What is the probability that a class of 15 students will have a class average greater than 70 on Professor Elderman's final exam?
A)0.0262
B)0.6915
C)0.9738
D)Cannot be determineD.
A)0.0262
B)0.6915
C)0.9738
D)Cannot be determineD.
سؤال
A random sample of size 100 is taken from a population described by the proportion  . Refer to Exhibit 7-6.What is the expected value and the standard deviation for the sampling distribution of the sample proportion?
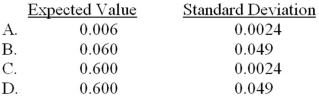
A)Option A
B)Option B
C)Option C
D)Option D
. Refer to Exhibit 7-6.What is the expected value and the standard deviation for the sampling distribution of the sample proportion? A)Option A
B)Option B
C)Option C
D)Option D
سؤال
A random sample of size 36 is taken from a population with mean  and standard deviation
  . Refer to Exhibit 7-5.What is the expected value and the standard deviation for the sampling distribution of the sample mean?
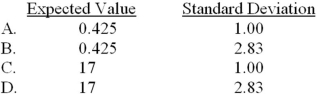
A)Option A
B)Option B
C)Option C
D)Option D
and standard deviation . Refer to Exhibit 7-5.What is the expected value and the standard deviation for the sampling distribution of the sample mean? A)Option A
B)Option B
C)Option C
D)Option D
سؤال
Suppose that,on average,electricians earn approximately  dollars per year in the United States.Assume that the distribution for electrician's yearly earnings is normally distributed and that the standard deviation is
  dollars. Refer to Exhibit 7-2.What is the probability that the average salary of four randomly selected electricians is less than $50,000?
A)0.2514
B)0.3707
C)0.6293
D)0.7486
dollars per year in the United States.Assume that the distribution for electrician's yearly earnings is normally distributed and that the standard deviation is dollars. Refer to Exhibit 7-2.What is the probability that the average salary of four randomly selected electricians is less than $50,000?A)0.2514
B)0.3707
C)0.6293
D)0.7486
سؤال
A random sample of size 36 is taken from a population with mean  and standard deviation
  . Refer to Exhibit 7-5.The probability that the sample mean is less than 15 is ________.
A)0.0228
B)0.3707
C)0.6293
D)0.9772
and standard deviation . Refer to Exhibit 7-5.The probability that the sample mean is less than 15 is ________.A)0.0228
B)0.3707
C)0.6293
D)0.9772
سؤال
Professor Elderman has given the same multiple choice final exam in his Principles of Microeconomics class for many years.After examining his records from the past 10 years,he finds that the scores have a mean of 76 and a standard deviation of 12. Refer to Exhibit 7-4.What is the probability Professor Elderman's class of 36 has a class average below 78?
A)0.1587
B)0.5675
C)0.8413
D)Cannot be determineD.
A)0.1587
B)0.5675
C)0.8413
D)Cannot be determineD.
سؤال
سؤال
سؤال
The labor force participation rate is the number of people in the labor force divided by the number of people in the country that are of working age and not institutionalized.The BLS reported in February of 2012 that the labor force participation rate in the United States was 63.7% (Calculatedrisk.com).A marketing company asks 120 working-age people if they either have a job or are looking for a job,or,in other words,whether they are in the labor force. Refer to Exhibit 7-8.What is the expected value and the standard deviation for a labor participation rate in the company's sample? 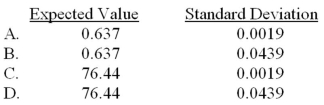
A)Option A
B)Option B
C)Option C
D)Option D
A)Option A
B)Option B
C)Option C
D)Option D
سؤال
سؤال
A random sample of size 100 is taken from a population described by the proportion  . Refer to Exhibit 7-6.The probability that the sample proportion is between 0.55 and 0.62 is __________.
A)0.1539
B)0.5052
C)0.6591
D)0.8130
. Refer to Exhibit 7-6.The probability that the sample proportion is between 0.55 and 0.62 is __________.A)0.1539
B)0.5052
C)0.6591
D)0.8130
سؤال
سؤال
A random sample of size 100 is taken from a population described by the proportion  . Refer to Exhibit 7-6.The probability that the sample proportion is greater than 0.62 is _______.
A)0.3409
B)0.4082
C)0.6591
D)
. Refer to Exhibit 7-6.The probability that the sample proportion is greater than 0.62 is _______.A)0.3409
B)0.4082
C)0.6591
D)
سؤال
سؤال
سؤال
سؤال
سؤال
سؤال
سؤال
سؤال
سؤال
سؤال
The finite correction factor is always _________________.
A)Less than one,and therefore increases the standard deviations of and
and
 computed under the assumption of infinite population
B)Less than one,and therefore decreases the standard deviations of and
and
 computed under the assumption of infinite population
C)Greater than one,and therefore increases the standard deviations of and
and
 computed under the assumption of infinite population
D)Greater than one,and therefore decreases the standard deviations of
A)Less than one,and therefore increases the standard deviations of
and computed under the assumption of infinite populationB)Less than one,and therefore decreases the standard deviations of
and computed under the assumption of infinite populationC)Greater than one,and therefore increases the standard deviations of
and computed under the assumption of infinite populationD)Greater than one,and therefore decreases the standard deviations of
سؤال
Under what condition is the finite population correction factor used for computing the standard deviations of  and
and  ?
?
A)
B)
C)
D)
and ?A)
B)
C)
D)
سؤال
A random sample of size 100 is taken from a population described by the proportion  . Refer to Exhibit 7-6.The probability that the sample proportion is less than 0.55 is ________.
A)
B)0.1539
C)0.3669
D)0.8461
. Refer to Exhibit 7-6.The probability that the sample proportion is less than 0.55 is ________.A)
B)0.1539
C)0.3669
D)0.8461
سؤال

فتح الحزمة
قم بالتسجيل لفتح البطاقات في هذه المجموعة!
Unlock Deck
Unlock Deck
1/110
العب
ملء الشاشة (f)
Deck 7: Sampling and Sampling Distributions
1
In stratified random sampling,the population is first divided up into mutually exclusive and collectively exhaustive groups,called strata.A stratified sample includes randomly selected observations from each stratum,which are proportional to the stratum's size.
True
2
When a statistic is used to estimate a parameter,the statistic is referred to as an estimator.A particular value of the estimator is called an estimate.
True
3
If we had access to data that encompass the entire population,then the values of the parameters would be known and no statistical inference would be needed.
True
4
A tutoring company claims that 75% of the high school students who hire one of their tutor's will improve their grades.
A)In a sample of 100 high school students,what is the probability that 80% or more improved their grades?
B)In a sample of 200 high school students,what is the probability that 80% or more improved their grades?
C)Comment on the reason for the difference between the computed probabilities in parts a and b.
فتح الحزمة
افتح القفل للوصول البطاقات البالغ عددها 110 في هذه المجموعة.
فتح الحزمة
k this deck
5
Selection bias occurs when the sample is mistakenly divided into strata,and random samples are drawn from each stratum.
فتح الحزمة
افتح القفل للوصول البطاقات البالغ عددها 110 في هذه المجموعة.
فتح الحزمة
k this deck
6
In a recent investigation,the National Highway Traffic Safety Administration (NHTSA)found that the Chevrolet Volt and other electric vehicles do not pose a greater risk of fire than gasoline-powered vehicles (The Boston Globe,January 25,2012).Specifically,it was determined that "no discernible defect trend exists." Suppose a consumer advocacy group wants to verify some of these claims by constructing a
فتح الحزمة
افتح القفل للوصول البطاقات البالغ عددها 110 في هذه المجموعة.
فتح الحزمة
k this deck
7
A population consists of all items of interest in a statistical problem.
فتح الحزمة
افتح القفل للوصول البطاقات البالغ عددها 110 في هذه المجموعة.
فتح الحزمة
k this deck
8
For any population with expected value µ and standard deviation σ,the sampling distribution of will be approximately normal if the sample size n is sufficiently small.As a general guideline,the normal distribution approximation is justified when .
with expected value µ and standard deviation σ,the sampling distribution of will be approximately normal if the sample size n is sufficiently small.As a general guideline,the normal distribution approximation is justified when . فتح الحزمة
افتح القفل للوصول البطاقات البالغ عددها 110 في هذه المجموعة.
فتح الحزمة
k this deck
9
For any population proportion p,the sampling distribution of will be approximately normal if the sample size n is sufficiently large.As a general guideline,the normal distribution approximation is justified when and .
will be approximately normal if the sample size n is sufficiently large.As a general guideline,the normal distribution approximation is justified when and . فتح الحزمة
افتح القفل للوصول البطاقات البالغ عددها 110 في هذه المجموعة.
فتح الحزمة
k this deck
10
A sample consists of all items of interest in a statistical problem,whereas a population is a subset of the population.We calculate a parameter to make inferences about the unknown sample statistic.
فتح الحزمة
افتح القفل للوصول البطاقات البالغ عددها 110 في هذه المجموعة.
فتح الحزمة
k this deck
11
A simple random sample is a sample of n observations which has the same probability of being selected from the population as any other sample of n observations.
فتح الحزمة
افتح القفل للوصول البطاقات البالغ عددها 110 في هذه المجموعة.
فتح الحزمة
k this deck
12
A random sample of nine cast aluminum pots is taken from a production line once every hour.The interior diameter of the pots is measured and the sample mean is calculated.The target for the diameter is 12' and the standard deviation for the pot diameter is 0.05'.Assume the pot diameter is normally distributed.
A)Construct the centerline and the upper and lower control limits for the
A)Construct the centerline and the upper and lower control limits for the
فتح الحزمة
افتح القفل للوصول البطاقات البالغ عددها 110 في هذه المجموعة.
فتح الحزمة
k this deck
13
A parameter is a random variable,whereas a sample statistic is a constant.
فتح الحزمة
افتح القفل للوصول البطاقات البالغ عددها 110 في هذه المجموعة.
فتح الحزمة
k this deck
14
Nonresponse bias occurs when those responding to a survey or poll differ systematically from the non-respondents.
فتح الحزمة
افتح القفل للوصول البطاقات البالغ عددها 110 في هذه المجموعة.
فتح الحزمة
k this deck
15
For any sample size n,the sampling distribution of is normal if the population from which the sample is drawn is uniformly distributed.
is normal if the population from which the sample is drawn is uniformly distributed. فتح الحزمة
افتح القفل للوصول البطاقات البالغ عددها 110 في هذه المجموعة.
فتح الحزمة
k this deck
16
We calculate a parameter to make inferences about a statistic.
فتح الحزمة
افتح القفل للوصول البطاقات البالغ عددها 110 في هذه المجموعة.
فتح الحزمة
k this deck
17
The standard deviation of equals the population standard deviation divided by the square root of the sample size,or equivalently, .
equals the population standard deviation divided by the square root of the sample size,or equivalently, . فتح الحزمة
افتح القفل للوصول البطاقات البالغ عددها 110 في هذه المجموعة.
فتح الحزمة
k this deck
18
Bias refers to the tendency of a sample statistic to systematically over- or underestimate a population parameter.
فتح الحزمة
افتح القفل للوصول البطاقات البالغ عددها 110 في هذه المجموعة.
فتح الحزمة
k this deck
19
A large accounting firm gives out 1,000 job offers every year to new college graduates.Suppose that 85% of those that received offers accept the position.The following shows the number of graduates that have accepted jobs in the last four years.
Number of job offers accepted:
Number of job offers accepted:
فتح الحزمة
افتح القفل للوصول البطاقات البالغ عددها 110 في هذه المجموعة.
فتح الحزمة
k this deck
20
A manufacturing process produces tubeless mountain bike tires in batches of 200.Past records show that 6% of the tires will not hold air.An engineer tests five batches,each one week apart,and shows the proportion of tires that will not hold air below.
Proportion of tires that will not hold air:
Proportion of tires that will not hold air:
فتح الحزمة
افتح القفل للوصول البطاقات البالغ عددها 110 في هذه المجموعة.
فتح الحزمة
k this deck
21
Which of the following is true about statistics such as the sample mean or sample proportion?
A)A statistic is a constant.
B)A statistic is a parameter.
C)A statistic is always known.
D)A statistic is a random variable.
A)A statistic is a constant.
B)A statistic is a parameter.
C)A statistic is always known.
D)A statistic is a random variable.
فتح الحزمة
افتح القفل للوصول البطاقات البالغ عددها 110 في هذه المجموعة.
فتح الحزمة
k this deck
22
Bias can occur in sampling.Bias refers to _____________________.
A)The division of the population into overlapping groups
B)The creation of strata,which are proportional to the stratum's size
C)The use of cluster sampling instead of stratified random sampling
D)The tendency of a sample statistic to systematically over- or underestimate a population parameter
A)The division of the population into overlapping groups
B)The creation of strata,which are proportional to the stratum's size
C)The use of cluster sampling instead of stratified random sampling
D)The tendency of a sample statistic to systematically over- or underestimate a population parameter
فتح الحزمة
افتح القفل للوصول البطاقات البالغ عددها 110 في هذه المجموعة.
فتح الحزمة
k this deck
23
Which of the following is considered an estimate?
A)
B)
C)
D)
A)
B)
C)
D)
فتح الحزمة
افتح القفل للوصول البطاقات البالغ عددها 110 في هذه المجموعة.
فتح الحزمة
k this deck
24
Selection bias occurs when ___________________.
A)The population has been divided into strata
B)Portions of the population are excluded from the consideration for the sample
C)Cluster sampling is used instead of stratified random sampling
D)Those responding to a survey or poll differ systematically from the non-respondents
A)The population has been divided into strata
B)Portions of the population are excluded from the consideration for the sample
C)Cluster sampling is used instead of stratified random sampling
D)Those responding to a survey or poll differ systematically from the non-respondents
فتح الحزمة
افتح القفل للوصول البطاقات البالغ عددها 110 في هذه المجموعة.
فتح الحزمة
k this deck
25
A census is an example of __________.
A)Sample data
B)Sample statistic
C)Population data
D)Population parameter
A)Sample data
B)Sample statistic
C)Population data
D)Population parameter
فتح الحزمة
افتح القفل للوصول البطاقات البالغ عددها 110 في هذه المجموعة.
فتح الحزمة
k this deck
26
Over the entire six years that students attend an Ohio elementary school,they are absent,on average,28 days due to influenza.Assume that the standard deviation over this time period is days.Upon graduation from elementary school,a random sample of 36 students is taken and asked how many days of school they missed due to influenza. Refer to Exhibit 7-1.The probability that the sample mean is between 25 and 30 school days is ___________.
A)0.0228
B)0.0918
C)0.8854
D)0.9082
days.Upon graduation from elementary school,a random sample of 36 students is taken and asked how many days of school they missed due to influenza. Refer to Exhibit 7-1.The probability that the sample mean is between 25 and 30 school days is ___________.A)0.0228
B)0.0918
C)0.8854
D)0.9082
فتح الحزمة
افتح القفل للوصول البطاقات البالغ عددها 110 في هذه المجموعة.
فتح الحزمة
k this deck
27
How does the variance of the sample mean compare to the variance of the population?
A)It is smaller and therefore suggests that averages have less variation than individual observations.
B)It is larger and therefore suggests that averages have less variation than individual observations.
C)It is smaller and therefore suggests that averages have more variation than individual observations.
D)It is larger and therefore suggests that averages have more variation than individual observations.
فتح الحزمة
افتح القفل للوصول البطاقات البالغ عددها 110 في هذه المجموعة.
فتح الحزمة
k this deck
28
Statistics are used to estimate population parameters,particularly when it is impossible or too expensive to poll an entire population.A particular value of a statistic is referred to as a(n)_______.
A)Mean
B)Stratum
C)Estimate
D)Finite correction factor
A)Mean
B)Stratum
C)Estimate
D)Finite correction factor
فتح الحزمة
افتح القفل للوصول البطاقات البالغ عددها 110 في هذه المجموعة.
فتح الحزمة
k this deck
29
If a population is known to be normally distributed,what can be said of the sampling distribution of the sample mean drawn from this population?
A)For any sample size n,the sampling distribution of the sample mean is normally distributed.
B)For a sample size ,the sampling distribution of the sample mean is normally distributed.
C)For a sample size ,the sampling distribution of the sample mean is normally distributed.
D)For a sample size
A)For any sample size n,the sampling distribution of the sample mean is normally distributed.
B)For a sample size
,the sampling distribution of the sample mean is normally distributed.C)For a sample size
,the sampling distribution of the sample mean is normally distributed.D)For a sample size
فتح الحزمة
افتح القفل للوصول البطاقات البالغ عددها 110 في هذه المجموعة.
فتح الحزمة
k this deck
30
Which of the following is not a population parameter?
A)
B)µ
C)σ
D)σ2
A)
B)µ
C)σ
D)σ2
فتح الحزمة
افتح القفل للوصول البطاقات البالغ عددها 110 في هذه المجموعة.
فتح الحزمة
k this deck
31
What is the relationship between the standard deviation of the sample mean and the population standard deviation?
A)
B)
C)
D)
A)
B)
C)
D)
فتح الحزمة
افتح القفل للوصول البطاقات البالغ عددها 110 في هذه المجموعة.
فتح الحزمة
k this deck
32
Which of the following is an example of a sample statistic?
A)
B)µ
C)σ
D)σ2
A)
B)µ
C)σ
D)σ2
فتح الحزمة
افتح القفل للوصول البطاقات البالغ عددها 110 في هذه المجموعة.
فتح الحزمة
k this deck
33
Over the entire six years that students attend an Ohio elementary school,they are absent,on average,28 days due to influenza.Assume that the standard deviation over this time period is days.Upon graduation from elementary school,a random sample of 36 students is taken and asked how many days of school they missed due to influenza. Refer to Exhibit 7-1.The probability that the sample mean is less than 30 school days is _______.
A)0.0918
B)0.4129
C)0.5871
D)0.9082
days.Upon graduation from elementary school,a random sample of 36 students is taken and asked how many days of school they missed due to influenza. Refer to Exhibit 7-1.The probability that the sample mean is less than 30 school days is _______.A)0.0918
B)0.4129
C)0.5871
D)0.9082
فتح الحزمة
افتح القفل للوصول البطاقات البالغ عددها 110 في هذه المجموعة.
فتح الحزمة
k this deck
34
Which of the following is not a form of bias?
A)Portions of the population are excluded from the sample.
B)Information from the sample is typical of information in the population.
C)Information from the sample overemphasizes a particular stratum of the population.
D)Those responding to a survey or poll differ systematically from the non-respondents.
فتح الحزمة
افتح القفل للوصول البطاقات البالغ عددها 110 في هذه المجموعة.
فتح الحزمة
k this deck
35
Nonresponse bias occurs when _________________.
A)The population has been divided into strata
B)Portions of the population are excluded from the sample
C)Cluster sampling is used instead of stratified random sampling
D)Those responding to a survey or poll differ systematically from the non-respondents
A)The population has been divided into strata
B)Portions of the population are excluded from the sample
C)Cluster sampling is used instead of stratified random sampling
D)Those responding to a survey or poll differ systematically from the non-respondents
فتح الحزمة
افتح القفل للوصول البطاقات البالغ عددها 110 في هذه المجموعة.
فتح الحزمة
k this deck
36
What is the relationship between the expected value of the sample mean and the expected value of the population?
A)
B)
C)
D)
A)
B)
C)
D)
فتح الحزمة
افتح القفل للوصول البطاقات البالغ عددها 110 في هذه المجموعة.
فتح الحزمة
k this deck
37
A nursery sells trees of different types and heights.These trees average 60 inches in height with a standard deviation of 16 inches.Suppose that 75 pine trees are sold for planting at City Hall.What is the standard deviation for the sample mean?
A)1.85
B)3.41
C)4
D)16
A)1.85
B)3.41
C)4
D)16
فتح الحزمة
افتح القفل للوصول البطاقات البالغ عددها 110 في هذه المجموعة.
فتح الحزمة
k this deck
38
Over the entire six years that students attend an Ohio elementary school,they are absent,on average,28 days due to influenza.Assume that the standard deviation over this time period is days.Upon graduation from elementary school,a random sample of 36 students is taken and asked how many days of school they missed due to influenza. Refer to Exhibit 7-1.What is the expected value for the sampling distribution of the number of school days missed due to influenza?
A)6
B)9
C)28
D)168
days.Upon graduation from elementary school,a random sample of 36 students is taken and asked how many days of school they missed due to influenza. Refer to Exhibit 7-1.What is the expected value for the sampling distribution of the number of school days missed due to influenza?A)6
B)9
C)28
D)168
فتح الحزمة
افتح القفل للوصول البطاقات البالغ عددها 110 في هذه المجموعة.
فتح الحزمة
k this deck
39
Over the entire six years that students attend an Ohio elementary school,they are absent,on average,28 days due to influenza.Assume that the standard deviation over this time period is days.Upon graduation from elementary school,a random sample of 36 students is taken and asked how many days of school they missed due to influenza. Refer to Exhibit 7-1.What is the standard deviation for the sampling distribution of the number of school days missed due to influenza?
A)1.22
B)1.50
C)2.25
D)9.00
days.Upon graduation from elementary school,a random sample of 36 students is taken and asked how many days of school they missed due to influenza. Refer to Exhibit 7-1.What is the standard deviation for the sampling distribution of the number of school days missed due to influenza?A)1.22
B)1.50
C)2.25
D)9.00
فتح الحزمة
افتح القفل للوصول البطاقات البالغ عددها 110 في هذه المجموعة.
فتح الحزمة
k this deck
40
Which of the following is considered an estimator?
A)
B)µ
C)σ
D)σ2
A)
B)µ
C)σ
D)σ2
فتح الحزمة
افتح القفل للوصول البطاقات البالغ عددها 110 في هذه المجموعة.
فتح الحزمة
k this deck
41
Susan has been on a bowling team for 14 years.After examining all of her scores over that period of time,she finds that they follow a normal distribution.Her average score is 225,with a standard deviation of 13. Refer to Exhibit 7-3.What is the probability that in a one-game playoff,her score is more than 227?
A)0.2676
B)0.4404
C)0.5596
D)0.7324
A)0.2676
B)0.4404
C)0.5596
D)0.7324
فتح الحزمة
افتح القفل للوصول البطاقات البالغ عددها 110 في هذه المجموعة.
فتح الحزمة
k this deck
42
Suppose that,on average,electricians earn approximately dollars per year in the United States.Assume that the distribution for electrician's yearly earnings is normally distributed and that the standard deviation is dollars. Refer to Exhibit 7-2.What is the probability that the average salary of four randomly selected electricians is more than $50,000 but less than $60,000?
A)0.5899
B)0.7486
C)0.8413
D)0.9048
dollars per year in the United States.Assume that the distribution for electrician's yearly earnings is normally distributed and that the standard deviation is dollars. Refer to Exhibit 7-2.What is the probability that the average salary of four randomly selected electricians is more than $50,000 but less than $60,000?A)0.5899
B)0.7486
C)0.8413
D)0.9048
فتح الحزمة
افتح القفل للوصول البطاقات البالغ عددها 110 في هذه المجموعة.
فتح الحزمة
k this deck
43
The central limit theorem states that,for any distribution,as n gets larger,the sampling distribution of the sample mean ____________.
A)Becomes larger
B)Becomes smaller
C)Is closer to a normal distribution
D)Is closer to the standard deviation
A)Becomes larger
B)Becomes smaller
C)Is closer to a normal distribution
D)Is closer to the standard deviation
فتح الحزمة
افتح القفل للوصول البطاقات البالغ عددها 110 في هذه المجموعة.
فتح الحزمة
k this deck
44
Susan has been on a bowling team for 14 years.After examining all of her scores over that period of time,she finds that they follow a normal distribution.Her average score is 225,with a standard deviation of 13. Refer to Exhibit 7-3.If during a typical month Susan bowls 64 games,what is the probability that her average score in this month is above 227?
A)0.1093
B)0.4404
C)0.5596
D)0.8907
A)0.1093
B)0.4404
C)0.5596
D)0.8907
فتح الحزمة
افتح القفل للوصول البطاقات البالغ عددها 110 في هذه المجموعة.
فتح الحزمة
k this deck
45
Susan has been on a bowling team for 14 years.After examining all of her scores over that period of time,she finds that they follow a normal distribution.Her average score is 225,with a standard deviation of 13. Refer to Exhibit 7-3.If during a typical week Susan bowls 16 games,what is the probability that her average score is more than 230?
A)0.0618
B)0.3520
C)0.6480
D)0.9382
A)0.0618
B)0.3520
C)0.6480
D)0.9382
فتح الحزمة
افتح القفل للوصول البطاقات البالغ عددها 110 في هذه المجموعة.
فتح الحزمة
k this deck
46
Suppose that,on average,electricians earn approximately dollars per year in the United States.Assume that the distribution for electrician's yearly earnings is normally distributed and that the standard deviation is dollars. Refer to Exhibit 7-2.Given a sample of four electricians,what is the standard deviation for the sampling distribution of the sample mean?
A)6,000
B)12,000
C)36,000
D)54,000
dollars per year in the United States.Assume that the distribution for electrician's yearly earnings is normally distributed and that the standard deviation is dollars. Refer to Exhibit 7-2.Given a sample of four electricians,what is the standard deviation for the sampling distribution of the sample mean?A)6,000
B)12,000
C)36,000
D)54,000
فتح الحزمة
افتح القفل للوصول البطاقات البالغ عددها 110 في هذه المجموعة.
فتح الحزمة
k this deck
47
Suppose that,on average,electricians earn approximately dollars per year in the United States.Assume that the distribution for electrician's yearly earnings is normally distributed and that the standard deviation is dollars. Refer to Exhibit 7-2.What is the probability that the average salary of four randomly selected electricians exceeds $60,000?
A)0.1587
B)0.3085
C)0.6915
D)0.8413
dollars per year in the United States.Assume that the distribution for electrician's yearly earnings is normally distributed and that the standard deviation is dollars. Refer to Exhibit 7-2.What is the probability that the average salary of four randomly selected electricians exceeds $60,000?A)0.1587
B)0.3085
C)0.6915
D)0.8413
فتح الحزمة
افتح القفل للوصول البطاقات البالغ عددها 110 في هذه المجموعة.
فتح الحزمة
k this deck
48
Professor Elderman has given the same multiple choice final exam in his Principles of Microeconomics class for many years.After examining his records from the past 10 years,he finds that the scores have a mean of 76 and a standard deviation of 12. Refer to Exhibit 7-4.What is the probability that a class of 36 students will have an average greater than 70 on Professor Elderman's final exam?
A)0.0014
B)0.3085
C)0.6915
D)0.9986
A)0.0014
B)0.3085
C)0.6915
D)0.9986
فتح الحزمة
افتح القفل للوصول البطاقات البالغ عددها 110 في هذه المجموعة.
فتح الحزمة
k this deck
49
Professor Elderman has given the same multiple choice final exam in his Principles of Microeconomics class for many years.After examining his records from the past 10 years,he finds that the scores have a mean of 76 and a standard deviation of 12. Refer to Exhibit 7-4.Professor Elderman offers his class of 36 a pizza party if the class average is above 80.What is the probability that he will have to deliver on his promise?
A)0.0228
B)0.3707
C)0.6293
D)0.9772
A)0.0228
B)0.3707
C)0.6293
D)0.9772
فتح الحزمة
افتح القفل للوصول البطاقات البالغ عددها 110 في هذه المجموعة.
فتح الحزمة
k this deck
50
A random sample of size 36 is taken from a population with mean and standard deviation . Refer to Exhibit 7-5.The probability that the sample mean is between 15 and 18 is _______.
A)0.0228
B)0.8185
C)0.8413
D)0.8641
and standard deviation . Refer to Exhibit 7-5.The probability that the sample mean is between 15 and 18 is _______.A)0.0228
B)0.8185
C)0.8413
D)0.8641
فتح الحزمة
افتح القفل للوصول البطاقات البالغ عددها 110 في هذه المجموعة.
فتح الحزمة
k this deck
51
Susan has been on a bowling team for 14 years.After examining all of her scores over that period of time,she finds that they follow a normal distribution.Her average score is 225,with a standard deviation of 13. Refer to Exhibit 7-3.If during a typical week Susan bowls 16 games,what is the probability that her average score for the week is between 220 and 228?
A)0.0618
B)0.2390
C)0.7594
D)0.8212
A)0.0618
B)0.2390
C)0.7594
D)0.8212
فتح الحزمة
افتح القفل للوصول البطاقات البالغ عددها 110 في هذه المجموعة.
فتح الحزمة
k this deck
52
According to the central limit theorem,the distribution of the sample means is normal if _______________.
A)The underlying population is normal
B)The sample size
C)If the standard deviation of the population is known
D)Both A and B are correct
A)The underlying population is normal
B)The sample size
C)If the standard deviation of the population is known
D)Both A and B are correct
فتح الحزمة
افتح القفل للوصول البطاقات البالغ عددها 110 في هذه المجموعة.
فتح الحزمة
k this deck
53
Using the central limit theorem,applied to the sampling distribution of the sample proportion,what conditions must be met?
A)
B)
C)
D)
A)
B)
C)
D)
فتح الحزمة
افتح القفل للوصول البطاقات البالغ عددها 110 في هذه المجموعة.
فتح الحزمة
k this deck
54
A random sample of size 36 is taken from a population with mean and standard deviation . Refer to Exhibit 7-5.The probability that the sample mean is greater than 18 is _______.
A)0.1587
B)0.4325
C)0.5675
D)0.8413
and standard deviation . Refer to Exhibit 7-5.The probability that the sample mean is greater than 18 is _______.A)0.1587
B)0.4325
C)0.5675
D)0.8413
فتح الحزمة
افتح القفل للوصول البطاقات البالغ عددها 110 في هذه المجموعة.
فتح الحزمة
k this deck
55
Professor Elderman has given the same multiple choice final exam in his Principles of Microeconomics class for many years.After examining his records from the past 10 years,he finds that the scores have a mean of 76 and a standard deviation of 12. Refer to Exhibit 7-4.What is the probability that a class of 15 students will have a class average greater than 70 on Professor Elderman's final exam?
A)0.0262
B)0.6915
C)0.9738
D)Cannot be determineD.
A)0.0262
B)0.6915
C)0.9738
D)Cannot be determineD.
فتح الحزمة
افتح القفل للوصول البطاقات البالغ عددها 110 في هذه المجموعة.
فتح الحزمة
k this deck
56
A random sample of size 100 is taken from a population described by the proportion . Refer to Exhibit 7-6.What is the expected value and the standard deviation for the sampling distribution of the sample proportion?
A)Option A
B)Option B
C)Option C
D)Option D
. Refer to Exhibit 7-6.What is the expected value and the standard deviation for the sampling distribution of the sample proportion? A)Option A
B)Option B
C)Option C
D)Option D
فتح الحزمة
افتح القفل للوصول البطاقات البالغ عددها 110 في هذه المجموعة.
فتح الحزمة
k this deck
57
A random sample of size 36 is taken from a population with mean and standard deviation . Refer to Exhibit 7-5.What is the expected value and the standard deviation for the sampling distribution of the sample mean?
A)Option A
B)Option B
C)Option C
D)Option D
and standard deviation . Refer to Exhibit 7-5.What is the expected value and the standard deviation for the sampling distribution of the sample mean? A)Option A
B)Option B
C)Option C
D)Option D
فتح الحزمة
افتح القفل للوصول البطاقات البالغ عددها 110 في هذه المجموعة.
فتح الحزمة
k this deck
58
Suppose that,on average,electricians earn approximately dollars per year in the United States.Assume that the distribution for electrician's yearly earnings is normally distributed and that the standard deviation is dollars. Refer to Exhibit 7-2.What is the probability that the average salary of four randomly selected electricians is less than $50,000?
A)0.2514
B)0.3707
C)0.6293
D)0.7486
dollars per year in the United States.Assume that the distribution for electrician's yearly earnings is normally distributed and that the standard deviation is dollars. Refer to Exhibit 7-2.What is the probability that the average salary of four randomly selected electricians is less than $50,000?A)0.2514
B)0.3707
C)0.6293
D)0.7486
فتح الحزمة
افتح القفل للوصول البطاقات البالغ عددها 110 في هذه المجموعة.
فتح الحزمة
k this deck
59
A random sample of size 36 is taken from a population with mean and standard deviation . Refer to Exhibit 7-5.The probability that the sample mean is less than 15 is ________.
A)0.0228
B)0.3707
C)0.6293
D)0.9772
and standard deviation . Refer to Exhibit 7-5.The probability that the sample mean is less than 15 is ________.A)0.0228
B)0.3707
C)0.6293
D)0.9772
فتح الحزمة
افتح القفل للوصول البطاقات البالغ عددها 110 في هذه المجموعة.
فتح الحزمة
k this deck
60
Professor Elderman has given the same multiple choice final exam in his Principles of Microeconomics class for many years.After examining his records from the past 10 years,he finds that the scores have a mean of 76 and a standard deviation of 12. Refer to Exhibit 7-4.What is the probability Professor Elderman's class of 36 has a class average below 78?
A)0.1587
B)0.5675
C)0.8413
D)Cannot be determineD.
A)0.1587
B)0.5675
C)0.8413
D)Cannot be determineD.
فتح الحزمة
افتح القفل للوصول البطاقات البالغ عددها 110 في هذه المجموعة.
فتح الحزمة
k this deck
61
According to the 2011 Gallup daily tracking polls (www.gallup.com,February 3,2012),Mississippi is the most conservative U.S.state,with 53.4 percent of its residents identifying themselves as conservative. Refer to Exhibit 7-10.What is the probability that at least 50 respondents of a random sample of 100 Mississippi residents do NOT identify themselves as conservative?
A)0.0499
B)0.2483
C)0.4966
D)0.7517
A)0.0499
B)0.2483
C)0.4966
D)0.7517
فتح الحزمة
افتح القفل للوصول البطاقات البالغ عددها 110 في هذه المجموعة.
فتح الحزمة
k this deck
62
The labor force participation rate is the number of people in the labor force divided by the number of people in the country that are of working age and not institutionalized.The BLS reported in February of 2012 that the labor force participation rate in the United States was 63.7% (Calculatedrisk.com).A marketing company asks 120 working-age people if they either have a job or are looking for a job,or,in other words,whether they are in the labor force. Refer to Exhibit 7-8.For the company's sample,the probability that the proportion of people who are in the labor force is greater than 0.65 is ___________.
A)0.1179
B)0.3000
C)0.3821
D)0.6179
A)0.1179
B)0.3000
C)0.3821
D)0.6179
فتح الحزمة
افتح القفل للوصول البطاقات البالغ عددها 110 في هذه المجموعة.
فتح الحزمة
k this deck
63
The labor force participation rate is the number of people in the labor force divided by the number of people in the country that are of working age and not institutionalized.The BLS reported in February of 2012 that the labor force participation rate in the United States was 63.7% (Calculatedrisk.com).A marketing company asks 120 working-age people if they either have a job or are looking for a job,or,in other words,whether they are in the labor force. Refer to Exhibit 7-8.What is the expected value and the standard deviation for a labor participation rate in the company's sample?
A)Option A
B)Option B
C)Option C
D)Option D
A)Option A
B)Option B
C)Option C
D)Option D
فتح الحزمة
افتح القفل للوصول البطاقات البالغ عددها 110 في هذه المجموعة.
فتح الحزمة
k this deck
64
Super Bowl XLVI was played between the New York Giants and the New England Patriots in Indianapolis.Due to a decade-long rivalry between the Patriots and the city's own team,the Colts,most Indianapolis residents were rooting heartily for the Giants.Suppose that 90% of Indianapolis residents wanted the Giants to beat the Patriots. Refer to Exhibit 7-9.What is the probability that from a sample of 200 Indianapolis residents,fewer than 170 were rooting for the Giants in Super Bowl XLIV?
A)0.0091
B)0.0212
C)0.4954
D)0.9908
A)0.0091
B)0.0212
C)0.4954
D)0.9908
فتح الحزمة
افتح القفل للوصول البطاقات البالغ عددها 110 في هذه المجموعة.
فتح الحزمة
k this deck
65
A random sample of size 100 is taken from a population described by the proportion . Refer to Exhibit 7-6.The probability that the sample proportion is between 0.55 and 0.62 is __________.
A)0.1539
B)0.5052
C)0.6591
D)0.8130
. Refer to Exhibit 7-6.The probability that the sample proportion is between 0.55 and 0.62 is __________.A)0.1539
B)0.5052
C)0.6591
D)0.8130
فتح الحزمة
افتح القفل للوصول البطاقات البالغ عددها 110 في هذه المجموعة.
فتح الحزمة
k this deck
66
Suppose 35% of homes in a Miami,Florida,neighborhood are under water (in other words,the amount due on the mortgage is larger than the value of the home).There are 160 homes in the neighborhood and 30 of those homes are owned by your friends.What is the probability that less than 30% of your friend's homes are under water?
A)0.2611
B)0.2843
C)0.6400
D)0.7389
A)0.2611
B)0.2843
C)0.6400
D)0.7389
فتح الحزمة
افتح القفل للوصول البطاقات البالغ عددها 110 في هذه المجموعة.
فتح الحزمة
k this deck
67
A random sample of size 100 is taken from a population described by the proportion . Refer to Exhibit 7-6.The probability that the sample proportion is greater than 0.62 is _______.
A)0.3409
B)0.4082
C)0.6591
D)
. Refer to Exhibit 7-6.The probability that the sample proportion is greater than 0.62 is _______.A)0.3409
B)0.4082
C)0.6591
D)
فتح الحزمة
افتح القفل للوصول البطاقات البالغ عددها 110 في هذه المجموعة.
فتح الحزمة
k this deck
68
According to the 2011 Gallup daily tracking polls (www.gallup.com,February 3,2012),Mississippi is the most conservative U.S.state,with 53.4 percent of its residents identifying themselves as conservative. Refer to Exhibit 7-10.What is the probability that at least 60% of a random sample of 200 Mississippi residents identify themselves as conservative?
A)0.0307
B)0.3530
C)0.4847
D)0.9693
A)0.0307
B)0.3530
C)0.4847
D)0.9693
فتح الحزمة
افتح القفل للوصول البطاقات البالغ عددها 110 في هذه المجموعة.
فتح الحزمة
k this deck
69
Successful firms must focus on the quality of the products and services that they offer.Which factor(s)contributes to the quest for quality?
A)Global competition
B)Consumer expectations
C)Technological advances
D)All of the above
A)Global competition
B)Consumer expectations
C)Technological advances
D)All of the above
فتح الحزمة
افتح القفل للوصول البطاقات البالغ عددها 110 في هذه المجموعة.
فتح الحزمة
k this deck
70
Super Bowl XLVI was played between the New York Giants and the New England Patriots in Indianapolis.Due to a decade-long rivalry between the Patriots and the city's own team,the Colts,most Indianapolis residents were rooting heartily for the Giants.Suppose that 90% of Indianapolis residents wanted the Giants to beat the Patriots. Refer to Exhibit 7-9.What is the probability that,of a sample of 100 Indianapolis residents,at least 15% were rooting for the Patriots in Super Bowl XLVI?
A)0.0300
B)0.0475
C)0.4763
D)0.9525
A)0.0300
B)0.0475
C)0.4763
D)0.9525
فتح الحزمة
افتح القفل للوصول البطاقات البالغ عددها 110 في هذه المجموعة.
فتح الحزمة
k this deck
71
The labor force participation rate is the number of people in the labor force divided by the number of people in the country that are of working age and not institutionalized.The BLS reported in February of 2012 that the labor force participation rate in the United States was 63.7% (Calculatedrisk.com).A marketing company asks 120 working-age people if they either have a job or are looking for a job,or,in other words,whether they are in the labor force. Refer to Exhibit 7-8.What is the probability that between 60% and 62.5% of those surveyed are members of the labor force?
A)0.0243
B)0.1931
C)0.2005
D)0.3936
A)0.0243
B)0.1931
C)0.2005
D)0.3936
فتح الحزمة
افتح القفل للوصول البطاقات البالغ عددها 110 في هذه المجموعة.
فتح الحزمة
k this deck
72
According to the 2011 Gallup daily tracking polls (www.gallup.com,February 3,2012),Mississippi is the most conservative U.S.state,with 53.4 percent of its residents identifying themselves as conservative. Refer to Exhibit 7-10.What is the probability that at least 100 but fewer than 115 respondents of a random sample of 200 Mississippi residents identify as conservative?
A)0.1685
B)0.3370
C)0.7085
D)0.8770
A)0.1685
B)0.3370
C)0.7085
D)0.8770
فتح الحزمة
افتح القفل للوصول البطاقات البالغ عددها 110 في هذه المجموعة.
فتح الحزمة
k this deck
73
The labor force participation rate is the number of people in the labor force divided by the number of people in the country that are of working age and not institutionalized.The BLS reported in February of 2012 that the labor force participation rate in the United States was 63.7% (Calculatedrisk.com).A marketing company asks 120 working-age people if they either have a job or are looking for a job,or,in other words,whether they are in the labor force. Refer to Exhibit 7-8.What is the probability that less than 60% of those surveyed are members of the labor force?
A)0.2005
B)0.7995
C)0.8400
D)0.9706
A)0.2005
B)0.7995
C)0.8400
D)0.9706
فتح الحزمة
افتح القفل للوصول البطاقات البالغ عددها 110 في هذه المجموعة.
فتح الحزمة
k this deck
74
A local company makes snack size bags of potato chips.Each day,the company produces batches of 400 snack size bags using a process designed to fill each bag with an average of 2 ounces of potato chips.However,due to imperfect technology,the actual amount placed in a given bag varies.Assume the amount placed in each of the 400 bags is normally distributed and has a standard deviation of 0.1 ounces.What is the probability that a sample of 40 bags has an average weight of at least 2.02 ounces?
A)0.0150
B)0.0918
C)0.1038
D)0.4207
A)0.0150
B)0.0918
C)0.1038
D)0.4207
فتح الحزمة
افتح القفل للوصول البطاقات البالغ عددها 110 في هذه المجموعة.
فتح الحزمة
k this deck
75
Super Bowl XLVI was played between the New York Giants and the New England Patriots in Indianapolis.Due to a decade-long rivalry between the Patriots and the city's own team,the Colts,most Indianapolis residents were rooting heartily for the Giants.Suppose that 90% of Indianapolis residents wanted the Giants to beat the Patriots. Refer to Exhibit 7-9.What is the probability that from a sample of 100 Indianapolis residents,fewer than 95% were rooting for the Giants in Super Bowl XLVI?
A)0.0300
B)0.0475
C)0.4763
D)0.9525
A)0.0300
B)0.0475
C)0.4763
D)0.9525
فتح الحزمة
افتح القفل للوصول البطاقات البالغ عددها 110 في هذه المجموعة.
فتح الحزمة
k this deck
76
According to the 2011 Gallup daily tracking polls (www.gallup.com,February 3,2012),Mississippi is the most conservative U.S.state,with 53.4 percent of its residents identifying themselves as conservative. Refer to Exhibit 7-10.What is the probability that fewer than 45 respondents of a random sample of 100 Mississippi residents do NOT identify themselves as conservative?
A)0.0499
B)0.1873
C)0.3745
D)0.6255
A)0.0499
B)0.1873
C)0.3745
D)0.6255
فتح الحزمة
افتح القفل للوصول البطاقات البالغ عددها 110 في هذه المجموعة.
فتح الحزمة
k this deck
77
The finite correction factor is always _________________.
A)Less than one,and therefore increases the standard deviations of and
computed under the assumption of infinite population
B)Less than one,and therefore decreases the standard deviations of and
computed under the assumption of infinite population
C)Greater than one,and therefore increases the standard deviations of and
computed under the assumption of infinite population
D)Greater than one,and therefore decreases the standard deviations of
A)Less than one,and therefore increases the standard deviations of
and computed under the assumption of infinite populationB)Less than one,and therefore decreases the standard deviations of
and computed under the assumption of infinite populationC)Greater than one,and therefore increases the standard deviations of
and computed under the assumption of infinite populationD)Greater than one,and therefore decreases the standard deviations of
فتح الحزمة
افتح القفل للوصول البطاقات البالغ عددها 110 في هذه المجموعة.
فتح الحزمة
k this deck
78
Under what condition is the finite population correction factor used for computing the standard deviations of and ?
A)
B)
C)
D)
and ?A)
B)
C)
D)
فتح الحزمة
افتح القفل للوصول البطاقات البالغ عددها 110 في هذه المجموعة.
فتح الحزمة
k this deck
79
A random sample of size 100 is taken from a population described by the proportion . Refer to Exhibit 7-6.The probability that the sample proportion is less than 0.55 is ________.
A)
B)0.1539
C)0.3669
D)0.8461
. Refer to Exhibit 7-6.The probability that the sample proportion is less than 0.55 is ________.A)
B)0.1539
C)0.3669
D)0.8461
فتح الحزمة
افتح القفل للوصول البطاقات البالغ عددها 110 في هذه المجموعة.
فتح الحزمة
k this deck
80
Super Bowl XLVI was played between the New York Giants and the New England Patriots in Indianapolis.Due to a decade-long rivalry between the Patriots and the city's own team,the Colts,most Indianapolis residents were rooting heartily for the Giants.Suppose that 90% of Indianapolis residents wanted the Giants to beat the Patriots. Refer to Exhibit 7-9.What is the probability that from a sample of 40 Indianapolis residents,fewer than 95% were rooting for the Giants in Super Bowl XLIV?
A)0.0474
B)0.1469
C)0.8531
D)Cannot be determined
A)0.0474
B)0.1469
C)0.8531
D)Cannot be determined
فتح الحزمة
افتح القفل للوصول البطاقات البالغ عددها 110 في هذه المجموعة.
فتح الحزمة
k this deck
فتح الحزمة
افتح القفل للوصول البطاقات البالغ عددها 110 في هذه المجموعة.


