Deck 10: Basic Macroeconomic Relationships
ملء الشاشة (f)
سؤال
سؤال
 Refer to the consumption schedule above. The break-even level of income would be at income level:
A) 0
B) 1
C) 2
D) 3
سؤال
سؤال
سؤال
سؤال
سؤال
سؤال
سؤال
سؤال
سؤال
سؤال
 Refer to the consumption schedule above. At income level 3, the amount of saving is represented by the line segment:
A) FG
B) FH
C) FD
D) GH
سؤال
 Refer to the consumption schedule above. As income falls from level 3 to level 2, the amount of:
A) Consumption increases and the amount of dissaving increases
B) Consumption decreases and the amount of dissaving decreases
C) Consumption decreases and the amount of saving decreases
D) Consumption decreases and the amount of saving increases
سؤال
سؤال
 Refer to the consumption schedule above. At income level 1, the amount of saving is:
A) Positive
B) Negative
C) Zero
D) Not measurable
سؤال
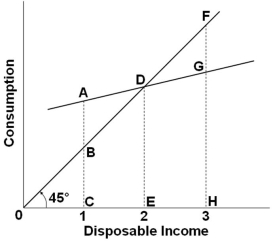 Refer to the consumption schedule above. Disposable income equals consumption at point:
A) A
B) C
C) D
D) G
سؤال
سؤال
 Refer to the consumption schedule above. At income level 3, the amount of consumption is represented by the line segment:
A) FG
B) FH
C) FD
D) GH
سؤال
سؤال
سؤال
سؤال
سؤال
سؤال
 Refer to the saving schedule above. The break-even income would be level:
A) 0
B) 1
C) 2
D) 3
سؤال
سؤال
سؤال
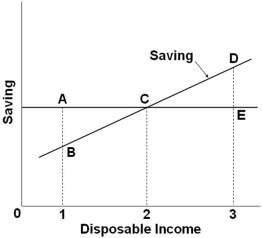 Refer to the saving schedule above. Dissaving occurs when disposable income is:
A) Equal to level 2
B) Less than level 2
C) Greater than level 2
D) Equal to level 3
سؤال
سؤال
سؤال
سؤال
سؤال
سؤال
سؤال
سؤال
سؤال
سؤال
سؤال
 Refer to the saving schedule above. As income falls from level 3 to level 2, the amount of:
A) Dissaving decreases
B) Dissaving increases
C) Saving decreases
D) Saving increases
سؤال
سؤال
سؤال
سؤال
The table shows a consumption schedule.  Refer to the data above. If disposable income is $550, we would expect consumption to be:
A) $430
B) $450
C) $460
D) $470
Refer to the data above. If disposable income is $550, we would expect consumption to be:A) $430
B) $450
C) $460
D) $470
سؤال
The table shows a consumption schedule.  Refer to the data above. At the $300 level of disposable income:
A) The marginal propensity to save is .80
B) The average propensity to consume is .60
C) The average propensity to save is .30
D) There is a dissaving of $10
Refer to the data above. At the $300 level of disposable income:A) The marginal propensity to save is .80
B) The average propensity to consume is .60
C) The average propensity to save is .30
D) There is a dissaving of $10
سؤال
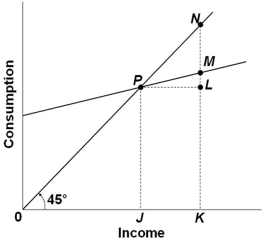 The graph above shows the relationship between consumption and income. The ratio LM/PL would be a measure of the:
A) Marginal propensity to consume
B) Marginal propensity to save
C) Average propensity to consume
D) Average propensity to save
سؤال
The table shows a consumption schedule. 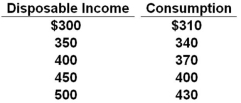 Refer to the data above. The marginal propensity to consume is:
A) .80
B) .75
C) .60
D) .40
Refer to the data above. The marginal propensity to consume is:A) .80
B) .75
C) .60
D) .40
سؤال
 The graph above shows the relationship between consumption and income. Which of the following statements is correct?
A) The marginal propensity to consume in the economy shown is greater than 1
B) The marginal propensity to consume varies across income levels
C) The average propensity to consume at income level K is given by KM divided by KN
D) The marginal propensity to consume can be calculated by dividing LM by 0K
سؤال
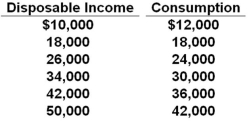
 Refer to the consumption schedule above. If disposable income is $42,000, then saving is:
A) $0
B) $2,000
C) $4,000
D) $6,000
سؤال
سؤال
The disposable income (DI) and consumption (C) schedules are for a private, closed economy. All figures are in billions of dollars. 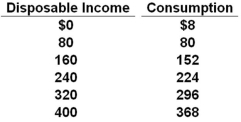 Refer to the data above. If consumption increases by $10 billion at each level of disposable income, the marginal propensity to consume will:
A) Change, but the average propensity to consume will not change
B) Change, and the average propensity to consume will change
C) Not change, but the average propensity to consume will change
D) Not change, and the average propensity to consume will not change
Refer to the data above. If consumption increases by $10 billion at each level of disposable income, the marginal propensity to consume will:A) Change, but the average propensity to consume will not change
B) Change, and the average propensity to consume will change
C) Not change, but the average propensity to consume will change
D) Not change, and the average propensity to consume will not change
سؤال
 Refer to the consumption schedule above. The average propensity to save at income level B is represented by:
A) 0C/0B
B) EF/BE
C) EF/BF
D) DE/AB
سؤال
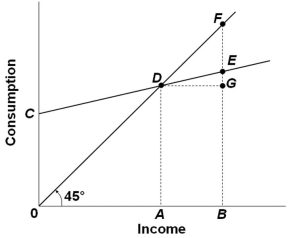 Refer to the consumption schedule above. The marginal propensity to consume is represented by:
A) GF/BE
B) EF/BE
C) GE/AB
D) DE/AB
سؤال
 Refer to the consumption schedule above. The marginal propensity to consume is:
A) .60
B) .75
C) .80
D) .20
سؤال
سؤال
The disposable income (DI) and consumption (C) schedules are for a private, closed economy. All figures are in billions of dollars.  Refer to the data above. At the $320 billion level of disposable income, the average propensity to save is:
A) .015
B) .075
C) .335
D) .925
Refer to the data above. At the $320 billion level of disposable income, the average propensity to save is:A) .015
B) .075
C) .335
D) .925
سؤال
The disposable income (DI) and consumption (C) schedules are for a private, closed economy. All figures are in billions of dollars.  Refer to the data above. The marginal propensity to save in this economy is:
A) .1
B) .72
C) .8
D) .9
Refer to the data above. The marginal propensity to save in this economy is:A) .1
B) .72
C) .8
D) .9
سؤال
 Refer to the consumption schedule above. If disposable income were $34,000, then the average propensity to save would be about:
A) .75
B) .88
C) .25
D) .12
سؤال
سؤال
سؤال
The disposable income (DI) and consumption (C) schedules are for a private, closed economy. All figures are in billions of dollars.  Refer to the data above. If plotted on a graph, the slope of the consumption schedule would be:
A) .6
B) .7
C) .8
D) .9
Refer to the data above. If plotted on a graph, the slope of the consumption schedule would be:A) .6
B) .7
C) .8
D) .9
سؤال
سؤال
سؤال
سؤال
سؤال
سؤال
 Refer to the above figures with consumption schedules in figure (A) and saving schedules in figure (B), which correspond to each other across different levels of disposable income. If, in figure (A), consumption increases along line A2 then in figure (B) there would be:
A) A shift from line B2 to B3
B) A shift from line B2 to B1
C) A movement down along line B2
D) A movement up along line B2
سؤال
سؤال
سؤال
سؤال
سؤال
سؤال
سؤال
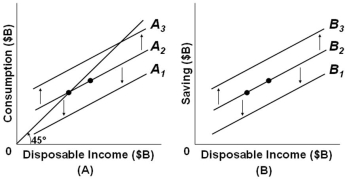 Refer to the above figures with consumption schedules in figure (A) and saving schedules in figure (B), which correspond to each other across different levels of disposable income. If, in figure (A), line A2 shifts to A3 because of the so-called wealth effect, then in figure (B) line:
A) B2 will shift to B3
B) B1 will shift to B2
C) B2 will shift to B1
D) B3 will shift to B2
سؤال
 Refer to the above figures with consumption schedules in figure (A) and saving schedules in figure (B), which correspond to each other across different levels of disposable income. If, in figure (A), consumption shifts from A2 to A3 because of a change in taxes, then in figure (B) line:
A) B2 will shift to B3
B) B1 will shift to B2
C) B2 will shift to B1
D) B3 will shift to B2
سؤال
سؤال
سؤال
سؤال
سؤال
سؤال
سؤال

فتح الحزمة
قم بالتسجيل لفتح البطاقات في هذه المجموعة!
Unlock Deck
Unlock Deck
1/142
العب
ملء الشاشة (f)
Deck 10: Basic Macroeconomic Relationships
1
The slope of the consumption schedule between two points on the schedule is:
A) The ratio of the change in consumption to the change in disposable income between those two points
B) The ratio of the change in disposable income over the change in consumption between those two points
C) Equivalent to one plus the marginal propensity to save
D) Equivalent to the average propensity to consume
The ratio of the change in consumption to the change in disposable income between those two points
2
Refer to the consumption schedule above. The break-even level of income would be at income level:A) 0
B) 1
C) 2
D) 3
2
3
As disposable income decreases, the:
A) Average propensity to consume increases
B) Average propensity to consume decreases
C) Level of consumption increases
D) Level of saving increases
A) Average propensity to consume increases
B) Average propensity to consume decreases
C) Level of consumption increases
D) Level of saving increases
Average propensity to consume increases
4
When the consumption schedule is plotted on a graph:
A) Consumption is on the horizontal axis and saving is on the vertical axis
B) Consumption is on the vertical axis and saving is on the horizontal axis
C) Consumption is on the horizontal axis and disposable income is on the vertical axis
D) Consumption is on the vertical axis and disposable income is on the horizontal axis
فتح الحزمة
افتح القفل للوصول البطاقات البالغ عددها 142 في هذه المجموعة.
فتح الحزمة
k this deck
5
When a consumption schedule is plotted as a straight line, the slope of the consumption line is:
A) Vertical
B) Horizontal
C) Greater than the slope of the 45° line
D) Less than the slope of the 45° line
A) Vertical
B) Horizontal
C) Greater than the slope of the 45° line
D) Less than the slope of the 45° line
فتح الحزمة
افتح القفل للوصول البطاقات البالغ عددها 142 في هذه المجموعة.
فتح الحزمة
k this deck
6
The consumption schedule shows the relationship of household consumption to the level of:
A) Saving
B) Investment
C) Disposable income
D) The marginal propensity to consume
A) Saving
B) Investment
C) Disposable income
D) The marginal propensity to consume
فتح الحزمة
افتح القفل للوصول البطاقات البالغ عددها 142 في هذه المجموعة.
فتح الحزمة
k this deck
7
If consumption increases while income remains the same, the average propensity to consume will:
A) Increase and then decrease
B) Remain constant
C) Increase
D) Decrease
A) Increase and then decrease
B) Remain constant
C) Increase
D) Decrease
فتح الحزمة
افتح القفل للوصول البطاقات البالغ عددها 142 في هذه المجموعة.
فتح الحزمة
k this deck
8
If disposable income is $900 billion when the average propensity to consume is 0.9, it can be concluded that:
A) The marginal propensity to consume is also 0.9
B) The marginal propensity to save is 0.1
C) Consumption is $900 billion
D) Saving is $90 billion
A) The marginal propensity to consume is also 0.9
B) The marginal propensity to save is 0.1
C) Consumption is $900 billion
D) Saving is $90 billion
فتح الحزمة
افتح القفل للوصول البطاقات البالغ عددها 142 في هذه المجموعة.
فتح الحزمة
k this deck
9
If there is a decrease in disposable income in an economy, then:
A) Both the APC and the APS rise
B) The APC rises and the APS falls
C) The APC falls and the APS rises
D) Both the APC and the APS fall
A) Both the APC and the APS rise
B) The APC rises and the APS falls
C) The APC falls and the APS rises
D) Both the APC and the APS fall
فتح الحزمة
افتح القفل للوصول البطاقات البالغ عددها 142 في هذه المجموعة.
فتح الحزمة
k this deck
10
An increase in disposable income:
A) Increases consumption because it shifts the consumption schedule upward
B) Decreases consumption because it shifts the consumption schedule downward
C) Increases consumption by moving upward along a given consumption schedule
D) Decreases consumption by moving downward along a given consumption schedule
فتح الحزمة
افتح القفل للوصول البطاقات البالغ عددها 142 في هذه المجموعة.
فتح الحزمة
k this deck
11
The fraction, or percentage, of total income which is consumed is called the:
A) Break-even income
B) Consumption schedule
C) Marginal propensity to consume
D) Average propensity to consume
A) Break-even income
B) Consumption schedule
C) Marginal propensity to consume
D) Average propensity to consume
فتح الحزمة
افتح القفل للوصول البطاقات البالغ عددها 142 في هذه المجموعة.
فتح الحزمة
k this deck
12
Refer to the consumption schedule above. At income level 3, the amount of saving is represented by the line segment:A) FG
B) FH
C) FD
D) GH
فتح الحزمة
افتح القفل للوصول البطاقات البالغ عددها 142 في هذه المجموعة.
فتح الحزمة
k this deck
13
Refer to the consumption schedule above. As income falls from level 3 to level 2, the amount of:A) Consumption increases and the amount of dissaving increases
B) Consumption decreases and the amount of dissaving decreases
C) Consumption decreases and the amount of saving decreases
D) Consumption decreases and the amount of saving increases
فتح الحزمة
افتح القفل للوصول البطاقات البالغ عددها 142 في هذه المجموعة.
فتح الحزمة
k this deck
14
The MPC can be defined as the:
A) Change in consumption divided by the change in income
B) Change in income divided by the change in consumption
C) Ratio of income to saving
D) Ratio of saving to consumption
A) Change in consumption divided by the change in income
B) Change in income divided by the change in consumption
C) Ratio of income to saving
D) Ratio of saving to consumption
فتح الحزمة
افتح القفل للوصول البطاقات البالغ عددها 142 في هذه المجموعة.
فتح الحزمة
k this deck
15
Refer to the consumption schedule above. At income level 1, the amount of saving is:A) Positive
B) Negative
C) Zero
D) Not measurable
فتح الحزمة
افتح القفل للوصول البطاقات البالغ عددها 142 في هذه المجموعة.
فتح الحزمة
k this deck
16
Refer to the consumption schedule above. Disposable income equals consumption at point:A) A
B) C
C) D
D) G
فتح الحزمة
افتح القفل للوصول البطاقات البالغ عددها 142 في هذه المجموعة.
فتح الحزمة
k this deck
17
The amount of consumption in an economy correlates:
A) Inversely with the level of disposable income
B) Directly with the level of disposable income
C) Directly with the level of saving
D) Directly with the rate of interest
A) Inversely with the level of disposable income
B) Directly with the level of disposable income
C) Directly with the level of saving
D) Directly with the rate of interest
فتح الحزمة
افتح القفل للوصول البطاقات البالغ عددها 142 في هذه المجموعة.
فتح الحزمة
k this deck
18
Refer to the consumption schedule above. At income level 3, the amount of consumption is represented by the line segment:A) FG
B) FH
C) FD
D) GH
فتح الحزمة
افتح القفل للوصول البطاقات البالغ عددها 142 في هذه المجموعة.
فتح الحزمة
k this deck
19
Personal saving is equal to:
A) Disposable income plus consumption
B) Consumption minus disposable income
C) Disposable income minus consumption
D) Consumption divided by disposable income
A) Disposable income plus consumption
B) Consumption minus disposable income
C) Disposable income minus consumption
D) Consumption divided by disposable income
فتح الحزمة
افتح القفل للوصول البطاقات البالغ عددها 142 في هذه المجموعة.
فتح الحزمة
k this deck
20
As disposable income decreases, consumption:
A) And saving both increase
B) And saving both decrease
C) Increases and saving decreases
D) Decreases and saving increases
A) And saving both increase
B) And saving both decrease
C) Increases and saving decreases
D) Decreases and saving increases
فتح الحزمة
افتح القفل للوصول البطاقات البالغ عددها 142 في هذه المجموعة.
فتح الحزمة
k this deck
21
The fraction, or percentage, of total income which is saved is called the:
A) Average propensity to save
B) Marginal propensity to save
C) Disposable income schedule
D) Saving schedule
A) Average propensity to save
B) Marginal propensity to save
C) Disposable income schedule
D) Saving schedule
فتح الحزمة
افتح القفل للوصول البطاقات البالغ عددها 142 في هذه المجموعة.
فتح الحزمة
k this deck
22
The saving schedule shows the relationship of saving of households to the level of:
A) Consumption
B) Investment
C) Disposable income
D) The average propensity to save
A) Consumption
B) Investment
C) Disposable income
D) The average propensity to save
فتح الحزمة
افتح القفل للوصول البطاقات البالغ عددها 142 في هذه المجموعة.
فتح الحزمة
k this deck
23
In an economy, for every $1600 decrease in income, spending falls by $1200. It can be concluded that the:
A) Slope of the saving schedule is 1.33
B) Slope of the saving schedule is 0.75
C) Marginal propensity to consume is 1.33
D) Marginal propensity to save is .25
A) Slope of the saving schedule is 1.33
B) Slope of the saving schedule is 0.75
C) Marginal propensity to consume is 1.33
D) Marginal propensity to save is .25
فتح الحزمة
افتح القفل للوصول البطاقات البالغ عددها 142 في هذه المجموعة.
فتح الحزمة
k this deck
24
Refer to the saving schedule above. The break-even income would be level:A) 0
B) 1
C) 2
D) 3
فتح الحزمة
افتح القفل للوصول البطاقات البالغ عددها 142 في هذه المجموعة.
فتح الحزمة
k this deck
25
If Matt's disposable income increases from $4,000 to $4,500 and his level of saving increases from $200 to $325, it may be concluded that his marginal propensity to:
A) Consume is .80
B) Consume is .75
C) Consume is .60
D) Save is .30
A) Consume is .80
B) Consume is .75
C) Consume is .60
D) Save is .30
فتح الحزمة
افتح القفل للوصول البطاقات البالغ عددها 142 في هذه المجموعة.
فتح الحزمة
k this deck
26
If disposable income decreases from $1800 to $1500 and MPC = 0.75, then saving will:
A) Increase by $225
B) Decrease by $225
C) Increase by $75
D) Decrease by $75
A) Increase by $225
B) Decrease by $225
C) Increase by $75
D) Decrease by $75
فتح الحزمة
افتح القفل للوصول البطاقات البالغ عددها 142 في هذه المجموعة.
فتح الحزمة
k this deck
27
Refer to the saving schedule above. Dissaving occurs when disposable income is:A) Equal to level 2
B) Less than level 2
C) Greater than level 2
D) Equal to level 3
فتح الحزمة
افتح القفل للوصول البطاقات البالغ عددها 142 في هذه المجموعة.
فتح الحزمة
k this deck
28
If households consume less at each level of disposable income, they are:
A) Saving more
B) Saving less
C) Spending more
D) Working less
A) Saving more
B) Saving less
C) Spending more
D) Working less
فتح الحزمة
افتح القفل للوصول البطاقات البالغ عددها 142 في هذه المجموعة.
فتح الحزمة
k this deck
29
If disposable income increases from $912 to $927 billion and MPC = 0.6, then consumption will increase by:
A) $6 billion
B) $9 billion
C) $54 billion
D) $56 billion
A) $6 billion
B) $9 billion
C) $54 billion
D) $56 billion
فتح الحزمة
افتح القفل للوصول البطاقات البالغ عددها 142 في هذه المجموعة.
فتح الحزمة
k this deck
30
If the slope of a linear consumption schedule increases in a private closed economy, then it can be concluded that the:
A) MPS has increased
B) MPC has increased
C) Income has increased
D) Income has decreased
A) MPS has increased
B) MPC has increased
C) Income has increased
D) Income has decreased
فتح الحزمة
افتح القفل للوصول البطاقات البالغ عددها 142 في هذه المجموعة.
فتح الحزمة
k this deck
31
If the consumption schedule is a straight line, it can be concluded that the:
A) APC is necessarily constant
B) MPC is zero
C) MPC is constant at various levels of income
D) APC is equal to the MPC
A) APC is necessarily constant
B) MPC is zero
C) MPC is constant at various levels of income
D) APC is equal to the MPC
فتح الحزمة
افتح القفل للوصول البطاقات البالغ عددها 142 في هذه المجموعة.
فتح الحزمة
k this deck
32
If a family's MPC is 0.7, it means that the family is:
A) Operating at the break-even point
B) Spending seven-tenths of any increment to its income
C) Necessarily dissaving
D) Spending 70 percent of its disposable income
A) Operating at the break-even point
B) Spending seven-tenths of any increment to its income
C) Necessarily dissaving
D) Spending 70 percent of its disposable income
فتح الحزمة
افتح القفل للوصول البطاقات البالغ عددها 142 في هذه المجموعة.
فتح الحزمة
k this deck
33
What is the slope of the consumption schedule or consumption line for a given economy?
A) APC
B) APS
C) 1 - MPC
D) 1 - MPS
A) APC
B) APS
C) 1 - MPC
D) 1 - MPS
فتح الحزمة
افتح القفل للوصول البطاقات البالغ عددها 142 في هذه المجموعة.
فتح الحزمة
k this deck
34
An MPC value of less than 1.0 indicates that as income increases:
A) Consumption also increases, and by more than the increase in income
B) Consumption also increases, and at the same rate as the increase in income
C) Consumption will go in the opposite direction and decrease
D) Consumption also increases, though not as much as income
A) Consumption also increases, and by more than the increase in income
B) Consumption also increases, and at the same rate as the increase in income
C) Consumption will go in the opposite direction and decrease
D) Consumption also increases, though not as much as income
فتح الحزمة
افتح القفل للوصول البطاقات البالغ عددها 142 في هذه المجموعة.
فتح الحزمة
k this deck
35
All of the following statements about consuming in excess of one's disposable income are true, except:
A) It is possible, and it's called dissaving
B) In this case, the values of both saving and the APS are negative
C) (APC + APS) will be less than 1 in this situation
D) The value of APC will be greater than 1 in this case
A) It is possible, and it's called dissaving
B) In this case, the values of both saving and the APS are negative
C) (APC + APS) will be less than 1 in this situation
D) The value of APC will be greater than 1 in this case
فتح الحزمة
افتح القفل للوصول البطاقات البالغ عددها 142 في هذه المجموعة.
فتح الحزمة
k this deck
36
Assume that an increase in a household's disposable income from $40,000 to $48,000 leads to an increase in consumption from $35,000 to $41,000, then the:
A) Slope of the consumption schedule is .75
B) Average propensity to consume is .75
C) Marginal propensity to save is .20
D) Marginal propensity to consume is .6
A) Slope of the consumption schedule is .75
B) Average propensity to consume is .75
C) Marginal propensity to save is .20
D) Marginal propensity to consume is .6
فتح الحزمة
افتح القفل للوصول البطاقات البالغ عددها 142 في هذه المجموعة.
فتح الحزمة
k this deck
37
Dissaving occurs when:
A) Income is greater than saving
B) Income is less than consumption
C) Saving is greater than consumption
D) Saving is greater than the interest rate
A) Income is greater than saving
B) Income is less than consumption
C) Saving is greater than consumption
D) Saving is greater than the interest rate
فتح الحزمة
افتح القفل للوصول البطاقات البالغ عددها 142 في هذه المجموعة.
فتح الحزمة
k this deck
38
Refer to the saving schedule above. As income falls from level 3 to level 2, the amount of:A) Dissaving decreases
B) Dissaving increases
C) Saving decreases
D) Saving increases
فتح الحزمة
افتح القفل للوصول البطاقات البالغ عددها 142 في هذه المجموعة.
فتح الحزمة
k this deck
39
The relationship between the MPS and the MPC is such that:
A) MPC - MPS = 1
B) MPS/MPC = 1
C) 1 - MPC = MPS
D) MPC - 1 = MPS
A) MPC - MPS = 1
B) MPS/MPC = 1
C) 1 - MPC = MPS
D) MPC - 1 = MPS
فتح الحزمة
افتح القفل للوصول البطاقات البالغ عددها 142 في هذه المجموعة.
فتح الحزمة
k this deck
40
In an economy, for every $10 million increase in disposable income, saving increases by $2 million. It can be concluded that the:
A) Slope of the saving schedule is 2
B) Slope of the consumption schedule is .8
C) Marginal propensity to consume is .2
D) Average propensity to save is 0.2
A) Slope of the saving schedule is 2
B) Slope of the consumption schedule is .8
C) Marginal propensity to consume is .2
D) Average propensity to save is 0.2
فتح الحزمة
افتح القفل للوصول البطاقات البالغ عددها 142 في هذه المجموعة.
فتح الحزمة
k this deck
41
When the marginal propensity to consume is less than 1, the:
A) Average propensity to consume is greater than 1
B) Average propensity to save is greater than 1
C) Marginal propensity to save is negative
D) Marginal propensity to save is positive
A) Average propensity to consume is greater than 1
B) Average propensity to save is greater than 1
C) Marginal propensity to save is negative
D) Marginal propensity to save is positive
فتح الحزمة
افتح القفل للوصول البطاقات البالغ عددها 142 في هذه المجموعة.
فتح الحزمة
k this deck
42
The table shows a consumption schedule. Refer to the data above. If disposable income is $550, we would expect consumption to be:
A) $430
B) $450
C) $460
D) $470
Refer to the data above. If disposable income is $550, we would expect consumption to be:A) $430
B) $450
C) $460
D) $470
فتح الحزمة
افتح القفل للوصول البطاقات البالغ عددها 142 في هذه المجموعة.
فتح الحزمة
k this deck
43
The table shows a consumption schedule. Refer to the data above. At the $300 level of disposable income:
A) The marginal propensity to save is .80
B) The average propensity to consume is .60
C) The average propensity to save is .30
D) There is a dissaving of $10
Refer to the data above. At the $300 level of disposable income:A) The marginal propensity to save is .80
B) The average propensity to consume is .60
C) The average propensity to save is .30
D) There is a dissaving of $10
فتح الحزمة
افتح القفل للوصول البطاقات البالغ عددها 142 في هذه المجموعة.
فتح الحزمة
k this deck
44
The graph above shows the relationship between consumption and income. The ratio LM/PL would be a measure of the:A) Marginal propensity to consume
B) Marginal propensity to save
C) Average propensity to consume
D) Average propensity to save
فتح الحزمة
افتح القفل للوصول البطاقات البالغ عددها 142 في هذه المجموعة.
فتح الحزمة
k this deck
45
The table shows a consumption schedule. Refer to the data above. The marginal propensity to consume is:
A) .80
B) .75
C) .60
D) .40
Refer to the data above. The marginal propensity to consume is:A) .80
B) .75
C) .60
D) .40
فتح الحزمة
افتح القفل للوصول البطاقات البالغ عددها 142 في هذه المجموعة.
فتح الحزمة
k this deck
46
The graph above shows the relationship between consumption and income. Which of the following statements is correct?A) The marginal propensity to consume in the economy shown is greater than 1
B) The marginal propensity to consume varies across income levels
C) The average propensity to consume at income level K is given by KM divided by KN
D) The marginal propensity to consume can be calculated by dividing LM by 0K
فتح الحزمة
افتح القفل للوصول البطاقات البالغ عددها 142 في هذه المجموعة.
فتح الحزمة
k this deck
47
Refer to the consumption schedule above. If disposable income is $42,000, then saving is:A) $0
B) $2,000
C) $4,000
D) $6,000
فتح الحزمة
افتح القفل للوصول البطاقات البالغ عددها 142 في هذه المجموعة.
فتح الحزمة
k this deck
48
Which of the following would shift the consumption schedule downward?
A) A decrease in real interest rates
B) An increase in the value of financial assets
C) An increase in the probability of a recession
D) A decrease in disposable income
A) A decrease in real interest rates
B) An increase in the value of financial assets
C) An increase in the probability of a recession
D) A decrease in disposable income
فتح الحزمة
افتح القفل للوصول البطاقات البالغ عددها 142 في هذه المجموعة.
فتح الحزمة
k this deck
49
The disposable income (DI) and consumption (C) schedules are for a private, closed economy. All figures are in billions of dollars. Refer to the data above. If consumption increases by $10 billion at each level of disposable income, the marginal propensity to consume will:
A) Change, but the average propensity to consume will not change
B) Change, and the average propensity to consume will change
C) Not change, but the average propensity to consume will change
D) Not change, and the average propensity to consume will not change
Refer to the data above. If consumption increases by $10 billion at each level of disposable income, the marginal propensity to consume will:A) Change, but the average propensity to consume will not change
B) Change, and the average propensity to consume will change
C) Not change, but the average propensity to consume will change
D) Not change, and the average propensity to consume will not change
فتح الحزمة
افتح القفل للوصول البطاقات البالغ عددها 142 في هذه المجموعة.
فتح الحزمة
k this deck
50
Refer to the consumption schedule above. The average propensity to save at income level B is represented by:A) 0C/0B
B) EF/BE
C) EF/BF
D) DE/AB
فتح الحزمة
افتح القفل للوصول البطاقات البالغ عددها 142 في هذه المجموعة.
فتح الحزمة
k this deck
51
Refer to the consumption schedule above. The marginal propensity to consume is represented by:A) GF/BE
B) EF/BE
C) GE/AB
D) DE/AB
فتح الحزمة
افتح القفل للوصول البطاقات البالغ عددها 142 في هذه المجموعة.
فتح الحزمة
k this deck
52
Refer to the consumption schedule above. The marginal propensity to consume is:A) .60
B) .75
C) .80
D) .20
فتح الحزمة
افتح القفل للوصول البطاقات البالغ عددها 142 في هذه المجموعة.
فتح الحزمة
k this deck
53
An increase in household wealth that creates a wealth effect would shift the:
A) Consumption schedule and the saving schedule upward
B) Consumption schedule and the saving schedule downward
C) Consumption schedule upward and the saving schedule downward
D) Consumption schedule downward and the saving schedule upward
A) Consumption schedule and the saving schedule upward
B) Consumption schedule and the saving schedule downward
C) Consumption schedule upward and the saving schedule downward
D) Consumption schedule downward and the saving schedule upward
فتح الحزمة
افتح القفل للوصول البطاقات البالغ عددها 142 في هذه المجموعة.
فتح الحزمة
k this deck
54
The disposable income (DI) and consumption (C) schedules are for a private, closed economy. All figures are in billions of dollars. Refer to the data above. At the $320 billion level of disposable income, the average propensity to save is:
A) .015
B) .075
C) .335
D) .925
Refer to the data above. At the $320 billion level of disposable income, the average propensity to save is:A) .015
B) .075
C) .335
D) .925
فتح الحزمة
افتح القفل للوصول البطاقات البالغ عددها 142 في هذه المجموعة.
فتح الحزمة
k this deck
55
The disposable income (DI) and consumption (C) schedules are for a private, closed economy. All figures are in billions of dollars. Refer to the data above. The marginal propensity to save in this economy is:
A) .1
B) .72
C) .8
D) .9
Refer to the data above. The marginal propensity to save in this economy is:A) .1
B) .72
C) .8
D) .9
فتح الحزمة
افتح القفل للوصول البطاقات البالغ عددها 142 في هذه المجموعة.
فتح الحزمة
k this deck
56
Refer to the consumption schedule above. If disposable income were $34,000, then the average propensity to save would be about:A) .75
B) .88
C) .25
D) .12
فتح الحزمة
افتح القفل للوصول البطاقات البالغ عددها 142 في هذه المجموعة.
فتح الحزمة
k this deck
57
In a private closed economy, national income is $4.5 trillion and savings equals $6.4 billion. Based on this data, the marginal propensity to consume:
A) Decreases as income increases
B) Is greater than the marginal propensity to save
C) Is less than the average propensity to consume
D) Cannot be calculated from the data given
A) Decreases as income increases
B) Is greater than the marginal propensity to save
C) Is less than the average propensity to consume
D) Cannot be calculated from the data given
فتح الحزمة
افتح القفل للوصول البطاقات البالغ عددها 142 في هذه المجموعة.
فتح الحزمة
k this deck
58
Which of the following may shift the consumption schedule upward?
A) An increase in disposable income
B) A decrease in interest rates
C) A significant decrease in stock prices
D) A decrease in people's ability to borrow
A) An increase in disposable income
B) A decrease in interest rates
C) A significant decrease in stock prices
D) A decrease in people's ability to borrow
فتح الحزمة
افتح القفل للوصول البطاقات البالغ عددها 142 في هذه المجموعة.
فتح الحزمة
k this deck
59
The disposable income (DI) and consumption (C) schedules are for a private, closed economy. All figures are in billions of dollars. Refer to the data above. If plotted on a graph, the slope of the consumption schedule would be:
A) .6
B) .7
C) .8
D) .9
Refer to the data above. If plotted on a graph, the slope of the consumption schedule would be:A) .6
B) .7
C) .8
D) .9
فتح الحزمة
افتح القفل للوصول البطاقات البالغ عددها 142 في هذه المجموعة.
فتح الحزمة
k this deck
60
If the consumption schedule shifts downward, and the shift was not caused by a tax change, then the saving schedule:
A) May shift either upward or downward
B) Will shift downward
C) Will shift upward
D) Will not shift
A) May shift either upward or downward
B) Will shift downward
C) Will shift upward
D) Will not shift
فتح الحزمة
افتح القفل للوصول البطاقات البالغ عددها 142 في هذه المجموعة.
فتح الحزمة
k this deck
61
A change in interest rates would shift the consumption schedule and the saving schedule ______; a change in taxes would shift these two schedules ______.
A) In the same direction; also in the same direction
B) In the same direction; in opposite directions
C) In opposite directions; also in opposite directions
D) In opposite directions; in the same direction
A) In the same direction; also in the same direction
B) In the same direction; in opposite directions
C) In opposite directions; also in opposite directions
D) In opposite directions; in the same direction
فتح الحزمة
افتح القفل للوصول البطاقات البالغ عددها 142 في هذه المجموعة.
فتح الحزمة
k this deck
62
One factor that shifts the consumption schedule is household wealth. Households build wealth by:
A) Spending their current incomes
B) Spending out of their future incomes
C) Spending their incomes as they earn them
D) Not spending all their current incomes
A) Spending their current incomes
B) Spending out of their future incomes
C) Spending their incomes as they earn them
D) Not spending all their current incomes
فتح الحزمة
افتح القفل للوصول البطاقات البالغ عددها 142 في هذه المجموعة.
فتح الحزمة
k this deck
63
Two basic determinants of investment spending are:
A) Consumer spending and government spending
B) Expected returns and real interest rates
C) General price level and the level of output
D) Domestic trade and international trade
A) Consumer spending and government spending
B) Expected returns and real interest rates
C) General price level and the level of output
D) Domestic trade and international trade
فتح الحزمة
افتح القفل للوصول البطاقات البالغ عددها 142 في هذه المجموعة.
فتح الحزمة
k this deck
64
A change in the amount saved due to a change in income is represented by a:
A) Shift of the entire saving schedule
B) Movement along the saving schedule
C) Change in the marginal propensity to save
D) Change in the marginal propensity to consume
A) Shift of the entire saving schedule
B) Movement along the saving schedule
C) Change in the marginal propensity to save
D) Change in the marginal propensity to consume
فتح الحزمة
افتح القفل للوصول البطاقات البالغ عددها 142 في هذه المجموعة.
فتح الحزمة
k this deck
65
Refer to the above figures with consumption schedules in figure (A) and saving schedules in figure (B), which correspond to each other across different levels of disposable income. If, in figure (A), consumption increases along line A2 then in figure (B) there would be:A) A shift from line B2 to B3
B) A shift from line B2 to B1
C) A movement down along line B2
D) A movement up along line B2
فتح الحزمة
افتح القفل للوصول البطاقات البالغ عددها 142 في هذه المجموعة.
فتح الحزمة
k this deck
66
The Great Recession of 2007-2009 altered the prior behavior of consumers in the economy by:
A) Shifting the consumption schedule up
B) Shifting the consumption schedule down
C) Shifting the saving schedule down
D) Moving the economy down along a stable consumption schedule
A) Shifting the consumption schedule up
B) Shifting the consumption schedule down
C) Shifting the saving schedule down
D) Moving the economy down along a stable consumption schedule
فتح الحزمة
افتح القفل للوصول البطاقات البالغ عددها 142 في هذه المجموعة.
فتح الحزمة
k this deck
67
If the real interest rate increases:
A) The investment demand curve will shift to the right
B) The investment demand curve will shift to the left
C) There will be a movement upward along the investment demand curve
D) There will be a movement downward along the investment demand curve
A) The investment demand curve will shift to the right
B) The investment demand curve will shift to the left
C) There will be a movement upward along the investment demand curve
D) There will be a movement downward along the investment demand curve
فتح الحزمة
افتح القفل للوصول البطاقات البالغ عددها 142 في هذه المجموعة.
فتح الحزمة
k this deck
68
The Paradox of Thrift highlights the idea that:
A) Saving more is good for the economy in the short run
B) Saving more can be bad for the economy during a recession
C) In spending more, households will end up saving less
D) In spending more, workers may end up losing their jobs
A) Saving more is good for the economy in the short run
B) Saving more can be bad for the economy during a recession
C) In spending more, households will end up saving less
D) In spending more, workers may end up losing their jobs
فتح الحزمة
افتح القفل للوصول البطاقات البالغ عددها 142 في هذه المجموعة.
فتح الحزمة
k this deck
69
Given the expected rate of return on all possible investment opportunities in the economy, a(n):
A) Increase in the real rate of interest will tend to increase the level of investment
B) Decrease in the real rate of interest will tend to increase the level of investment
C) Decrease in the real rate of interest will tend to decrease the level of investment
D) Change in the real interest rate will have no impact on the level of investment
فتح الحزمة
افتح القفل للوصول البطاقات البالغ عددها 142 في هذه المجموعة.
فتح الحزمة
k this deck
70
If consumers expect prices to rise and shortages to occur in the future, then there will be a shift:
A) Upward of both the consumption and saving schedules
B) Downward of both the consumption and saving schedules
C) Of the consumption schedule upward and of the saving schedule downward
D) Of the consumption schedule downward and the saving schedule upward
A) Upward of both the consumption and saving schedules
B) Downward of both the consumption and saving schedules
C) Of the consumption schedule upward and of the saving schedule downward
D) Of the consumption schedule downward and the saving schedule upward
فتح الحزمة
افتح القفل للوصول البطاقات البالغ عددها 142 في هذه المجموعة.
فتح الحزمة
k this deck
71
Which of the following would shift the saving schedule upward?
A) A decrease in wealth
B) A decrease in real interest rates
C) Consumer expectations of rising prices of products
D) Increased optimism about future incomes
A) A decrease in wealth
B) A decrease in real interest rates
C) Consumer expectations of rising prices of products
D) Increased optimism about future incomes
فتح الحزمة
افتح القفل للوصول البطاقات البالغ عددها 142 في هذه المجموعة.
فتح الحزمة
k this deck
72
Refer to the above figures with consumption schedules in figure (A) and saving schedules in figure (B), which correspond to each other across different levels of disposable income. If, in figure (A), line A2 shifts to A3 because of the so-called wealth effect, then in figure (B) line:A) B2 will shift to B3
B) B1 will shift to B2
C) B2 will shift to B1
D) B3 will shift to B2
فتح الحزمة
افتح القفل للوصول البطاقات البالغ عددها 142 في هذه المجموعة.
فتح الحزمة
k this deck
73
Refer to the above figures with consumption schedules in figure (A) and saving schedules in figure (B), which correspond to each other across different levels of disposable income. If, in figure (A), consumption shifts from A2 to A3 because of a change in taxes, then in figure (B) line:A) B2 will shift to B3
B) B1 will shift to B2
C) B2 will shift to B1
D) B3 will shift to B2
فتح الحزمة
افتح القفل للوصول البطاقات البالغ عددها 142 في هذه المجموعة.
فتح الحزمة
k this deck
74
The so-called Paradox of Thrift that became quite obvious in the Great Recession of 2007-2009 refers to all of the following, except:
A) Saving may be virtuous for the individual, but it could be bad for the economy as a whole
B) Consumers becoming thriftier may help long-term growth, but ironically reduces current output
C) In trying to spend less now, consumers will end up spending more later on
D) As individuals try to save more, the whole group may end up saving less as total income declines
فتح الحزمة
افتح القفل للوصول البطاقات البالغ عددها 142 في هذه المجموعة.
فتح الحزمة
k this deck
75
The saving schedule would be shifted upward by:
A) An increase in the value real and financial assets
B) A reduction in real interest rates
C) Expectations of rising prices of products
D) A decrease in taxes
A) An increase in the value real and financial assets
B) A reduction in real interest rates
C) Expectations of rising prices of products
D) A decrease in taxes
فتح الحزمة
افتح القفل للوصول البطاقات البالغ عددها 142 في هذه المجموعة.
فتح الحزمة
k this deck
76
An investment demand curve shows the varying amounts of investment that would be undertaken at various levels of:
A) The average price in the economy
B) Consumer spending
C) Personal saving
D) The real interest rate
A) The average price in the economy
B) Consumer spending
C) Personal saving
D) The real interest rate
فتح الحزمة
افتح القفل للوصول البطاقات البالغ عددها 142 في هذه المجموعة.
فتح الحزمة
k this deck
77
As the consumption and saving schedules relate to real GDP, an increase in taxes will shift:
A) Upward both the consumption and saving schedules
B) Downward both the consumption and saving schedules
C) The consumption schedule upward and the saving schedule downward
D) The saving schedule upward and the consumption schedule downward
A) Upward both the consumption and saving schedules
B) Downward both the consumption and saving schedules
C) The consumption schedule upward and the saving schedule downward
D) The saving schedule upward and the consumption schedule downward
فتح الحزمة
افتح القفل للوصول البطاقات البالغ عددها 142 في هذه المجموعة.
فتح الحزمة
k this deck
78
A lower real interest rate typically induces consumers to:
A) Save more
B) Buy fewer imported goods
C) Purchase more goods that are bought using credit
D) Purchase fewer goods that are bought without using credit
A) Save more
B) Buy fewer imported goods
C) Purchase more goods that are bought using credit
D) Purchase fewer goods that are bought without using credit
فتح الحزمة
افتح القفل للوصول البطاقات البالغ عددها 142 في هذه المجموعة.
فتح الحزمة
k this deck
79
When consumers decide to increase household debt, this action will:
A) Shift the consumption schedule upward
B) Shift the consumption schedule downward
C) Increase the amount consumed along a stable consumption schedule
D) Decrease the amount consumed along a stable consumption schedule
A) Shift the consumption schedule upward
B) Shift the consumption schedule downward
C) Increase the amount consumed along a stable consumption schedule
D) Decrease the amount consumed along a stable consumption schedule
فتح الحزمة
افتح القفل للوصول البطاقات البالغ عددها 142 في هذه المجموعة.
فتح الحزمة
k this deck
80
The so-called wealth effect will result in households:
A) Spending more and saving less
B) Spending less and saving more
C) Spending less and saving less
D) Spending more and saving more
A) Spending more and saving less
B) Spending less and saving more
C) Spending less and saving less
D) Spending more and saving more
فتح الحزمة
افتح القفل للوصول البطاقات البالغ عددها 142 في هذه المجموعة.
فتح الحزمة
k this deck
فتح الحزمة
افتح القفل للوصول البطاقات البالغ عددها 142 في هذه المجموعة.


