Deck 9: Pearsons Correlation and Bivariate Regression
ملء الشاشة (f)
سؤال
سؤال
سؤال
سؤال
سؤال
سؤال
سؤال
سؤال
سؤال
سؤال
سؤال
سؤال
سؤال
سؤال
سؤال
سؤال
سؤال
سؤال
سؤال
سؤال
سؤال
سؤال
سؤال
سؤال
سؤال
سؤال
سؤال
سؤال
سؤال
سؤال
سؤال
سؤال
سؤال
سؤال
سؤال
سؤال
سؤال
سؤال
سؤال
سؤال
سؤال
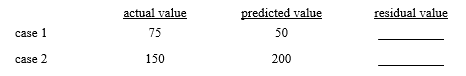
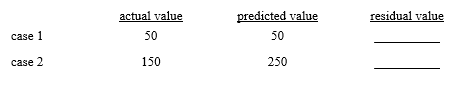
For each of the following cases, the case's actual value on the dependent variable is shown along with the case's predicted value on the dependent variable based on a regression equation. For each case, what is the value of the regression residual?
سؤال
Answer the questions that follow this SPSS output:
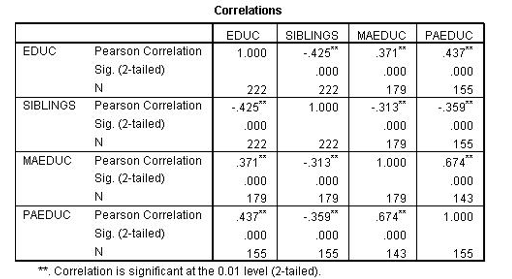
A) What is the value of Pearson's correlation for the relationship between SIBLINGS and MAEDUC? __________
B) Which pair of variables has the weakest correlation in the table? __________ and __________
A) What is the value of Pearson's correlation for the relationship between SIBLINGS and MAEDUC? __________
B) Which pair of variables has the weakest correlation in the table? __________ and __________
سؤال
Answer the questions that follow this SPSS output:
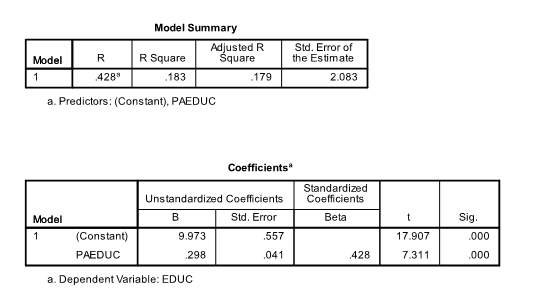
A) What proportion of the differences in EDUC is explained by PAEDUC? __________
B) Do children of father's with more education (PAEDUC) tend to get more or less education (EDUC) than children of father's with less education? (more / less) __________
C) Write out the regression equation. You may use Y and X or the names of the variables.
سؤال
Answer the questions that follow this SPSS output:
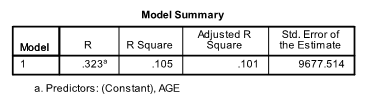
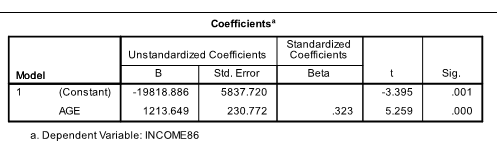
A) What is the value of the multiple correlation? __________
B) If one person is five years older than another person, how much more income would we predict the older person gets? __________
C) Write out the regression equation. You may use Y and X or the names of the variables.
A) What is the value of the multiple correlation? __________
B) If one person is five years older than another person, how much more income would we predict the older person gets? __________
C) Write out the regression equation. You may use Y and X or the names of the variables.
سؤال
سؤال
سؤال
For each of the following cases, the case's actual value on the dependent variable is shown along with the case's predicted value on the dependent variable based on a regression equation. For each case, what is the value of the regression residual?
سؤال
Answer the questions that follow this SPSS output:

A) Describe the strength and the direction of the correlation between EDUC and INCOME. Also report the actual value of the correlation.
B) Which pair of variables has the weakest correlation in the table? __________ and __________
A) Describe the strength and the direction of the correlation between EDUC and INCOME. Also report the actual value of the correlation.
B) Which pair of variables has the weakest correlation in the table? __________ and __________

فتح الحزمة
قم بالتسجيل لفتح البطاقات في هذه المجموعة!
Unlock Deck
Unlock Deck
1/48
العب
ملء الشاشة (f)
Deck 9: Pearsons Correlation and Bivariate Regression
1
Based on the regression equation Y = 200 + 50X, which of the following is true?
A) The regression line crosses the Y axis at 50.
B) The regression line rises as it moves to the right.
C) Cases with a value on X of 10 would be predicted to have a score of 260 on Y.
D) Cases with a value on X of 0 would be predicted to have a score of 250 on Y.
A) The regression line crosses the Y axis at 50.
B) The regression line rises as it moves to the right.
C) Cases with a value on X of 10 would be predicted to have a score of 260 on Y.
D) Cases with a value on X of 0 would be predicted to have a score of 250 on Y.
The regression line rises as it moves to the right.
2
Pearson's r is the appropriate measure of association for a pair of variables if
A) at least one variable is nominal
B) at least one variable is ordinal
C) one and only one variable is interval/ratio
D) both variables are interval/ratio
A) at least one variable is nominal
B) at least one variable is ordinal
C) one and only one variable is interval/ratio
D) both variables are interval/ratio
both variables are interval/ratio
3
Which of the following Pearson's r coefficients indicates the strongest relationship?
A) -0.90
B) -0.55
C) 0.45
D) 1.00
A) -0.90
B) -0.55
C) 0.45
D) 1.00
1.00
4
The unstandardized regression coefficient (slope) indicates
A) the strength of an independent variable's net effect
B) the direction of an independent variable's net effect
C) both "a" and "b"
D) neither "a" nor "b"
A) the strength of an independent variable's net effect
B) the direction of an independent variable's net effect
C) both "a" and "b"
D) neither "a" nor "b"
فتح الحزمة
افتح القفل للوصول البطاقات البالغ عددها 48 في هذه المجموعة.
فتح الحزمة
k this deck
5
When reading a scatterplot, the independent variable defines the
A) diagonal axis
B) horizontal axis
C) regression line
D) vertical axis
A) diagonal axis
B) horizontal axis
C) regression line
D) vertical axis
فتح الحزمة
افتح القفل للوصول البطاقات البالغ عددها 48 في هذه المجموعة.
فتح الحزمة
k this deck
6
The "best-fitting" straight line which describes the data points in a scatterplot is the line that
A) goes through the greatest number of points
B) has the smallest y-intercept
C) has the steepest slope
D) minimizes the sum of the squared vertical distances of points from the line
A) goes through the greatest number of points
B) has the smallest y-intercept
C) has the steepest slope
D) minimizes the sum of the squared vertical distances of points from the line
فتح الحزمة
افتح القفل للوصول البطاقات البالغ عددها 48 في هذه المجموعة.
فتح الحزمة
k this deck
7
GPA is regressed on YEAR in college. The resulting regression equation is GPA = 1.75 + .25(YEAR). Someone in their fourth year of college would be predicted to have a GPA _____ than someone in their first year of college.
A) 2.00 lower
B) 0.25 lower
C) 0.75 higher
D) 1.50 higher
A) 2.00 lower
B) 0.25 lower
C) 0.75 higher
D) 1.50 higher
فتح الحزمة
افتح القفل للوصول البطاقات البالغ عددها 48 في هذه المجموعة.
فتح الحزمة
k this deck
8
The best way to visually portray the relationship between two interval/ratio, continuous variables is with a
A) clustered bar chart
B) histogram
C) pie chart
D) scatterplot
A) clustered bar chart
B) histogram
C) pie chart
D) scatterplot
فتح الحزمة
افتح القفل للوصول البطاقات البالغ عددها 48 في هذه المجموعة.
فتح الحزمة
k this deck
9
Years of schooling (EDUC) is regressed on number of SIBLINGS. The resulting regression equation is EDUC = 16 − 1.00(SIBLINGS). Someone with three siblings would be predicted to get how many years of schooling?
A) 13
B) 15
C) 16
D) 17
A) 13
B) 15
C) 16
D) 17
فتح الحزمة
افتح القفل للوصول البطاقات البالغ عددها 48 في هذه المجموعة.
فتح الحزمة
k this deck
10
Which of the following is most appropriate for measuring the relationship between an ordinal variable and an interval/ratio variable?
A) Cramer's V
B) Kendall's tau-b
C) Pearson's r
D) uncertainty coefficient
A) Cramer's V
B) Kendall's tau-b
C) Pearson's r
D) uncertainty coefficient
فتح الحزمة
افتح القفل للوصول البطاقات البالغ عددها 48 في هذه المجموعة.
فتح الحزمة
k this deck
11
Final college GPA was regressed on entering college SAT score. On the basis of the resulting regression equation, regression residuals were calculated for four recent graduates. Which graduate most exceeded expectations?
A) Person A with a residual of −.75
B) Person B with a residual of .00
C) Person C with a residual of .25
D) Person D with a residual of .50
A) Person A with a residual of −.75
B) Person B with a residual of .00
C) Person C with a residual of .25
D) Person D with a residual of .50
فتح الحزمة
افتح القفل للوصول البطاقات البالغ عددها 48 في هذه المجموعة.
فتح الحزمة
k this deck
12
What does a zero regression residual mean?
A) The two variables have a negative correlation.
B) That case's actual value on the dependent variable is exactly what was predicted by the regression equation.
C) That case's actual value on the dependent variable is more than what was predicted by the regression equation.
D) The slope of the best-fitting straight line is negative.
فتح الحزمة
افتح القفل للوصول البطاقات البالغ عددها 48 في هذه المجموعة.
فتح الحزمة
k this deck
13
The Pearson's r for variables D and E is .00. Cases which have a high value on D are
A) likely to have a low value on E
B) likely to have a high value on E
C) equally likely to have a high or low value on E
A) likely to have a low value on E
B) likely to have a high value on E
C) equally likely to have a high or low value on E
فتح الحزمة
افتح القفل للوصول البطاقات البالغ عددها 48 في هذه المجموعة.
فتح الحزمة
k this deck
14
The Pearson's r for variables D and E is −.88. Cases which have a low value on D are
A) likely to have a low value on E
B) likely to have a high value on E
C) equally likely to have a high or low value on E
A) likely to have a low value on E
B) likely to have a high value on E
C) equally likely to have a high or low value on E
فتح الحزمة
افتح القفل للوصول البطاقات البالغ عددها 48 في هذه المجموعة.
فتح الحزمة
k this deck
15
What does a positive regression residual mean?
A) The two variables have a positive correlation.
B) That a case's actual value on the dependent variable is exactly what was predicted by the regression equation.
C) That a case's actual value on the dependent variable is greater than what was predicted by the regression equation.
D) The slope of the best-fitting straight line is positive.
فتح الحزمة
افتح القفل للوصول البطاقات البالغ عددها 48 في هذه المجموعة.
فتح الحزمة
k this deck
16
If the correlation between a nation's population size and its economic standard of living is −.86, then
A) Larger nations tend to be economically richer
B) Larger nations tend to be economically poorer.
C) Population size is not related to economic standard of living.
D) Population size accounts for 86% of a nation's economic standard of living.
A) Larger nations tend to be economically richer
B) Larger nations tend to be economically poorer.
C) Population size is not related to economic standard of living.
D) Population size accounts for 86% of a nation's economic standard of living.
فتح الحزمة
افتح القفل للوصول البطاقات البالغ عددها 48 في هذه المجموعة.
فتح الحزمة
k this deck
17
For linear regression, the lowest level of measurement that the dependent variable can be is
A) nominal
B) ordinal
C) interval/ratio
A) nominal
B) ordinal
C) interval/ratio
فتح الحزمة
افتح القفل للوصول البطاقات البالغ عددها 48 في هذه المجموعة.
فتح الحزمة
k this deck
18
Pearson's r indicates _____ of the relationship between two variables.
A) the direction but not strength
B) the strength but not direction
C) the strength and direction
D) neither the strength nor the direction
A) the direction but not strength
B) the strength but not direction
C) the strength and direction
D) neither the strength nor the direction
فتح الحزمة
افتح القفل للوصول البطاقات البالغ عددها 48 في هذه المجموعة.
فتح الحزمة
k this deck
19
Which of the following measures of association can range in value from −1.00 to 1.00?
A) Cramer's V
B) lambda
C) multiple correlation coefficient
D) Pearson's r
A) Cramer's V
B) lambda
C) multiple correlation coefficient
D) Pearson's r
فتح الحزمة
افتح القفل للوصول البطاقات البالغ عددها 48 في هذه المجموعة.
فتح الحزمة
k this deck
20
If the value of the coefficient of determination (R2) is .36, what proportion of the variability in the dependent variable is NOT explained by the independent variable(s)?
A) .06
B) .36
C) .60
D) .64
A) .06
B) .36
C) .60
D) .64
فتح الحزمة
افتح القفل للوصول البطاقات البالغ عددها 48 في هذه المجموعة.
فتح الحزمة
k this deck
21
What information does a regression residual provide?
فتح الحزمة
افتح القفل للوصول البطاقات البالغ عددها 48 في هذه المجموعة.
فتح الحزمة
k this deck
22
What information does a coefficient of determination provide?
فتح الحزمة
افتح القفل للوصول البطاقات البالغ عددها 48 في هذه المجموعة.
فتح الحزمة
k this deck
23
What kinds of questions can you answer using a correlation coefficient?
فتح الحزمة
افتح القفل للوصول البطاقات البالغ عددها 48 في هذه المجموعة.
فتح الحزمة
k this deck
24
What information does a multiple correlation coefficient provide?
فتح الحزمة
افتح القفل للوصول البطاقات البالغ عددها 48 في هذه المجموعة.
فتح الحزمة
k this deck
25
For a correlation matrix with many variables, what is the difference between pairwise and listwise deletion of missing data?
فتح الحزمة
افتح القفل للوصول البطاقات البالغ عددها 48 في هذه المجموعة.
فتح الحزمة
k this deck
26
If R2 for a regression equation is .25, what is the value of the coefficient of determination? __________
فتح الحزمة
افتح القفل للوصول البطاقات البالغ عددها 48 في هذه المجموعة.
فتح الحزمة
k this deck
27
The multiple correlation coefficient (R) indicates _____ of the relationship between the dependent variable and the set of independent variables.
A) the direction but not strength
B) the strength but not direction
C) the strength and direction
D) neither the strength nor the direction
A) the direction but not strength
B) the strength but not direction
C) the strength and direction
D) neither the strength nor the direction
فتح الحزمة
افتح القفل للوصول البطاقات البالغ عددها 48 في هذه المجموعة.
فتح الحزمة
k this deck
28
If the value of the multiple correlation is .80, what is the value of the coefficient of determination? __________
فتح الحزمة
افتح القفل للوصول البطاقات البالغ عددها 48 في هذه المجموعة.
فتح الحزمة
k this deck
29
Which one of the following statements about the relationship between two interval/ratio variables is TRUE?
A) If two variables have a perfect curvilinear relationship, their correlation will be 1.00.
B) If the correlation between two variables is negative, the slope of the bivariate regression line will be negative.
C) The further from zero the slope, the stronger the correlation.
D) The regression line is the "best-fitting" straight line because it maximizes the number of data points that it passes through.
فتح الحزمة
افتح القفل للوصول البطاقات البالغ عددها 48 في هذه المجموعة.
فتح الحزمة
k this deck
30
If the value of the multiple correlation coefficient is .40, what is the value of the coefficient of determination (R2)?
A) .16
B) .40
C) .60
D) 4.00
A) .16
B) .40
C) .60
D) 4.00
فتح الحزمة
افتح القفل للوصول البطاقات البالغ عددها 48 في هذه المجموعة.
فتح الحزمة
k this deck
31
If the coefficient of determination for a regression equation is .25, what is the value of the coefficient of alienation? __________
فتح الحزمة
افتح القفل للوصول البطاقات البالغ عددها 48 في هذه المجموعة.
فتح الحزمة
k this deck
32
How does a scatterplot indicate the strength of the relationship between two variables?
فتح الحزمة
افتح القفل للوصول البطاقات البالغ عددها 48 في هذه المجموعة.
فتح الحزمة
k this deck
33
What information does an unstandardized coefficient provide?
فتح الحزمة
افتح القفل للوصول البطاقات البالغ عددها 48 في هذه المجموعة.
فتح الحزمة
k this deck
34
Which number line represents the independent variable in a scatterplot?
فتح الحزمة
افتح القفل للوصول البطاقات البالغ عددها 48 في هذه المجموعة.
فتح الحزمة
k this deck
35
Number of children is regressed on years of schooling. The unstandardized regression coefficient for years of schooling is .125. Do persons with more years of schooling have more, less, or the same number of children as persons with fewer years of schooling?
A) more
B) less
C) the same
A) more
B) less
C) the same
فتح الحزمة
افتح القفل للوصول البطاقات البالغ عددها 48 في هذه المجموعة.
فتح الحزمة
k this deck
36
If R2 for a regression equation is .30, how much of the variability in the dependent variable is NOT accounted for by the independent variables? __________
فتح الحزمة
افتح القفل للوصول البطاقات البالغ عددها 48 في هذه المجموعة.
فتح الحزمة
k this deck
37
How does a scatterplot indicate the direction of the relationship between two variables?
فتح الحزمة
افتح القفل للوصول البطاقات البالغ عددها 48 في هذه المجموعة.
فتح الحزمة
k this deck
38
Weight loss is regressed on initial weight. On the basis of the resulting regression equation, a person's predicted weight loss is 15 pounds. They actually lost 17 pounds. What is the regression residual?
A) −2
B) 2
C) 17
D) 32
A) −2
B) 2
C) 17
D) 32
فتح الحزمة
افتح القفل للوصول البطاقات البالغ عددها 48 في هذه المجموعة.
فتح الحزمة
k this deck
39
INCOME is regressed on years of schooling (EDUC). The regression equation indicates that each additional year of schooling increases income by $1,200 and persons with no schooling have an income of $300. Which of the following is the correct regression equation?
A) INCOME = 300 − 1200(EDUC)
B) INCOME = 300 + 1200(EDUC)
C) INCOME = 1200 + 300(EDUC)
D) INCOME = 1500(EDUC)
A) INCOME = 300 − 1200(EDUC)
B) INCOME = 300 + 1200(EDUC)
C) INCOME = 1200 + 300(EDUC)
D) INCOME = 1500(EDUC)
فتح الحزمة
افتح القفل للوصول البطاقات البالغ عددها 48 في هذه المجموعة.
فتح الحزمة
k this deck
40
What kinds of questions can you answer using bivariate regression?
فتح الحزمة
افتح القفل للوصول البطاقات البالغ عددها 48 في هذه المجموعة.
فتح الحزمة
k this deck
41
For each of the following cases, the case's actual value on the dependent variable is shown along with the case's predicted value on the dependent variable based on a regression equation. For each case, what is the value of the regression residual?
فتح الحزمة
افتح القفل للوصول البطاقات البالغ عددها 48 في هذه المجموعة.
فتح الحزمة
k this deck
42
Answer the questions that follow this SPSS output:
A) What is the value of Pearson's correlation for the relationship between SIBLINGS and MAEDUC? __________
B) Which pair of variables has the weakest correlation in the table? __________ and __________
A) What is the value of Pearson's correlation for the relationship between SIBLINGS and MAEDUC? __________
B) Which pair of variables has the weakest correlation in the table? __________ and __________
فتح الحزمة
افتح القفل للوصول البطاقات البالغ عددها 48 في هذه المجموعة.
فتح الحزمة
k this deck
43
Answer the questions that follow this SPSS output:
A) What proportion of the differences in EDUC is explained by PAEDUC? __________
B) Do children of father's with more education (PAEDUC) tend to get more or less education (EDUC) than children of father's with less education? (more / less) __________
C) Write out the regression equation. You may use Y and X or the names of the variables.
فتح الحزمة
افتح القفل للوصول البطاقات البالغ عددها 48 في هذه المجموعة.
فتح الحزمة
k this deck
44
Answer the questions that follow this SPSS output:
A) What is the value of the multiple correlation? __________
B) If one person is five years older than another person, how much more income would we predict the older person gets? __________
C) Write out the regression equation. You may use Y and X or the names of the variables.
A) What is the value of the multiple correlation? __________
B) If one person is five years older than another person, how much more income would we predict the older person gets? __________
C) Write out the regression equation. You may use Y and X or the names of the variables.
فتح الحزمة
افتح القفل للوصول البطاقات البالغ عددها 48 في هذه المجموعة.
فتح الحزمة
k this deck
45
An analyst is interested in the relationship between number of children a person has (the independent variable) and exam grade (the dependent variable). She regresses exam grade on number of children. The equation for the best-fitting straight line is
GRADE = 75 + 5(CHILDREN)
A) For every additional child, what happens to the predicted grade? (State both the amount of change and the direction.)
B) One student has three children. What was that student's predicted grade?
C) If one student has 0 children and received a grade of 90, what was that student's regression residual?
D) Does the best fitting straight line through the scatterplot rise or fall as it moves to the right? (rise or fall)
فتح الحزمة
افتح القفل للوصول البطاقات البالغ عددها 48 في هذه المجموعة.
فتح الحزمة
k this deck
46
An analyst is interested in the relationship between number of cups of coffee consumed before an exam (the independent variable) and exam grade (the dependent variable). She regresses exam GRADE on number of CUPS of coffee. The equation for the best-fitting straight line is
GRADE = 90 − 10(CUPS)
A) One student had six cups of coffee. What was that student's predicted grade?
B) If one student had no coffee and received a grade of 95, what was that student's regression residual?
C) Does the best fitting straight line through the scatterplot rise or fall as it moves to the right? (rise or fall)
فتح الحزمة
افتح القفل للوصول البطاقات البالغ عددها 48 في هذه المجموعة.
فتح الحزمة
k this deck
47
For each of the following cases, the case's actual value on the dependent variable is shown along with the case's predicted value on the dependent variable based on a regression equation. For each case, what is the value of the regression residual?
فتح الحزمة
افتح القفل للوصول البطاقات البالغ عددها 48 في هذه المجموعة.
فتح الحزمة
k this deck
48
Answer the questions that follow this SPSS output:
A) Describe the strength and the direction of the correlation between EDUC and INCOME. Also report the actual value of the correlation.
B) Which pair of variables has the weakest correlation in the table? __________ and __________
A) Describe the strength and the direction of the correlation between EDUC and INCOME. Also report the actual value of the correlation.
B) Which pair of variables has the weakest correlation in the table? __________ and __________
فتح الحزمة
افتح القفل للوصول البطاقات البالغ عددها 48 في هذه المجموعة.
فتح الحزمة
k this deck
فتح الحزمة
افتح القفل للوصول البطاقات البالغ عددها 48 في هذه المجموعة.


