Deck 2: 5: Sec 25 Mc Graphing a Brief Review
ملء الشاشة (f)
سؤال
سؤال
سؤال
سؤال
سؤال
سؤال
سؤال
سؤال
سؤال
سؤال
سؤال
سؤال
سؤال
سؤال
سؤال
سؤال
سؤال
The ordered pair that represents the origin on a graph is
A)(1,1).
B)(0,0).
C)(-1,-1).
D)( ).
).
A)(1,1).
B)(0,0).
C)(-1,-1).
D)(
). سؤال
سؤال
سؤال
سؤال
سؤال
Figure 2-17 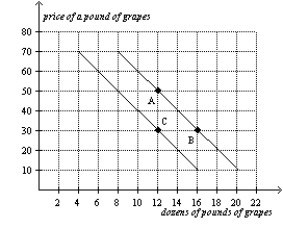
Refer to Figure 2-17.The movement from point B to point C could have been caused by
A)inflation.
B)a change in income.
C)a change in the price of grapes.
D)a change in the cost of producing grapes.
Refer to Figure 2-17.The movement from point B to point C could have been caused by
A)inflation.
B)a change in income.
C)a change in the price of grapes.
D)a change in the cost of producing grapes.
سؤال
سؤال
سؤال
سؤال
Figure 2-17
Refer to Figure 2-17.The slope of the curve between points A and B is
A)-5
B)-1/5
C)1/5
D)5
Refer to Figure 2-17.The slope of the curve between points A and B is
A)-5
B)-1/5
C)1/5
D)5
سؤال
Figure 2-17
Refer to Figure 2-17.The curves shown are
A)supply curves.
B)demand curves.
C)preference curves.
D)income-consumption curves.
Refer to Figure 2-17.The curves shown are
A)supply curves.
B)demand curves.
C)preference curves.
D)income-consumption curves.
سؤال
سؤال
سؤال
Figure 2-17
Refer to Figure 2-17.The movement from point B to point C is a(n)
A)shift of the demand curve.
B)movement along the demand curve.
C)indication that the price of grapes has changed.
D)indication that the costs incurred by firms that produce grapes have changed.
Refer to Figure 2-17.The movement from point B to point C is a(n)
A)shift of the demand curve.
B)movement along the demand curve.
C)indication that the price of grapes has changed.
D)indication that the costs incurred by firms that produce grapes have changed.
سؤال
Figure 2-16 
Refer to Figure 2-16.The graph shown is known as a
A)time-series graph.
B)bar graph.
C)scatterplot.
D)pie chart.
Refer to Figure 2-16.The graph shown is known as a
A)time-series graph.
B)bar graph.
C)scatterplot.
D)pie chart.
سؤال
سؤال
سؤال
سؤال
سؤال
Figure 2-16
Refer to Figure 2-16.Cups of coffee per day and the hours that someone can go without sleep appear to have
A)a positive correlation.
B)a negative correlation.
C)a random correlation.
D)no correlation.
Refer to Figure 2-16.Cups of coffee per day and the hours that someone can go without sleep appear to have
A)a positive correlation.
B)a negative correlation.
C)a random correlation.
D)no correlation.
سؤال
Figure 2-17
Refer to Figure 2-17.The movement from point A to point B is a(n)
A)shift of the demand curve.
B)indication of a change in preferences for grapes.
C)movement along the demand curve.
D)indication of an increase in income.
Refer to Figure 2-17.The movement from point A to point B is a(n)
A)shift of the demand curve.
B)indication of a change in preferences for grapes.
C)movement along the demand curve.
D)indication of an increase in income.
سؤال
سؤال
سؤال
Figure 2-16
Refer to Figure 2-16.Taking cause and effect into account,which of the following interpretations would be most reasonable regarding the relationship between coffee and hours without sleep?
A)The less coffee a person drinks per day,the more time he can go without sleep.
B)There is no relationship between how much coffee per day a person drinks and how long he can go without sleep.
C)The more coffee a person drinks per day,the more time he can go without sleep.
D)The more coffee a person drinks per day,the less time he can go without sleep.
سؤال
Figure 2-18
Relationship between Price and Restaurant Meals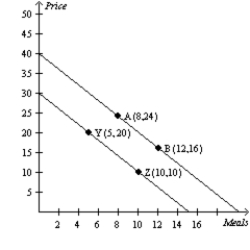
Refer to Figure 2-18.A movement from point A to point B is called
A)a shift in demand.
B)a movement along the demand curve.
C)a shift in supply.
D)a movement along the supply curve.
Relationship between Price and Restaurant Meals
Refer to Figure 2-18.A movement from point A to point B is called
A)a shift in demand.
B)a movement along the demand curve.
C)a shift in supply.
D)a movement along the supply curve.
سؤال
سؤال
Figure 2-18
Relationship between Price and Restaurant Meals
Refer to Figure 2-18.Which of the following could result in a movement from point A to point B?
A)a change in income
B)a change in the cost of producing a restaurant meal
C)a change in the price of restaurant meals
D)a change in the price of movies
Relationship between Price and Restaurant Meals
Refer to Figure 2-18.Which of the following could result in a movement from point A to point B?
A)a change in income
B)a change in the cost of producing a restaurant meal
C)a change in the price of restaurant meals
D)a change in the price of movies
سؤال
سؤال
Figure 2-18
Relationship between Price and Restaurant Meals
Refer to Figure 2-18.The slope of the line containing points A and B is
A)-1/2.
B)-2.
C)1/2.
D)2.
Relationship between Price and Restaurant Meals
Refer to Figure 2-18.The slope of the line containing points A and B is
A)-1/2.
B)-2.
C)1/2.
D)2.
سؤال
سؤال
سؤال
سؤال
سؤال
سؤال
Figure 2-18
Relationship between Price and Restaurant Meals
Refer to Figure 2-18.The slope of the line containing points Y and Z is
A)-0.5.
B)-1.
C)-2.
D)-4.
Relationship between Price and Restaurant Meals
Refer to Figure 2-18.The slope of the line containing points Y and Z is
A)-0.5.
B)-1.
C)-2.
D)-4.
سؤال
Figure 2-18
Relationship between Price and Restaurant Meals
Refer to Figure 2-18.A movement from point A to point Z is called
A)a shift in demand.
B)a movement along the demand curve.
C)a shift in supply.
D)a movement along the supply curve.
Relationship between Price and Restaurant Meals
Refer to Figure 2-18.A movement from point A to point Z is called
A)a shift in demand.
B)a movement along the demand curve.
C)a shift in supply.
D)a movement along the supply curve.
سؤال
Figure 2-18
Relationship between Price and Restaurant Meals
Refer to Figure 2-18.Which of the following could result in a movement from point B to point Z?
A)a change in the price of a restaurant meal
B)a change in the number of restaurant meals demanded
C)a change in income
D)Both a and b are correct.
Relationship between Price and Restaurant Meals
Refer to Figure 2-18.Which of the following could result in a movement from point B to point Z?
A)a change in the price of a restaurant meal
B)a change in the number of restaurant meals demanded
C)a change in income
D)Both a and b are correct.
سؤال
Figure 2-18
Relationship between Price and Restaurant Meals
Refer to Figure 2-18.In the ordered pair (8,24)
A)the x-coordinate is 8 and the y-coordinate is 24.
B)the x-coordinate is 24 and the y-coordinate is 8.
C)the numbers tell the location of the origin.
D)the 8 represents the price and the 24 represents the number of restaurant meals.
سؤال
سؤال
سؤال
سؤال
سؤال
سؤال
سؤال
Figure 2-20
Relationship Between Years of Education and Annual Income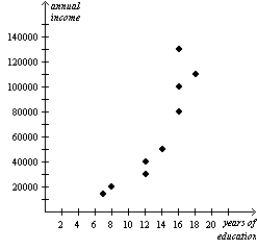
Refer to Figure 2-20.According to the graph,the correlation between years of education and annual income is
A)positive
B)negative
C)inverse
D)normative
Relationship Between Years of Education and Annual Income
Refer to Figure 2-20.According to the graph,the correlation between years of education and annual income is
A)positive
B)negative
C)inverse
D)normative
سؤال
سؤال
سؤال
سؤال
Figure 2-20
Relationship Between Years of Education and Annual Income
Refer to Figure 2-20.Senator Smith observes the graph and concludes that people who earn higher incomes attend school for more years.Senator Jones observes the graph and concludes that people who attend school for more years earn higher incomes.Who is correct?
A)Senator Smith is correct.
B)Senator Jones is correct.
C)It is difficult to say which senator might be correct due to the reverse causality problem.
D)It is difficult to say which senator might be correct due to omitted variable bias.
سؤال
Figure 2-20
Relationship Between Years of Education and Annual Income
Refer to Figure 2-20.The graph above is a
A)bar graph
B)scatterplot
C)pie chart
D)time series analysis
Relationship Between Years of Education and Annual Income
Refer to Figure 2-20.The graph above is a
A)bar graph
B)scatterplot
C)pie chart
D)time series analysis
سؤال
Figure 2-19
In the following graph the x-axis shows the number of times a commuter rail train stops at a station per hour and the y-axis shows the number of commuter rail passengers per hour.
Commuter Rail Passengers by Frequency of Service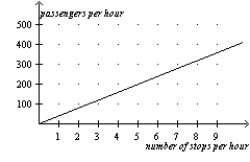
Refer to Figure 2-19.A policymaker observes this graph and concludes that increasing the frequency of commuter rail service is a certain way to get more commuters to choose the commuter rail instead of driving their own cars.You warn the policymaker about making a reverse causality mistake with which of the following statements?
A)Higher gas prices are causing more people to choose the commuter rail over driving.
B)The service frequency was increased in response to an increase in the number of passengers per hour.
C)There is a positive relationship between frequency of stops and number of passengers.
D)None of the above is correct.
سؤال
Figure 2-19
In the following graph the x-axis shows the number of times a commuter rail train stops at a station per hour and the y-axis shows the number of commuter rail passengers per hour.
Commuter Rail Passengers by Frequency of Service
Refer to Figure 2-19.Which of the following conclusions should not be drawn from observing this graph?
A)There is a positive correlation between the frequency of service and the number of passengers.
B)When there are 5 stops per hour,there are approximately 200 passengers.
C)More stops per hour is associated with more passengers per hour.
D)No other factors besides the frequency of service affect the number of passengers.

فتح الحزمة
قم بالتسجيل لفتح البطاقات في هذه المجموعة!
Unlock Deck
Unlock Deck
1/68
العب
ملء الشاشة (f)
Deck 2: 5: Sec 25 Mc Graphing a Brief Review
1
To display information on two variables,an economist must use
A)a bar graph.
B)a pie chart.
C)the coordinate system.
D)a time-series graph.
A)a bar graph.
B)a pie chart.
C)the coordinate system.
D)a time-series graph.
A
2
When two variables have a positive correlation,
A)when the x-variable increases,the y-variable decreases.
B)when the x-variable decreases,the y-variable increases.
C)when the x-variable increases,the y-variable increases.
D)More than one of the above is correct.
A)when the x-variable increases,the y-variable decreases.
B)when the x-variable decreases,the y-variable increases.
C)when the x-variable increases,the y-variable increases.
D)More than one of the above is correct.
A
3
When two variables have a positive correlation,
A)they tend to move in opposite directions.
B)they tend to move in the same direction.
C)one variable will move while the other remains constant.
D)the variables' values are never negative.
A)they tend to move in opposite directions.
B)they tend to move in the same direction.
C)one variable will move while the other remains constant.
D)the variables' values are never negative.
C
4
The x-coordinate is the
A)first number of an ordered pair and represents the point's horizontal location.
B)second number of an ordered pair and represents the point's horizontal location.
C)first number of an ordered pair and represents the point's vertical location.
D)second number of an ordered pair and represents the point's vertical location.
فتح الحزمة
افتح القفل للوصول البطاقات البالغ عددها 68 في هذه المجموعة.
فتح الحزمة
k this deck
5
Which of the following allows you to provide information about the relationship between two variables?
A)coordinate system.
B)pie chart
C)bar graph
D)time-series graph
A)coordinate system.
B)pie chart
C)bar graph
D)time-series graph
فتح الحزمة
افتح القفل للوصول البطاقات البالغ عددها 68 في هذه المجموعة.
فتح الحزمة
k this deck
6
Which of the following is not an example of a graph of a single variable?
A)a pie chart
B)a bar graph
C)a time-series graph
D)a scatterplot
A)a pie chart
B)a bar graph
C)a time-series graph
D)a scatterplot
فتح الحزمة
افتح القفل للوصول البطاقات البالغ عددها 68 في هذه المجموعة.
فتح الحزمة
k this deck
7
An ordered pair is
A)the process of checking calculations twice before placing them on a graph.
B)two numbers that can be represented by a single point on a graph.
C)two numbers that are represented by two points on a graph.
D)two points on a graph that are of equal distance from the origin.
A)the process of checking calculations twice before placing them on a graph.
B)two numbers that can be represented by a single point on a graph.
C)two numbers that are represented by two points on a graph.
D)two points on a graph that are of equal distance from the origin.
فتح الحزمة
افتح القفل للوصول البطاقات البالغ عددها 68 في هذه المجموعة.
فتح الحزمة
k this deck
8
The x-coordinate of an ordered pair specifies the
A)diagonal location of the point.
B)vertical location of the point.
C)horizontal location of the point.
D)quadrant location in which the point is located.
A)diagonal location of the point.
B)vertical location of the point.
C)horizontal location of the point.
D)quadrant location in which the point is located.
فتح الحزمة
افتح القفل للوصول البطاقات البالغ عددها 68 في هذه المجموعة.
فتح الحزمة
k this deck
9
In the ordered pair (20,30),20 is the
A)the x-coordinate.
B)the horizontal location of the point.
C)the y-coordinate.
D)Both a and b are correct.
A)the x-coordinate.
B)the horizontal location of the point.
C)the y-coordinate.
D)Both a and b are correct.
فتح الحزمة
افتح القفل للوصول البطاقات البالغ عددها 68 في هذه المجموعة.
فتح الحزمة
k this deck
10
In the ordered pair (5,3),3 is the
A)horizontal location of the point.
B)the slope.
C)the x-coordinate.
D)the y-coordinate.
A)horizontal location of the point.
B)the slope.
C)the x-coordinate.
D)the y-coordinate.
فتح الحزمة
افتح القفل للوصول البطاقات البالغ عددها 68 في هذه المجموعة.
فتح الحزمة
k this deck
11
The second number in any ordered pair is
A)the x-coordinate.
B)the y-coordinate.
C)the horizontal location of the point.
D)the slope.
A)the x-coordinate.
B)the y-coordinate.
C)the horizontal location of the point.
D)the slope.
فتح الحزمة
افتح القفل للوصول البطاقات البالغ عددها 68 في هذه المجموعة.
فتح الحزمة
k this deck
12
The point where both x and y are zero is known as the
A)origin.
B)null.
C)zero coordinate.
D)center.
A)origin.
B)null.
C)zero coordinate.
D)center.
فتح الحزمة
افتح القفل للوصول البطاقات البالغ عددها 68 في هذه المجموعة.
فتح الحزمة
k this deck
13
The y-coordinate of an ordered pair specifies the
A)diagonal location of the point.
B)vertical location of the point.
C)horizontal location of the point.
D)quadrant location in which the point is located.
A)diagonal location of the point.
B)vertical location of the point.
C)horizontal location of the point.
D)quadrant location in which the point is located.
فتح الحزمة
افتح القفل للوصول البطاقات البالغ عددها 68 في هذه المجموعة.
فتح الحزمة
k this deck
14
The first number in any ordered pair is
A)the x-coordinate.
B)the y-coordinate.
C)the vertical location of the point.
D)the slope.
A)the x-coordinate.
B)the y-coordinate.
C)the vertical location of the point.
D)the slope.
فتح الحزمة
افتح القفل للوصول البطاقات البالغ عددها 68 في هذه المجموعة.
فتح الحزمة
k this deck
15
Which of the following is not correct?
A)When developing economic theories,graphs offer a way to visually express ideas that might be less clear if described with equations or words.
B)Graphs are one way of expressing the relationships among variables.
C)When studying the relationship between two economic variables,graphs allow economists to draw indisputable conclusions about causes and effects.
D)When analyzing economic data,graphs provide a powerful way of finding and interpreting patterns.
فتح الحزمة
افتح القفل للوصول البطاقات البالغ عددها 68 في هذه المجموعة.
فتح الحزمة
k this deck
16
Graphs such as bar graphs and pie charts are limited in that they
A)can only show variables that are positively related.
B)can only show variables that have a negative correlation.
C)provide information on only one variable.
D)provide information on no more than two variables.
A)can only show variables that are positively related.
B)can only show variables that have a negative correlation.
C)provide information on only one variable.
D)provide information on no more than two variables.
فتح الحزمة
افتح القفل للوصول البطاقات البالغ عددها 68 في هذه المجموعة.
فتح الحزمة
k this deck
17
The ordered pair that represents the origin on a graph is
A)(1,1).
B)(0,0).
C)(-1,-1).
D)( ).
A)(1,1).
B)(0,0).
C)(-1,-1).
D)(
). فتح الحزمة
افتح القفل للوصول البطاقات البالغ عددها 68 في هذه المجموعة.
فتح الحزمة
k this deck
18
The y-coordinate is the
A)first number of an ordered pair and represents the point's horizontal location.
B)second number of an ordered pair and represents the point's horizontal location.
C)first number of an ordered pair and represents the point's vertical location.
D)second number of an ordered pair and represents the point's vertical location.
فتح الحزمة
افتح القفل للوصول البطاقات البالغ عددها 68 في هذه المجموعة.
فتح الحزمة
k this deck
19
The use of the coordinate system allows
A)for the display of the flows of dollars,goods and services,and factors of production in an economic system.
B)for the display of how labor and other resources are organized in the production process.
C)for the display of two variables on a single graph.
D)for the creation of pie charts and bar graphs.
فتح الحزمة
افتح القفل للوصول البطاقات البالغ عددها 68 في هذه المجموعة.
فتح الحزمة
k this deck
20
Eva wants to create a graph containing the prices of concert tickets and the corresponding quantities of concert tickets demanded by customers.She should use a(n)
A)pie chart.
B)bar graph.
C)time-series graph
D)coordinate system.
A)pie chart.
B)bar graph.
C)time-series graph
D)coordinate system.
فتح الحزمة
افتح القفل للوصول البطاقات البالغ عددها 68 في هذه المجموعة.
فتح الحزمة
k this deck
21
A demand curve displaying the relationship between the price of cars and the quantity demanded of cars should have a slope that is
A)less than 0.
B)between zero and 1.
C)between one and infinity.
D)undefined.
A)less than 0.
B)between zero and 1.
C)between one and infinity.
D)undefined.
فتح الحزمة
افتح القفل للوصول البطاقات البالغ عددها 68 في هذه المجموعة.
فتح الحزمة
k this deck
22
Figure 2-17
Refer to Figure 2-17.The movement from point B to point C could have been caused by
A)inflation.
B)a change in income.
C)a change in the price of grapes.
D)a change in the cost of producing grapes.
Refer to Figure 2-17.The movement from point B to point C could have been caused by
A)inflation.
B)a change in income.
C)a change in the price of grapes.
D)a change in the cost of producing grapes.
فتح الحزمة
افتح القفل للوصول البطاقات البالغ عددها 68 في هذه المجموعة.
فتح الحزمة
k this deck
23
A demand curve shows the relationship
A)between income and quantity demanded.
B)between price and income.
C)between price and quantity demanded.
D)among income,price,and quantity demanded.
A)between income and quantity demanded.
B)between price and income.
C)between price and quantity demanded.
D)among income,price,and quantity demanded.
فتح الحزمة
افتح القفل للوصول البطاقات البالغ عددها 68 في هذه المجموعة.
فتح الحزمة
k this deck
24
When two variables have a negative correlation,
A)when the x-variable decreases,the y-variable decreases.
B)when the x-variable decreases,the y-variable increases.
C)when the x-variable increases,the y-variable increases.
D)More than one of the above is correct.
A)when the x-variable decreases,the y-variable decreases.
B)when the x-variable decreases,the y-variable increases.
C)when the x-variable increases,the y-variable increases.
D)More than one of the above is correct.
فتح الحزمة
افتح القفل للوصول البطاقات البالغ عددها 68 في هذه المجموعة.
فتح الحزمة
k this deck
25
When two variables have a negative correlation and the x-variable decreases,
A)the y-variable increases.
B)the y-variable decreases.
C)the y-variable stays the same.
D)the x-variable can never be positive.
A)the y-variable increases.
B)the y-variable decreases.
C)the y-variable stays the same.
D)the x-variable can never be positive.
فتح الحزمة
افتح القفل للوصول البطاقات البالغ عددها 68 في هذه المجموعة.
فتح الحزمة
k this deck
26
Figure 2-17
Refer to Figure 2-17.The slope of the curve between points A and B is
A)-5
B)-1/5
C)1/5
D)5
Refer to Figure 2-17.The slope of the curve between points A and B is
A)-5
B)-1/5
C)1/5
D)5
فتح الحزمة
افتح القفل للوصول البطاقات البالغ عددها 68 في هذه المجموعة.
فتح الحزمة
k this deck
27
Figure 2-17
Refer to Figure 2-17.The curves shown are
A)supply curves.
B)demand curves.
C)preference curves.
D)income-consumption curves.
Refer to Figure 2-17.The curves shown are
A)supply curves.
B)demand curves.
C)preference curves.
D)income-consumption curves.
فتح الحزمة
افتح القفل للوصول البطاقات البالغ عددها 68 في هذه المجموعة.
فتح الحزمة
k this deck
28
Suppose price is measured along the vertical axis on a graph.When price changes,there will be a
A)rotation of the curve.
B)shift of the curve.
C)movement along the curve.
D)change in the slope of the curve.
A)rotation of the curve.
B)shift of the curve.
C)movement along the curve.
D)change in the slope of the curve.
فتح الحزمة
افتح القفل للوصول البطاقات البالغ عددها 68 في هذه المجموعة.
فتح الحزمة
k this deck
29
When two variables have a negative correlation,
A)they tend to move in opposite directions.
B)they tend to move in the same direction.
C)one variable will move while the other remains constant.
D)the variables' values are never positive.
A)they tend to move in opposite directions.
B)they tend to move in the same direction.
C)one variable will move while the other remains constant.
D)the variables' values are never positive.
فتح الحزمة
افتح القفل للوصول البطاقات البالغ عددها 68 في هذه المجموعة.
فتح الحزمة
k this deck
30
Figure 2-17
Refer to Figure 2-17.The movement from point B to point C is a(n)
A)shift of the demand curve.
B)movement along the demand curve.
C)indication that the price of grapes has changed.
D)indication that the costs incurred by firms that produce grapes have changed.
Refer to Figure 2-17.The movement from point B to point C is a(n)
A)shift of the demand curve.
B)movement along the demand curve.
C)indication that the price of grapes has changed.
D)indication that the costs incurred by firms that produce grapes have changed.
فتح الحزمة
افتح القفل للوصول البطاقات البالغ عددها 68 في هذه المجموعة.
فتح الحزمة
k this deck
31
Figure 2-16
Refer to Figure 2-16.The graph shown is known as a
A)time-series graph.
B)bar graph.
C)scatterplot.
D)pie chart.
Refer to Figure 2-16.The graph shown is known as a
A)time-series graph.
B)bar graph.
C)scatterplot.
D)pie chart.
فتح الحزمة
افتح القفل للوصول البطاقات البالغ عددها 68 في هذه المجموعة.
فتح الحزمة
k this deck
32
When a relevant variable that is not named on either axis changes,
A)there will be a movement along the curve.
B)the curve will rotate clockwise.
C)the curve will be unaffected since only the variables on the axis affect the curve.
D)the curve will shift.
A)there will be a movement along the curve.
B)the curve will rotate clockwise.
C)the curve will be unaffected since only the variables on the axis affect the curve.
D)the curve will shift.
فتح الحزمة
افتح القفل للوصول البطاقات البالغ عددها 68 في هذه المجموعة.
فتح الحزمة
k this deck
33
A demand curve shows the relationship between price and
A)income.
B)quantity demanded.
C)production.
D)income and quantity demanded.
A)income.
B)quantity demanded.
C)production.
D)income and quantity demanded.
فتح الحزمة
افتح القفل للوصول البطاقات البالغ عددها 68 في هذه المجموعة.
فتح الحزمة
k this deck
34
When two variables move in the same direction,the curve relating them is
A)upward sloping,and we say the variables are positively related.
B)upward sloping,and we say the variables are negatively related.
C)downward sloping,and we say the variables are positively related.
D)downward sloping,and we say the variables are negatively related.
A)upward sloping,and we say the variables are positively related.
B)upward sloping,and we say the variables are negatively related.
C)downward sloping,and we say the variables are positively related.
D)downward sloping,and we say the variables are negatively related.
فتح الحزمة
افتح القفل للوصول البطاقات البالغ عددها 68 في هذه المجموعة.
فتح الحزمة
k this deck
35
If Martina's income increases and,as a result,she chooses to buy more lattés per month at each price,then her demand curve will
A)shift to the right.
B)shift to the left.
C)not shift;instead,Martina will move along her demand curve downward and to the right.
D)not shift;instead,Martina will move along her demand curve upward and to the left.
A)shift to the right.
B)shift to the left.
C)not shift;instead,Martina will move along her demand curve downward and to the right.
D)not shift;instead,Martina will move along her demand curve upward and to the left.
فتح الحزمة
افتح القفل للوصول البطاقات البالغ عددها 68 في هذه المجموعة.
فتح الحزمة
k this deck
36
Figure 2-16
Refer to Figure 2-16.Cups of coffee per day and the hours that someone can go without sleep appear to have
A)a positive correlation.
B)a negative correlation.
C)a random correlation.
D)no correlation.
Refer to Figure 2-16.Cups of coffee per day and the hours that someone can go without sleep appear to have
A)a positive correlation.
B)a negative correlation.
C)a random correlation.
D)no correlation.
فتح الحزمة
افتح القفل للوصول البطاقات البالغ عددها 68 في هذه المجموعة.
فتح الحزمة
k this deck
37
Figure 2-17
Refer to Figure 2-17.The movement from point A to point B is a(n)
A)shift of the demand curve.
B)indication of a change in preferences for grapes.
C)movement along the demand curve.
D)indication of an increase in income.
Refer to Figure 2-17.The movement from point A to point B is a(n)
A)shift of the demand curve.
B)indication of a change in preferences for grapes.
C)movement along the demand curve.
D)indication of an increase in income.
فتح الحزمة
افتح القفل للوصول البطاقات البالغ عددها 68 في هذه المجموعة.
فتح الحزمة
k this deck
38
When two variables move in opposite directions,the curve relating them is
A)upward sloping,and we say the variables are positively related.
B)upward sloping,and we say the variables are negatively related.
C)downward sloping,and we say the variables are positively related.
D)downward sloping,and we say the variables are negatively related.
A)upward sloping,and we say the variables are positively related.
B)upward sloping,and we say the variables are negatively related.
C)downward sloping,and we say the variables are positively related.
D)downward sloping,and we say the variables are negatively related.
فتح الحزمة
افتح القفل للوصول البطاقات البالغ عددها 68 في هذه المجموعة.
فتح الحزمة
k this deck
39
Which of the following is not held constant when looking at an individual's demand curve?
A)income
B)price
C)preferences
D)the availability of alternative goods
A)income
B)price
C)preferences
D)the availability of alternative goods
فتح الحزمة
افتح القفل للوصول البطاقات البالغ عددها 68 في هذه المجموعة.
فتح الحزمة
k this deck
40
Figure 2-16
Refer to Figure 2-16.Taking cause and effect into account,which of the following interpretations would be most reasonable regarding the relationship between coffee and hours without sleep?
A)The less coffee a person drinks per day,the more time he can go without sleep.
B)There is no relationship between how much coffee per day a person drinks and how long he can go without sleep.
C)The more coffee a person drinks per day,the more time he can go without sleep.
D)The more coffee a person drinks per day,the less time he can go without sleep.
فتح الحزمة
افتح القفل للوصول البطاقات البالغ عددها 68 في هذه المجموعة.
فتح الحزمة
k this deck
41
Figure 2-18
Relationship between Price and Restaurant Meals
Refer to Figure 2-18.A movement from point A to point B is called
A)a shift in demand.
B)a movement along the demand curve.
C)a shift in supply.
D)a movement along the supply curve.
Relationship between Price and Restaurant Meals
Refer to Figure 2-18.A movement from point A to point B is called
A)a shift in demand.
B)a movement along the demand curve.
C)a shift in supply.
D)a movement along the supply curve.
فتح الحزمة
افتح القفل للوصول البطاقات البالغ عددها 68 في هذه المجموعة.
فتح الحزمة
k this deck
42
Which of the following is correct?
A)A horizontal line has an infinite slope,and a vertical line has a zero slope.
B)A horizontal line has a slope of 1,and a vertical line has a slope of -1.
C)A horizontal line has a zero slope,and a vertical line has an infinite slope.
D)A horizontal line has a slope of -1,and a vertical line has a slope of 1.
فتح الحزمة
افتح القفل للوصول البطاقات البالغ عددها 68 في هذه المجموعة.
فتح الحزمة
k this deck
43
Figure 2-18
Relationship between Price and Restaurant Meals
Refer to Figure 2-18.Which of the following could result in a movement from point A to point B?
A)a change in income
B)a change in the cost of producing a restaurant meal
C)a change in the price of restaurant meals
D)a change in the price of movies
Relationship between Price and Restaurant Meals
Refer to Figure 2-18.Which of the following could result in a movement from point A to point B?
A)a change in income
B)a change in the cost of producing a restaurant meal
C)a change in the price of restaurant meals
D)a change in the price of movies
فتح الحزمة
افتح القفل للوصول البطاقات البالغ عددها 68 في هذه المجموعة.
فتح الحزمة
k this deck
44
A relatively steep demand curve indicates that
A)quantity demanded will adjust only slightly to a price change.
B)quantity demanded will adjust significantly to a price change.
C)quantity demanded will not adjust to a price change.
D)the change in quantity demanded will exactly equal a change in price.
A)quantity demanded will adjust only slightly to a price change.
B)quantity demanded will adjust significantly to a price change.
C)quantity demanded will not adjust to a price change.
D)the change in quantity demanded will exactly equal a change in price.
فتح الحزمة
افتح القفل للوصول البطاقات البالغ عددها 68 في هذه المجموعة.
فتح الحزمة
k this deck
45
Figure 2-18
Relationship between Price and Restaurant Meals
Refer to Figure 2-18.The slope of the line containing points A and B is
A)-1/2.
B)-2.
C)1/2.
D)2.
Relationship between Price and Restaurant Meals
Refer to Figure 2-18.The slope of the line containing points A and B is
A)-1/2.
B)-2.
C)1/2.
D)2.
فتح الحزمة
افتح القفل للوصول البطاقات البالغ عددها 68 في هذه المجموعة.
فتح الحزمة
k this deck
46
When income increases the slope of an individual's demand curve,the demand curve
A)turns positive.
B)becomes undefined.
C)remains negative.
D)becomes infinite.
A)turns positive.
B)becomes undefined.
C)remains negative.
D)becomes infinite.
فتح الحزمة
افتح القفل للوصول البطاقات البالغ عددها 68 في هذه المجموعة.
فتح الحزمة
k this deck
47
The slope of a fairly flat upward-sloping line will be a
A)small positive number.
B)large positive number.
C)small negative number.
D)large negative number.
A)small positive number.
B)large positive number.
C)small negative number.
D)large negative number.
فتح الحزمة
افتح القفل للوصول البطاقات البالغ عددها 68 في هذه المجموعة.
فتح الحزمة
k this deck
48
The slope of a line is equal to
A)the change in the value of x divided by the change in the value of y.
B)the change in the value of y divided by the change in the value of x.
C)the horizontal distance divided by the vertical distance.
D)the value of y divided by the value of x.
A)the change in the value of x divided by the change in the value of y.
B)the change in the value of y divided by the change in the value of x.
C)the horizontal distance divided by the vertical distance.
D)the value of y divided by the value of x.
فتح الحزمة
افتح القفل للوصول البطاقات البالغ عددها 68 في هذه المجموعة.
فتح الحزمة
k this deck
49
A relatively flat demand curve indicates that
A)quantity demanded will adjust only slightly to a price change.
B)quantity demanded will adjust significantly to a price change.
C)quantity demanded will not adjust to a price change.
D)the change in quantity demanded will exactly equal a change in price.
A)quantity demanded will adjust only slightly to a price change.
B)quantity demanded will adjust significantly to a price change.
C)quantity demanded will not adjust to a price change.
D)the change in quantity demanded will exactly equal a change in price.
فتح الحزمة
افتح القفل للوصول البطاقات البالغ عددها 68 في هذه المجموعة.
فتح الحزمة
k this deck
50
Which of the following is not correct?
A)The slope of a line will be a small positive number for a fairly flat upward-sloping line.
B)The slope of a line will be a large positive number for a steep upward-sloping line.
C)The slope of a line will be a negative number for a downward-sloping line.
D)The slope of a line will be infinite for a horizontal line.
فتح الحزمة
افتح القفل للوصول البطاقات البالغ عددها 68 في هذه المجموعة.
فتح الحزمة
k this deck
51
Figure 2-18
Relationship between Price and Restaurant Meals
Refer to Figure 2-18.The slope of the line containing points Y and Z is
A)-0.5.
B)-1.
C)-2.
D)-4.
Relationship between Price and Restaurant Meals
Refer to Figure 2-18.The slope of the line containing points Y and Z is
A)-0.5.
B)-1.
C)-2.
D)-4.
فتح الحزمة
افتح القفل للوصول البطاقات البالغ عددها 68 في هذه المجموعة.
فتح الحزمة
k this deck
52
Figure 2-18
Relationship between Price and Restaurant Meals
Refer to Figure 2-18.A movement from point A to point Z is called
A)a shift in demand.
B)a movement along the demand curve.
C)a shift in supply.
D)a movement along the supply curve.
Relationship between Price and Restaurant Meals
Refer to Figure 2-18.A movement from point A to point Z is called
A)a shift in demand.
B)a movement along the demand curve.
C)a shift in supply.
D)a movement along the supply curve.
فتح الحزمة
افتح القفل للوصول البطاقات البالغ عددها 68 في هذه المجموعة.
فتح الحزمة
k this deck
53
Figure 2-18
Relationship between Price and Restaurant Meals
Refer to Figure 2-18.Which of the following could result in a movement from point B to point Z?
A)a change in the price of a restaurant meal
B)a change in the number of restaurant meals demanded
C)a change in income
D)Both a and b are correct.
Relationship between Price and Restaurant Meals
Refer to Figure 2-18.Which of the following could result in a movement from point B to point Z?
A)a change in the price of a restaurant meal
B)a change in the number of restaurant meals demanded
C)a change in income
D)Both a and b are correct.
فتح الحزمة
افتح القفل للوصول البطاقات البالغ عددها 68 في هذه المجموعة.
فتح الحزمة
k this deck
54
Figure 2-18
Relationship between Price and Restaurant Meals
Refer to Figure 2-18.In the ordered pair (8,24)
A)the x-coordinate is 8 and the y-coordinate is 24.
B)the x-coordinate is 24 and the y-coordinate is 8.
C)the numbers tell the location of the origin.
D)the 8 represents the price and the 24 represents the number of restaurant meals.
فتح الحزمة
افتح القفل للوصول البطاقات البالغ عددها 68 في هذه المجموعة.
فتح الحزمة
k this deck
55
The slope of a steep upward-sloping line will be a
A)small positive number.
B)large positive number.
C)small negative number.
D)large negative number.
A)small positive number.
B)large positive number.
C)small negative number.
D)large negative number.
فتح الحزمة
افتح القفل للوصول البطاقات البالغ عددها 68 في هذه المجموعة.
فتح الحزمة
k this deck
56
Suppose that someone makes the argument that because empty alcohol containers are found at many accidents,the containers cause accidents.This would be an example of
A)sound logic.
B)reverse causality.
C)omitted variables.
D)bias.
A)sound logic.
B)reverse causality.
C)omitted variables.
D)bias.
فتح الحزمة
افتح القفل للوصول البطاقات البالغ عددها 68 في هذه المجموعة.
فتح الحزمة
k this deck
57
The slope of a line is equal to
A)rise divided by run.
B)run divided by rise.
C)rise minus run.
D)rise plus run.
A)rise divided by run.
B)run divided by rise.
C)rise minus run.
D)rise plus run.
فتح الحزمة
افتح القفل للوصول البطاقات البالغ عددها 68 في هذه المجموعة.
فتح الحزمة
k this deck
58
The slope of a line passing through the points (15,3)and (10,6)is
A)-3/5.
B)3/5.
C)-5/3.
D)5/3.
A)-3/5.
B)3/5.
C)-5/3.
D)5/3.
فتح الحزمة
افتح القفل للوصول البطاقات البالغ عددها 68 في هذه المجموعة.
فتح الحزمة
k this deck
59
The slope of a line that passes through the points (20,30)and (40,14)is
A)-5/4.
B)-4/5.
C)4/5.
D)5/4.
A)-5/4.
B)-4/5.
C)4/5.
D)5/4.
فتح الحزمة
افتح القفل للوصول البطاقات البالغ عددها 68 في هذه المجموعة.
فتح الحزمة
k this deck
60
The slope of a line that passes through the points (5,8)and (12,12)is
A)-7/4.
B)-4/7.
C)4/7.
D)7/4.
A)-7/4.
B)-4/7.
C)4/7.
D)7/4.
فتح الحزمة
افتح القفل للوصول البطاقات البالغ عددها 68 في هذه المجموعة.
فتح الحزمة
k this deck
61
Figure 2-20
Relationship Between Years of Education and Annual Income
Refer to Figure 2-20.According to the graph,the correlation between years of education and annual income is
A)positive
B)negative
C)inverse
D)normative
Relationship Between Years of Education and Annual Income
Refer to Figure 2-20.According to the graph,the correlation between years of education and annual income is
A)positive
B)negative
C)inverse
D)normative
فتح الحزمة
افتح القفل للوصول البطاقات البالغ عددها 68 في هذه المجموعة.
فتح الحزمة
k this deck
62
In the early 19th century,the Russian government sent doctors to southern Russian villages to provide assistance during a cholera epidemic.The villagers noticed that wherever doctors appeared,people died.Therefore,many doctors were chased away from villages,and some were even killed.This reaction to the correlation between doctors and deaths is most likely a problem of
A)omitted variables.
B)reverse causality.
C)government propaganda.
D)medical incompetence.
A)omitted variables.
B)reverse causality.
C)government propaganda.
D)medical incompetence.
فتح الحزمة
افتح القفل للوصول البطاقات البالغ عددها 68 في هذه المجموعة.
فتح الحزمة
k this deck
63
The argument that purchases of minivans cause large families is an example of
A)omitted variables.
B)normative statements.
C)reverse causality.
D)bias.
A)omitted variables.
B)normative statements.
C)reverse causality.
D)bias.
فتح الحزمة
افتح القفل للوصول البطاقات البالغ عددها 68 في هذه المجموعة.
فتح الحزمة
k this deck
64
Alfonso has noticed that increases in unemployment insurance claims are associated with recessions,and therefore he advocates limits on unemployment insurance so as to prevent recessions.Mary has noticed that most drug addicts once attended schools,and therefore she advocates getting rid of schools so as to prevent drug addiction.
A)The reasoning of both Alfonso and Mary suffers from the omitted variable problem.
B)The reasoning of both Alfonso and Mary suffers from the reverse causality problem.
C)Alfonso's reasoning suffers from the reverse causality problem,and Mary's reasoning suffers from the omitted variable problem.
D)Mary's reasoning suffers from the reverse causality problem,and Alfonso's reasoning suffers from the omitted variable problem.
فتح الحزمة
افتح القفل للوصول البطاقات البالغ عددها 68 في هذه المجموعة.
فتح الحزمة
k this deck
65
Figure 2-20
Relationship Between Years of Education and Annual Income
Refer to Figure 2-20.Senator Smith observes the graph and concludes that people who earn higher incomes attend school for more years.Senator Jones observes the graph and concludes that people who attend school for more years earn higher incomes.Who is correct?
A)Senator Smith is correct.
B)Senator Jones is correct.
C)It is difficult to say which senator might be correct due to the reverse causality problem.
D)It is difficult to say which senator might be correct due to omitted variable bias.
فتح الحزمة
افتح القفل للوصول البطاقات البالغ عددها 68 في هذه المجموعة.
فتح الحزمة
k this deck
66
Figure 2-20
Relationship Between Years of Education and Annual Income
Refer to Figure 2-20.The graph above is a
A)bar graph
B)scatterplot
C)pie chart
D)time series analysis
Relationship Between Years of Education and Annual Income
Refer to Figure 2-20.The graph above is a
A)bar graph
B)scatterplot
C)pie chart
D)time series analysis
فتح الحزمة
افتح القفل للوصول البطاقات البالغ عددها 68 في هذه المجموعة.
فتح الحزمة
k this deck
67
Figure 2-19
In the following graph the x-axis shows the number of times a commuter rail train stops at a station per hour and the y-axis shows the number of commuter rail passengers per hour.
Commuter Rail Passengers by Frequency of Service
Refer to Figure 2-19.A policymaker observes this graph and concludes that increasing the frequency of commuter rail service is a certain way to get more commuters to choose the commuter rail instead of driving their own cars.You warn the policymaker about making a reverse causality mistake with which of the following statements?
A)Higher gas prices are causing more people to choose the commuter rail over driving.
B)The service frequency was increased in response to an increase in the number of passengers per hour.
C)There is a positive relationship between frequency of stops and number of passengers.
D)None of the above is correct.
فتح الحزمة
افتح القفل للوصول البطاقات البالغ عددها 68 في هذه المجموعة.
فتح الحزمة
k this deck
68
Figure 2-19
In the following graph the x-axis shows the number of times a commuter rail train stops at a station per hour and the y-axis shows the number of commuter rail passengers per hour.
Commuter Rail Passengers by Frequency of Service
Refer to Figure 2-19.Which of the following conclusions should not be drawn from observing this graph?
A)There is a positive correlation between the frequency of service and the number of passengers.
B)When there are 5 stops per hour,there are approximately 200 passengers.
C)More stops per hour is associated with more passengers per hour.
D)No other factors besides the frequency of service affect the number of passengers.
فتح الحزمة
افتح القفل للوصول البطاقات البالغ عددها 68 في هذه المجموعة.
فتح الحزمة
k this deck
فتح الحزمة
افتح القفل للوصول البطاقات البالغ عددها 68 في هذه المجموعة.


