Deck 8: Elementary Quantitative Data Analysis
ملء الشاشة (f)
سؤال
سؤال
سؤال
سؤال
سؤال
سؤال
سؤال
سؤال
سؤال
سؤال
سؤال
سؤال
سؤال
سؤال
سؤال
سؤال
سؤال
سؤال
سؤال
سؤال
سؤال
سؤال
سؤال
سؤال
سؤال
سؤال
سؤال
سؤال
سؤال
سؤال
سؤال
سؤال
سؤال
سؤال
سؤال
سؤال
The diagram below is a: 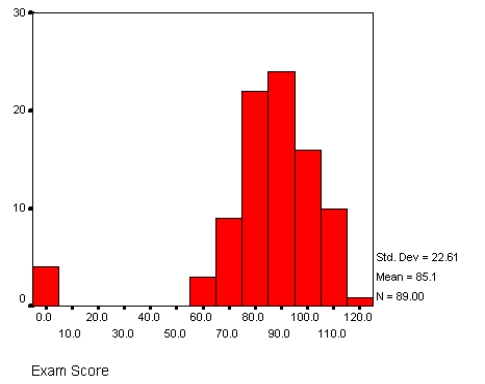
A) Mean
B) Mode
C) Bar chart
D) Frequency polygon
E) Histogram
A) Mean
B) Mode
C) Bar chart
D) Frequency polygon
E) Histogram
سؤال
The diagram below is a: 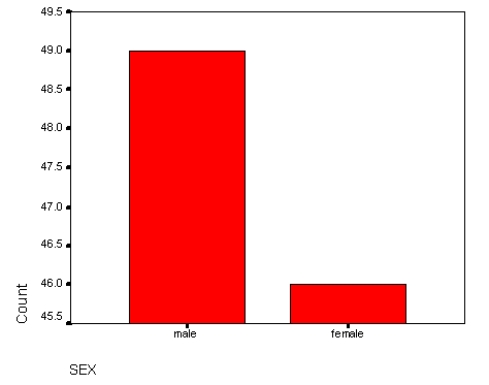
A) Mean
B) Mode
C) Bar chart
D) Frequency polygon
E) Histogram
A) Mean
B) Mode
C) Bar chart
D) Frequency polygon
E) Histogram
سؤال
The diagram below is a 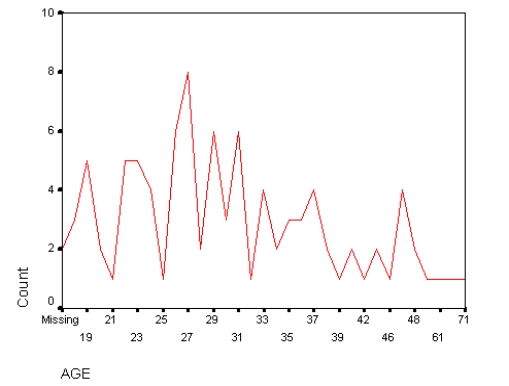
A) Mean
B) Mode
C) Bar chart
D) Frequency polygon
E) Histogram
A) Mean
B) Mode
C) Bar chart
D) Frequency polygon
E) Histogram
سؤال
سؤال
سؤال
سؤال
A student constructs the following frequency distribution based on this research hypothesis: A person's level of education predicts that person's level of prejudice. Find three things wrong with the table. Rewrite the table correctly, assuming that the sample had exactly 100 people in each category.
Table 1.1: Percent of respondents' level of prejudice by level of education.

Table 1.1: Percent of respondents' level of prejudice by level of education.
سؤال
سؤال
Using the table below, explain the hypothesis presented and describe the association between the variables in the following table (data are hypothetical):
Level of Support for Eliminating Aid to Families with Dependent Children (AFDC) by Education

Level of Support for Eliminating Aid to Families with Dependent Children (AFDC) by Education
سؤال
سؤال
سؤال
سؤال
سؤال
سؤال
سؤال
سؤال
سؤال
سؤال
سؤال
سؤال
سؤال
سؤال
سؤال
Answer the following from the data presented below: What is the range for GPA in the sample? What is the mean age of the sample? What is the modal age of the sample? What is the median age of the sample? What is the mean age of the male sub-sample? What is the median GPA of juniors? What is the modal major of the sample? Based on means, how much higher is the male GPA than the female GPA? What is the modal class of the sample? What is the median class of the sample?


فتح الحزمة
قم بالتسجيل لفتح البطاقات في هذه المجموعة!
Unlock Deck
Unlock Deck
1/59
العب
ملء الشاشة (f)
Deck 8: Elementary Quantitative Data Analysis
1
Histograms are used to display the distribution of quantitative variables that vary along a continuum.
True
2
The process of checking data for errors after the data has been entered in a computer file is called error cleansing.
False
3
Measures of central tendency assess the extent to which cases are spread out through the distribution or clustered in just one location.
False
4
Use the following to answer questions 16-18:
In each set, match a concept from Group A to a definition or example from Group B.
Measures of central tendency and variation
Group A
1. Mean
2. Median
3. Mode
4. Range
5. Standard deviation
Group B
a. The point that divides the distribution in half
b. The average squared deviation of each case from the mean
c. The most frequent value in a distribution
d. The distance from the mean that covers about two-thirds of cases
e. The highest value in a distribution minus the lowest value plus one
f. The arithmetic average of the distribution
فتح الحزمة
افتح القفل للوصول البطاقات البالغ عددها 59 في هذه المجموعة.
فتح الحزمة
k this deck
5
Use the following to answer questions 16-18:
In each set, match a concept from Group A to a definition or example from Group B.
Data Displays
Group A
1. Bar chart
2. Histogram
3. Frequency polygon
4. Normal curve
Group B
a. A distribution containing solid bars separated by spaces
b. A continuous line connecting points that represent the number or percentage of cases at each value
c. A distribution presented as fractions of a whole
d. A bell-shaped distribution centered on the mean
e. A distribution of adjacent bars
فتح الحزمة
افتح القفل للوصول البطاقات البالغ عددها 59 في هذه المجموعة.
فتح الحزمة
k this deck
6
A frequency polygon is the most relevant graph for displaying discrete, nominal variables.
فتح الحزمة
افتح القفل للوصول البطاقات البالغ عددها 59 في هذه المجموعة.
فتح الحزمة
k this deck
7
Use the following to answer questions 16-18:
In each set, match a concept from Group A to a definition or example from Group B.
Elements of a Crosstabulation
Group A
1. body of the table
2. cell
3. marginals
4. column
5. base number (N)
Group B
a. Typically divided into categories of the independent variable
b. Combinations of row and column values that represent unique combinations of values
c. The total number cases in the distribution
d. Typically divided into categories of the dependent variable
e. Part of table between row and column labels and row and column totals
f. Frequency distributions for independent and dependent variables
فتح الحزمة
افتح القفل للوصول البطاقات البالغ عددها 59 في هذه المجموعة.
فتح الحزمة
k this deck
8
Outliers may render a range useless for determining the distribution of a variable.
فتح الحزمة
افتح القفل للوصول البطاقات البالغ عددها 59 في هذه المجموعة.
فتح الحزمة
k this deck
9
Nominal variables should be displayed on:
A) Bar charts
B) Histograms
C) Frequency polygons
D) Both a and b
E) All of the above
A) Bar charts
B) Histograms
C) Frequency polygons
D) Both a and b
E) All of the above
فتح الحزمة
افتح القفل للوصول البطاقات البالغ عددها 59 في هذه المجموعة.
فتح الحزمة
k this deck
10
Crosstabulations show relationships between ____________, while elaboration considers _____________.
A) one variable, two variables
B) two variables, three or more variables,
C) independent variables, independent and dependent variables
D) categoric variables, numeric variables
E) nominal variables, ratio variables
A) one variable, two variables
B) two variables, three or more variables,
C) independent variables, independent and dependent variables
D) categoric variables, numeric variables
E) nominal variables, ratio variables
فتح الحزمة
افتح القفل للوصول البطاقات البالغ عددها 59 في هذه المجموعة.
فتح الحزمة
k this deck
11
The measure of central tendency most appropriate for nominal variables is the mode.
فتح الحزمة
افتح القفل للوصول البطاقات البالغ عددها 59 في هذه المجموعة.
فتح الحزمة
k this deck
12
Standard deviation is defined as the square root of the variance.
فتح الحزمة
افتح القفل للوصول البطاقات البالغ عددها 59 في هذه المجموعة.
فتح الحزمة
k this deck
13
Data cleaning occurs before data entry.
فتح الحزمة
افتح القفل للوصول البطاقات البالغ عددها 59 في هذه المجموعة.
فتح الحزمة
k this deck
14
A normal distribution is generally bell-shaped.
فتح الحزمة
افتح القفل للوصول البطاقات البالغ عددها 59 في هذه المجموعة.
فتح الحزمة
k this deck
15
A frequency polygon contains solid bars separated by spaces.
فتح الحزمة
افتح القفل للوصول البطاقات البالغ عددها 59 في هذه المجموعة.
فتح الحزمة
k this deck
16
In distributions with an even number of cases, the median is computed by taking the arithmetic average between the two middle cases.
فتح الحزمة
افتح القفل للوصول البطاقات البالغ عددها 59 في هذه المجموعة.
فتح الحزمة
k this deck
17
Means are affected by skewness, while medians are not.
فتح الحزمة
افتح القفل للوصول البطاقات البالغ عددها 59 في هذه المجموعة.
فتح الحزمة
k this deck
18
Descriptive statistics estimate the degree of confidence in generalizations made from a sample to a population.
فتح الحزمة
افتح القفل للوصول البطاقات البالغ عددها 59 في هذه المجموعة.
فتح الحزمة
k this deck
19
Chi square is an inferential statistic.
فتح الحزمة
افتح القفل للوصول البطاقات البالغ عددها 59 في هذه المجموعة.
فتح الحزمة
k this deck
20
Elaboration analysis demonstrations the distribution of variables on x and y axes.
فتح الحزمة
افتح القفل للوصول البطاقات البالغ عددها 59 في هذه المجموعة.
فتح الحزمة
k this deck
21
In the following distribution of the variable semesters completed, which is the range: 4, 3, 1, 0, 3, 3, 4, 0, 3, 2?
A) 1
B) 2
C) 3
D) 4
E) 5
A) 1
B) 2
C) 3
D) 4
E) 5
فتح الحزمة
افتح القفل للوصول البطاقات البالغ عددها 59 في هذه المجموعة.
فتح الحزمة
k this deck
22
Which of the following is not a guideline for constructing graphs?
A) Begin the graph of a quantitative variable at zero on both axes.
B) Always use bars of equal width.
C) The two axes should be of approximately equal length.
D) Avoid "chart junk" that clutters the graph.
E) When possible, use graphics instead of bars.
A) Begin the graph of a quantitative variable at zero on both axes.
B) Always use bars of equal width.
C) The two axes should be of approximately equal length.
D) Avoid "chart junk" that clutters the graph.
E) When possible, use graphics instead of bars.
فتح الحزمة
افتح القفل للوصول البطاقات البالغ عددها 59 في هذه المجموعة.
فتح الحزمة
k this deck
23
The presence of outliers suggests what about the shape of a variable's distribution?
A) It is normal
B) It is skewed
C) It is unimodal
D) It is bimodal
E) It is multimodal
A) It is normal
B) It is skewed
C) It is unimodal
D) It is bimodal
E) It is multimodal
فتح الحزمة
افتح القفل للوصول البطاقات البالغ عددها 59 في هذه المجموعة.
فتح الحزمة
k this deck
24
In the following distribution of the variable semesters completed, which is closest to the mean: 4, 3, 1, 0, 3, 3, 4, 0, 3, 2?
A) 0
B) 1
C) 2
D) 3
E) 4
A) 0
B) 1
C) 2
D) 3
E) 4
فتح الحزمة
افتح القفل للوصول البطاقات البالغ عددها 59 في هذه المجموعة.
فتح الحزمة
k this deck
25
What statistic is used to determine whether a significant relationship exists between two variables in a crosstab?
A) Alpha
B) Beta
C) Gamma
D) Delta
E) Epsilon
A) Alpha
B) Beta
C) Gamma
D) Delta
E) Epsilon
فتح الحزمة
افتح القفل للوصول البطاقات البالغ عددها 59 في هذه المجموعة.
فتح الحزمة
k this deck
26
In which of the following can you control for an extraneous variable?
A) Bar chart
B) Frequency distribution
C) Frequency polygon
D) Elaboration analysis
E) Crosstabulation
A) Bar chart
B) Frequency distribution
C) Frequency polygon
D) Elaboration analysis
E) Crosstabulation
فتح الحزمة
افتح القفل للوصول البطاقات البالغ عددها 59 في هذه المجموعة.
فتح الحزمة
k this deck
27
In a normal curve, about what percent of all cases falls within plus or minus two standard deviations?
A) 10%
B) 25%
C) 50%
D) 68%
E) 95%
A) 10%
B) 25%
C) 50%
D) 68%
E) 95%
فتح الحزمة
افتح القفل للوصول البطاقات البالغ عددها 59 في هذه المجموعة.
فتح الحزمة
k this deck
28
In the following distribution of the variable semesters completed, which is median: 4, 3, 1, 0, 3, 3, 4, 0, 3, 2, 4?
A) 0
B) 1
C) 2
D) 3
E) 4
A) 0
B) 1
C) 2
D) 3
E) 4
فتح الحزمة
افتح القفل للوصول البطاقات البالغ عددها 59 في هذه المجموعة.
فتح الحزمة
k this deck
29
In the following distribution of the variable semesters completed, which is the mode: 4, 3, 1, 0, 3, 3, 4, 0, 3, 2?
A) 0
B) 1
C) 2
D) 3
E) 4
A) 0
B) 1
C) 2
D) 3
E) 4
فتح الحزمة
افتح القفل للوصول البطاقات البالغ عددها 59 في هذه المجموعة.
فتح الحزمة
k this deck
30
In a crosstabs, the cells display:
A) Counts
B) Percentages
C) Categories of the dependent variable
D) Both a and b
E) All of the above
A) Counts
B) Percentages
C) Categories of the dependent variable
D) Both a and b
E) All of the above
فتح الحزمة
افتح القفل للوصول البطاقات البالغ عددها 59 في هذه المجموعة.
فتح الحزمة
k this deck
31
The process of checking data carefully for errors is known as:
A) Data reduction
B) Data cleaning
C) Data dredging
D) Data definition
E) Data analysis
A) Data reduction
B) Data cleaning
C) Data dredging
D) Data definition
E) Data analysis
فتح الحزمة
افتح القفل للوصول البطاقات البالغ عددها 59 في هذه المجموعة.
فتح الحزمة
k this deck
32
Which summary statistic should be used for nominal variables?
A) Range
B) Variance
C) Mean
D) Median
E) Mode
A) Range
B) Variance
C) Mean
D) Median
E) Mode
فتح الحزمة
افتح القفل للوصول البطاقات البالغ عددها 59 في هذه المجموعة.
فتح الحزمة
k this deck
33
When researchers analyze data that they did not collect, such as the General Social Survey, they are conducting what type of research?
A) Primary research
B) Data cleaning
C) Historical research
D) Secondary research
E) Repetition
A) Primary research
B) Data cleaning
C) Historical research
D) Secondary research
E) Repetition
فتح الحزمة
افتح القفل للوصول البطاقات البالغ عددها 59 في هذه المجموعة.
فتح الحزمة
k this deck
34
The total number of cases in a distribution is called:
A) The base number N
B) The range
C) The row marginal
D) The mode
E) The frequency
A) The base number N
B) The range
C) The row marginal
D) The mode
E) The frequency
فتح الحزمة
افتح القفل للوصول البطاقات البالغ عددها 59 في هذه المجموعة.
فتح الحزمة
k this deck
35
What measure of variability is most appropriate for a ratio variable with many outliers?
A) Median
B) Range
C) Interquartile range
D) Variance
E) Standard deviation
A) Median
B) Range
C) Interquartile range
D) Variance
E) Standard deviation
فتح الحزمة
افتح القفل للوصول البطاقات البالغ عددها 59 في هذه المجموعة.
فتح الحزمة
k this deck
36
The diagram below is a:
A) Mean
B) Mode
C) Bar chart
D) Frequency polygon
E) Histogram
A) Mean
B) Mode
C) Bar chart
D) Frequency polygon
E) Histogram
فتح الحزمة
افتح القفل للوصول البطاقات البالغ عددها 59 في هذه المجموعة.
فتح الحزمة
k this deck
37
The diagram below is a:
A) Mean
B) Mode
C) Bar chart
D) Frequency polygon
E) Histogram
A) Mean
B) Mode
C) Bar chart
D) Frequency polygon
E) Histogram
فتح الحزمة
افتح القفل للوصول البطاقات البالغ عددها 59 في هذه المجموعة.
فتح الحزمة
k this deck
38
The diagram below is a
A) Mean
B) Mode
C) Bar chart
D) Frequency polygon
E) Histogram
A) Mean
B) Mode
C) Bar chart
D) Frequency polygon
E) Histogram
فتح الحزمة
افتح القفل للوصول البطاقات البالغ عددها 59 في هذه المجموعة.
فتح الحزمة
k this deck
39
Which of the following data displays would be most appropriate for displaying the distribution of gender (male, female, other)?
A) Mean
B) Median
C) Bar chart
D) Frequency polygon
E) Histogram
A) Mean
B) Median
C) Bar chart
D) Frequency polygon
E) Histogram
فتح الحزمة
افتح القفل للوصول البطاقات البالغ عددها 59 في هذه المجموعة.
فتح الحزمة
k this deck
40
Which of the following data displays represent data not as bars, but as connected points in a single line?
A) Mean
B) Mode
C) Bar chart
D) Frequency polygon
E) Histogram
A) Mean
B) Mode
C) Bar chart
D) Frequency polygon
E) Histogram
فتح الحزمة
افتح القفل للوصول البطاقات البالغ عددها 59 في هذه المجموعة.
فتح الحزمة
k this deck
41
A type of descriptive statistic that summarizes the strength of an association:
A) Measure of Significance
B) Measure of Central Tendency
C) Measure of Variation
D) Measure of Association
E) None of the above
A) Measure of Significance
B) Measure of Central Tendency
C) Measure of Variation
D) Measure of Association
E) None of the above
فتح الحزمة
افتح القفل للوصول البطاقات البالغ عددها 59 في هذه المجموعة.
فتح الحزمة
k this deck
42
A student constructs the following frequency distribution based on this research hypothesis: A person's level of education predicts that person's level of prejudice. Find three things wrong with the table. Rewrite the table correctly, assuming that the sample had exactly 100 people in each category.
Table 1.1: Percent of respondents' level of prejudice by level of education.
Table 1.1: Percent of respondents' level of prejudice by level of education.
فتح الحزمة
افتح القفل للوصول البطاقات البالغ عددها 59 في هذه المجموعة.
فتح الحزمة
k this deck
43
Describe circumstances in which mean, median, and modes are best used as measures of central tendency, providing at least two concrete examples for each.
فتح الحزمة
افتح القفل للوصول البطاقات البالغ عددها 59 في هذه المجموعة.
فتح الحزمة
k this deck
44
Using the table below, explain the hypothesis presented and describe the association between the variables in the following table (data are hypothetical):
Level of Support for Eliminating Aid to Families with Dependent Children (AFDC) by Education
Level of Support for Eliminating Aid to Families with Dependent Children (AFDC) by Education
فتح الحزمة
افتح القفل للوصول البطاقات البالغ عددها 59 في هذه المجموعة.
فتح الحزمة
k this deck
45
Compute three measures of central tendency and two measures of variability for the following data set: When asked their age, ten college students responded: 21, 19, 20, 18, 18, 19, 33, 22, 19, 18. Given this distribution, which measures of central tendency and variability are most appropriate? Explain your decision, drawing a graph or creating a frequency distribution as necessary.
فتح الحزمة
افتح القفل للوصول البطاقات البالغ عددها 59 في هذه المجموعة.
فتح الحزمة
k this deck
46
Consider the use of bar charts, histograms, and frequency polygons. When are each appropriate? Sketch each type of graph. What standards exist for presenting graphic data in social research?
Answer Key
Answer Key
فتح الحزمة
افتح القفل للوصول البطاقات البالغ عددها 59 في هذه المجموعة.
فتح الحزمة
k this deck
47
When a researcher has a distribution in which two nonadjacent categories have about the same number of cases, this is referred to as a:
A) Mean
B) Bimodal
C) Binomial
D) Unimodal
E) Frequency
A) Mean
B) Bimodal
C) Binomial
D) Unimodal
E) Frequency
فتح الحزمة
افتح القفل للوصول البطاقات البالغ عددها 59 في هذه المجموعة.
فتح الحزمة
k this deck
48
Which of the following is false about standard deviations?
A) It tells how wide the variation of any set of cases is.
B) It is the square root of the variance.
C) It is the square root of the average squared deviation of each case from the mean.
D) It is the preferred measure of variability when a variable in normally distributed.
E) It is a measure of central tendency.
فتح الحزمة
افتح القفل للوصول البطاقات البالغ عددها 59 في هذه المجموعة.
فتح الحزمة
k this deck
49
Consider the relationship between gender, wages, and years of experience on the job. Draw a table in which you propose a hypothesis that involves a bivariate relationship between two of these variables, but considers the third as an extraneous variable (obviously, the cells will remain empty in this table). Explain your rationale for choosing the extraneous variable.
فتح الحزمة
افتح القفل للوصول البطاقات البالغ عددها 59 في هذه المجموعة.
فتح الحزمة
k this deck
50
What does statistical significance mean with regard to the association between two variables?
A) Association is likely to be due to chance.
B) Association is not likely to be due to chance.
C) Association is likely to be due to a third variable.
D) Association is not likely to be due to a third variable.
E) Association exists and is deemed to be strong.
A) Association is likely to be due to chance.
B) Association is not likely to be due to chance.
C) Association is likely to be due to a third variable.
D) Association is not likely to be due to a third variable.
E) Association exists and is deemed to be strong.
فتح الحزمة
افتح القفل للوصول البطاقات البالغ عددها 59 في هذه المجموعة.
فتح الحزمة
k this deck
51
What three features are important for describing the shape of a variable's distribution?
فتح الحزمة
افتح القفل للوصول البطاقات البالغ عددها 59 في هذه المجموعة.
فتح الحزمة
k this deck
52
John is using GSS data in order to conduct his study so that he doesn't have to collect his own data. He will most likely be conducting:
A) Secondary data analysis
B) Data cleaning
C) Qualitative data analysis
D) Primary data analysis
E) None of the above
A) Secondary data analysis
B) Data cleaning
C) Qualitative data analysis
D) Primary data analysis
E) None of the above
فتح الحزمة
افتح القفل للوصول البطاقات البالغ عددها 59 في هذه المجموعة.
فتح الحزمة
k this deck
53
A graph with a normal distribution looks like which of the following?
A) A balance beam with two equal size bags on either side of the median
B) A box with a wide base and short sides
C) A bell with a hump in the middle and sloping sides
D) A pyramid with broad based extension across the range of cases
E) A barbell with equal weight on either side
A) A balance beam with two equal size bags on either side of the median
B) A box with a wide base and short sides
C) A bell with a hump in the middle and sloping sides
D) A pyramid with broad based extension across the range of cases
E) A barbell with equal weight on either side
فتح الحزمة
افتح القفل للوصول البطاقات البالغ عددها 59 في هذه المجموعة.
فتح الحزمة
k this deck
54
Describe situations in which a variable's variability is best measured by the range, interquartile range, and standard deviation, providing at least two concrete examples of each.
فتح الحزمة
افتح القفل للوصول البطاقات البالغ عددها 59 في هذه المجموعة.
فتح الحزمة
k this deck
55
What is the purpose of using statistics in social science? What are the advantages and disadvantages of relying on statistics?
فتح الحزمة
افتح القفل للوصول البطاقات البالغ عددها 59 في هذه المجموعة.
فتح الحزمة
k this deck
56
Which of the following would best illustrate marital status in a diagram as explained in the text?
A) Histogram
B) Frequency polygon
C) Box plot
D) Bar chart
E) Pie chart
A) Histogram
B) Frequency polygon
C) Box plot
D) Bar chart
E) Pie chart
فتح الحزمة
افتح القفل للوصول البطاقات البالغ عددها 59 في هذه المجموعة.
فتح الحزمة
k this deck
57
How can statistics be unethically manipulated? Outline the specific ethical considerations associated with using statistics for social data analysis.
فتح الحزمة
افتح القفل للوصول البطاقات البالغ عددها 59 في هذه المجموعة.
فتح الحزمة
k this deck
58
Which of the following is not a measure of variation?
A) Range
B) Mean
C) Standard deviation
D) Variance
E) Normal distribution
A) Range
B) Mean
C) Standard deviation
D) Variance
E) Normal distribution
فتح الحزمة
افتح القفل للوصول البطاقات البالغ عددها 59 في هذه المجموعة.
فتح الحزمة
k this deck
59
Answer the following from the data presented below: What is the range for GPA in the sample? What is the mean age of the sample? What is the modal age of the sample? What is the median age of the sample? What is the mean age of the male sub-sample? What is the median GPA of juniors? What is the modal major of the sample? Based on means, how much higher is the male GPA than the female GPA? What is the modal class of the sample? What is the median class of the sample?
فتح الحزمة
افتح القفل للوصول البطاقات البالغ عددها 59 في هذه المجموعة.
فتح الحزمة
k this deck
فتح الحزمة
افتح القفل للوصول البطاقات البالغ عددها 59 في هذه المجموعة.


