Deck 4: Visualizations: Using Visualizations and Summaries to Share Results
سؤال
سؤال
سؤال
سؤال
سؤال
سؤال
سؤال
سؤال
سؤال
سؤال
سؤال
سؤال
سؤال
سؤال
سؤال
سؤال
سؤال
سؤال
سؤال
سؤال
سؤال
سؤال
سؤال
سؤال
سؤال
سؤال
سؤال
سؤال
سؤال
سؤال
سؤال
سؤال
سؤال
سؤال
سؤال
سؤال
سؤال
سؤال
سؤال
سؤال
سؤال
سؤال
سؤال
سؤال
سؤال
سؤال
سؤال
سؤال
سؤال
سؤال

فتح الحزمة
قم بالتسجيل لفتح البطاقات في هذه المجموعة!
Unlock Deck
Unlock Deck
1/50
العب
ملء الشاشة (f)
Deck 4: Visualizations: Using Visualizations and Summaries to Share Results
1
Nominal data is the simplest form of data.
True
2
The standard normal distribution has 1 for its mean,median,and mode.
False
3
After completing your data analysis,the write-up should only include a discussion of the steps of the IMPACT model that really matter.
False
4
There are very few methods for visualizing quantitative date.

فتح الحزمة
افتح القفل للوصول البطاقات البالغ عددها 50 في هذه المجموعة.
فتح الحزمة
k this deck
5
When work is completed with qualitative data,it will most frequently be visualized using the tools in Quadrant 1,the declarative,data-driven quadrant.

فتح الحزمة
افتح القفل للوصول البطاقات البالغ عددها 50 في هذه المجموعة.
فتح الحزمة
k this deck
6
The charts most frequently considered for depicting quantitative data are bar charts,pie charts and stacked bar charts.

فتح الحزمة
افتح القفل للوصول البطاقات البالغ عددها 50 في هذه المجموعة.
فتح الحزمة
k this deck
7
Declarative visualizations are the product of wanting to declare or present your findings to an audience.

فتح الحزمة
افتح القفل للوصول البطاقات البالغ عددها 50 في هذه المجموعة.
فتح الحزمة
k this deck
8
Interval data is more sophisticated than ratio data.

فتح الحزمة
افتح القفل للوصول البطاقات البالغ عددها 50 في هذه المجموعة.
فتح الحزمة
k this deck
9
The primary statistic used with quantitative data is proportion.

فتح الحزمة
افتح القفل للوصول البطاقات البالغ عددها 50 في هذه المجموعة.
فتح الحزمة
k this deck
10
Qualitative data is categorical data.

فتح الحزمة
افتح القفل للوصول البطاقات البالغ عددها 50 في هذه المجموعة.
فتح الحزمة
k this deck
11
In describing interval data,0 does not mean "the absence of," but is simply another number.

فتح الحزمة
افتح القفل للوصول البطاقات البالغ عددها 50 في هذه المجموعة.
فتح الحزمة
k this deck
12
Continuous data is data that can take on any value within a range.

فتح الحزمة
افتح القفل للوصول البطاقات البالغ عددها 50 في هذه المجموعة.
فتح الحزمة
k this deck
13
The standard normal distribution has a 0 for its standard deviation.

فتح الحزمة
افتح القفل للوصول البطاقات البالغ عددها 50 في هذه المجموعة.
فتح الحزمة
k this deck
14
The normal distribution is a phenomenon that many naturally occurring datasets in our world follow.

فتح الحزمة
افتح القفل للوصول البطاقات البالغ عددها 50 في هذه المجموعة.
فتح الحزمة
k this deck
15
Both nominal and ordinal data can also be referred to as data-driven.

فتح الحزمة
افتح القفل للوصول البطاقات البالغ عددها 50 في هذه المجموعة.
فتح الحزمة
k this deck
16
Data visualizations should not be used to satisfy an exploratory purpose.

فتح الحزمة
افتح القفل للوصول البطاقات البالغ عددها 50 في هذه المجموعة.
فتح الحزمة
k this deck
17
Declarative visualizations are the product of wanting to 'declare' or present your findings to an audience.

فتح الحزمة
افتح القفل للوصول البطاقات البالغ عددها 50 في هذه المجموعة.
فتح الحزمة
k this deck
18
Discrete data is data that is represented by fractions of numbers.

فتح الحزمة
افتح القفل للوصول البطاقات البالغ عددها 50 في هذه المجموعة.
فتح الحزمة
k this deck
19
Ratio data is considered the most sophisticated type of data.

فتح الحزمة
افتح القفل للوصول البطاقات البالغ عددها 50 في هذه المجموعة.
فتح الحزمة
k this deck
20
If you are comparing two datasets that follow the normal distribution,even if the two datasets have very different means,you can still compare them by standardizing the distributions with Zscores.

فتح الحزمة
افتح القفل للوصول البطاقات البالغ عددها 50 في هذه المجموعة.
فتح الحزمة
k this deck
21
The following charts are frequently considered for depicting qualitative data except:
A) Line chart
B) Pie chart
C) Bar chart
D) Stacked bar chart
A) Line chart
B) Pie chart
C) Bar chart
D) Stacked bar chart

فتح الحزمة
افتح القفل للوصول البطاقات البالغ عددها 50 في هذه المجموعة.
فتح الحزمة
k this deck
22
Polar bears,brown bears,black bears,and panda bears would be best described as an example of:
A) Nominal data
B) Ordinal data
C) Ratio data
D) Interval data
A) Nominal data
B) Ordinal data
C) Ratio data
D) Interval data

فتح الحزمة
افتح القفل للوصول البطاقات البالغ عددها 50 في هذه المجموعة.
فتح الحزمة
k this deck
23
The following are typical examples of interval data except:
A) Time
B) Temperature
C) Standardized exam score
D) Type of car owned
A) Time
B) Temperature
C) Standardized exam score
D) Type of car owned

فتح الحزمة
افتح القفل للوصول البطاقات البالغ عددها 50 في هذه المجموعة.
فتح الحزمة
k this deck
24
Latitude and longitude would be best described as an example of:
A) Nominal data
B) Ordinal data
C) Ratio data
D) Discrete data
A) Nominal data
B) Ordinal data
C) Ratio data
D) Discrete data

فتح الحزمة
افتح القفل للوصول البطاقات البالغ عددها 50 في هذه المجموعة.
فتح الحزمة
k this deck
25
Red,Yellow,and Blue would be best described as an example of:
A) Nominal data
B) Ordinal data
C) Structured data
D) Test data
A) Nominal data
B) Ordinal data
C) Structured data
D) Test data

فتح الحزمة
افتح القفل للوصول البطاقات البالغ عددها 50 في هذه المجموعة.
فتح الحزمة
k this deck
26
1st place,2nd place,and 3rd place would be best described as an example of:
A) Nominal data
B) Ordinal data
C) Structured data
D) Interval data
A) Nominal data
B) Ordinal data
C) Structured data
D) Interval data

فتح الحزمة
افتح القفل للوصول البطاقات البالغ عددها 50 في هذه المجموعة.
فتح الحزمة
k this deck
27
The following are typical examples of ordinal data except:
A) Distance
B) Position in a race
C) Hardness of a mineral
D) Military rank
A) Distance
B) Position in a race
C) Hardness of a mineral
D) Military rank

فتح الحزمة
افتح القفل للوصول البطاقات البالغ عددها 50 في هذه المجموعة.
فتح الحزمة
k this deck
28
The following are characteristics of interval data except:
A) Measured
B) Ordered
C) Equidistant
D) Meaningful zero
A) Measured
B) Ordered
C) Equidistant
D) Meaningful zero

فتح الحزمة
افتح القفل للوصول البطاقات البالغ عددها 50 في هذه المجموعة.
فتح الحزمة
k this deck
29
The following are typical examples of nominal data except:
A) Hair color
B) Eye color
C) Gender
D) Height
A) Hair color
B) Eye color
C) Gender
D) Height

فتح الحزمة
افتح القفل للوصول البطاقات البالغ عددها 50 في هذه المجموعة.
فتح الحزمة
k this deck
30
________ is data that is represented by whole numbers.
A) Continuous data
B) Discrete data
C) Interval data
D) Ordinal data
A) Continuous data
B) Discrete data
C) Interval data
D) Ordinal data

فتح الحزمة
افتح القفل للوصول البطاقات البالغ عددها 50 في هذه المجموعة.
فتح الحزمة
k this deck
31
Letter grades of A,B,and C would be best described as an example of:
A) Nominal data
B) Ordinal data
C) Ratio data
D) Interval data
A) Nominal data
B) Ordinal data
C) Ratio data
D) Interval data

فتح الحزمة
افتح القفل للوصول البطاقات البالغ عددها 50 في هذه المجموعة.
فتح الحزمة
k this deck
32
The following are typical examples of ratio data except:
A) Weight
B) Birth date
C) Height
D) Pulse rate
A) Weight
B) Birth date
C) Height
D) Pulse rate

فتح الحزمة
افتح القفل للوصول البطاقات البالغ عددها 50 في هذه المجموعة.
فتح الحزمة
k this deck
33
________ are the product of wanting to present findings to an audience.
A) Declarative visualizations
B) Static visualizations
C) Exploratory visualizations
D) Interactive visualizations
A) Declarative visualizations
B) Static visualizations
C) Exploratory visualizations
D) Interactive visualizations

فتح الحزمة
افتح القفل للوصول البطاقات البالغ عددها 50 في هذه المجموعة.
فتح الحزمة
k this deck
34
The following are typical examples of nominal data except:
A) Marital status
B) State of residency
C) Temperature
D) Nationality
A) Marital status
B) State of residency
C) Temperature
D) Nationality

فتح الحزمة
افتح القفل للوصول البطاقات البالغ عددها 50 في هذه المجموعة.
فتح الحزمة
k this deck
35
Results using the Fahrenheit scale would be best described as an example of:
A) Nominal data
B) Ordinal data
C) Ratio data
D) Interval data
A) Nominal data
B) Ordinal data
C) Ratio data
D) Interval data

فتح الحزمة
افتح القفل للوصول البطاقات البالغ عددها 50 في هذه المجموعة.
فتح الحزمة
k this deck
36
The following are typical examples of nominal data except:
A) Grade point average
B) Zip codes
C) Eye color
D) Gender
A) Grade point average
B) Zip codes
C) Eye color
D) Gender

فتح الحزمة
افتح القفل للوصول البطاقات البالغ عددها 50 في هذه المجموعة.
فتح الحزمة
k this deck
37
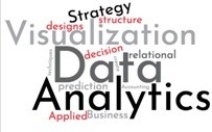
The chart below is an example of a ________. 
A) Word map
B) Word cloud
C) Word chart
D) Word plot

A) Word map
B) Word cloud
C) Word chart
D) Word plot

فتح الحزمة
افتح القفل للوصول البطاقات البالغ عددها 50 في هذه المجموعة.
فتح الحزمة
k this deck
38
The following charts are frequently considered for depicting quantitative data except:
A) Scatter plots
B) Box plots
C) Line chart
D) Pie chart
A) Scatter plots
B) Box plots
C) Line chart
D) Pie chart

فتح الحزمة
افتح القفل للوصول البطاقات البالغ عددها 50 في هذه المجموعة.
فتح الحزمة
k this deck
39
The following are typical examples of ordinal data except:
A) Blood type
B) Political affiliation
C) Education level
D) Letter grade
A) Blood type
B) Political affiliation
C) Education level
D) Letter grade

فتح الحزمة
افتح القفل للوصول البطاقات البالغ عددها 50 في هذه المجموعة.
فتح الحزمة
k this deck
40
The following are typical examples of ratio data except:
A) Currency
B) Temperature
C) Length
D) Interval data
A) Currency
B) Temperature
C) Length
D) Interval data

فتح الحزمة
افتح القفل للوصول البطاقات البالغ عددها 50 في هذه المجموعة.
فتح الحزمة
k this deck
41
Which of the following is not an example of discrete data?
A) Points earned in a basketball game
B) Points earned in a hockey game
C) Points earned in a diving match
D) Points earned in a soccer game
A) Points earned in a basketball game
B) Points earned in a hockey game
C) Points earned in a diving match
D) Points earned in a soccer game

فتح الحزمة
افتح القفل للوصول البطاقات البالغ عددها 50 في هذه المجموعة.
فتح الحزمة
k this deck
42
________ is more complex than ________.
A) Qualitative data; quantitative data
B) Quantitative data; qualitative data
C) Training data; test data
D) Test data; training data
A) Qualitative data; quantitative data
B) Quantitative data; qualitative data
C) Training data; test data
D) Test data; training data

فتح الحزمة
افتح القفل للوصول البطاقات البالغ عددها 50 في هذه المجموعة.
فتح الحزمة
k this deck
43
Which of the following is not one of the four main questions to consider when creating your data scale and increments?
A) How much data should be displayed in the visualization?
B) Should outliers be displayed?
C) What scale should be used to display the data?
D) Which colors should be displayed?
A) How much data should be displayed in the visualization?
B) Should outliers be displayed?
C) What scale should be used to display the data?
D) Which colors should be displayed?

فتح الحزمة
افتح القفل للوصول البطاقات البالغ عددها 50 في هذه المجموعة.
فتح الحزمة
k this deck
44
Which of the following is not an example of continuous data?
A) Meters swam in 25 minutes
B) Miles run in 25 minutes
C) Free throws made in 25 minutes
D) Laps biked in 25 minutes
A) Meters swam in 25 minutes
B) Miles run in 25 minutes
C) Free throws made in 25 minutes
D) Laps biked in 25 minutes

فتح الحزمة
افتح القفل للوصول البطاقات البالغ عددها 50 في هذه المجموعة.
فتح الحزمة
k this deck
45
Which of the following charts best visualizes a Bar chart?
A)
B)
C)
D)
A)

B)

C)

D)


فتح الحزمة
افتح القفل للوصول البطاقات البالغ عددها 50 في هذه المجموعة.
فتح الحزمة
k this deck
46
After completing your data analysis,the write-up should include a discussion of which of the following:
A) Only the steps of the IMPACT model you consider important
B) Only the steps of the IMPACT model your client will understand
C) All steps of the IMPACT model
D) All steps of the IMPACT model your client will understand
A) Only the steps of the IMPACT model you consider important
B) Only the steps of the IMPACT model your client will understand
C) All steps of the IMPACT model
D) All steps of the IMPACT model your client will understand

فتح الحزمة
افتح القفل للوصول البطاقات البالغ عددها 50 في هذه المجموعة.
فتح الحزمة
k this deck
47
When considering the color theme for a visualization,which is the best color theme for a color blind audience?
A) orange/blue scale
B) red/green scale
C) gray scale
D) red/blue scale
A) orange/blue scale
B) red/green scale
C) gray scale
D) red/blue scale

فتح الحزمة
افتح القفل للوصول البطاقات البالغ عددها 50 في هذه المجموعة.
فتح الحزمة
k this deck
48
Which type of chart is best described as useful for when quartiles,median,and outliers are required for analysis and insights?
A) Scatter plots
B) Box and whisker plots
C) Line chart
D) Pie chart
A) Scatter plots
B) Box and whisker plots
C) Line chart
D) Pie chart

فتح الحزمة
افتح القفل للوصول البطاقات البالغ عددها 50 في هذه المجموعة.
فتح الحزمة
k this deck
49
As discussed in the book and consistent with the writings of author Justin Zobel,your written business communications should be directed towards ________.
A) your supervisor
B) your reviewer
C) your audience
D) your customer
A) your supervisor
B) your reviewer
C) your audience
D) your customer

فتح الحزمة
افتح القفل للوصول البطاقات البالغ عددها 50 في هذه المجموعة.
فتح الحزمة
k this deck
50
Which type of chart is best described as useful for identifying the correlation between two variables or for identifying a trend line or line of best fit?
A) Scatter plots
B) Box and whisker plots
C) Line chart
D) Pie chart
A) Scatter plots
B) Box and whisker plots
C) Line chart
D) Pie chart

فتح الحزمة
افتح القفل للوصول البطاقات البالغ عددها 50 في هذه المجموعة.
فتح الحزمة
k this deck


