Deck 13: Project Evaluation and Control
ملء الشاشة (f)
سؤال
سؤال
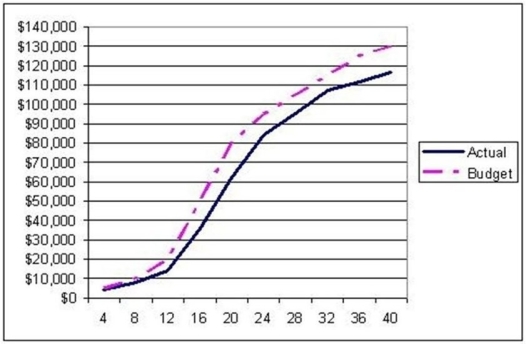
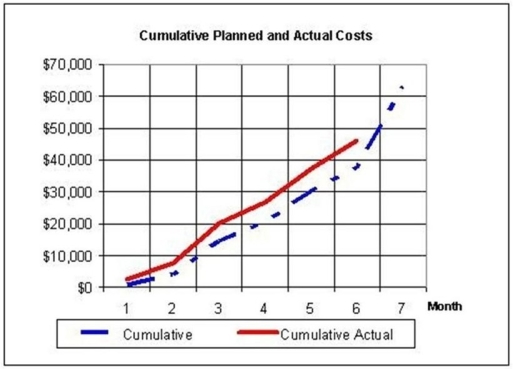
Use the S-curve where the solid line is actual cost and the dashed line is budgeted cost to choose the BEST statement.
A)The project never experiences negative variance.
B)With regards to budget,the project starts badly but finishes well
C)With regards to budget,the project starts well but finishes badly.
D)The project is in a constant state of positive variance.
سؤال
سؤال
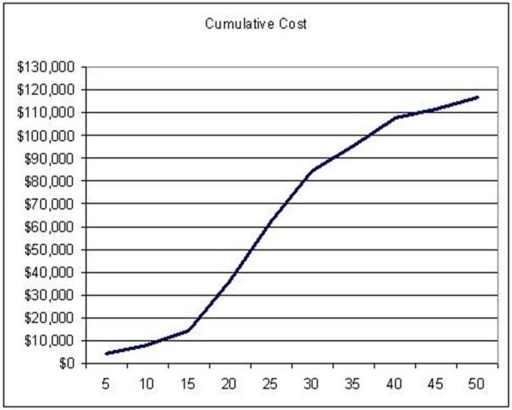
Use the S-curve to choose the BEST statement about the project it describes.The horizontal axis is in weeks.
A)More time passes from weeks 5 to 10 than from weeks 20 to 25.
B)More time passes from $50,000 to $60,000 than from $5,000 to $10,000.
C)More money is spent from weeks 0 to 10 than from weeks 30 to 40.
D)The total amount spent on the project at the end of the 40th week is approximately $110,000.
سؤال
سؤال
Use the S-curve to choose the BEST statement about the project it describes.The horizontal axis is in weeks.
A)The total project costs in week 10 are less than budgeted.
B)The total project costs in week 10 exceed the budgeted cost.
C)The project cost more from weeks 25 through 30 than it did in weeks 10 through 15.
D)The total amount spent on the project at the end of the 20th week is approximately $30,000.
سؤال
سؤال
سؤال
سؤال
سؤال
سؤال
سؤال
سؤال
سؤال
سؤال
سؤال
سؤال
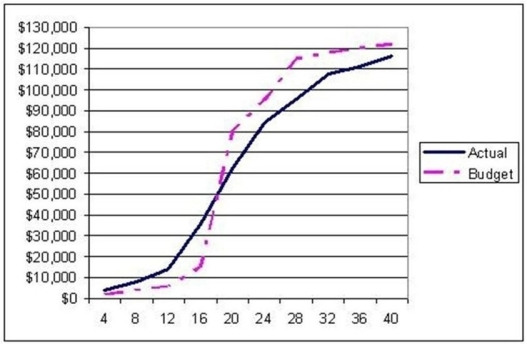
Use the S-curve where the solid line is actual cost and the dashed line is budgeted cost to choose the BEST statement.
A)The project is further ahead of budget from weeks 36 through 40 than from weeks 8 through 12.
B)The project never experiences negative variance.
C)The project is further behind budget from weeks 0 through 16 than from 24 through 40.
D)The project is in a constant state of positive variance.
سؤال
سؤال
سؤال
سؤال
سؤال
سؤال
سؤال
سؤال
سؤال
Use the S-curves for this project to create a table showing budgeted and actual expenses and variance in thousands of dollars and comment on the project's performance.The horizontal axis is in weeks.
سؤال
سؤال
سؤال
سؤال
سؤال
سؤال
سؤال
سؤال
سؤال
سؤال
سؤال
سؤال
سؤال
سؤال
سؤال
سؤال
سؤال
سؤال
سؤال
سؤال
سؤال
سؤال
سؤال
سؤال
سؤال
سؤال
سؤال
سؤال
سؤال
سؤال
سؤال
سؤال
سؤال
سؤال
سؤال
سؤال
سؤال
سؤال
سؤال
سؤال
سؤال
سؤال
سؤال
سؤال
سؤال
سؤال
سؤال
سؤال
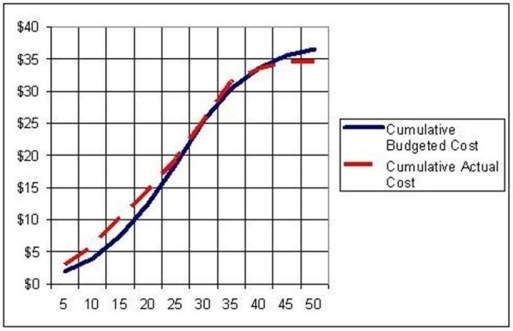
You are the new consultant to the project manager for a large product development project.During your first meeting with the project manager he brings you up to speed on the project status by showing you these S-curves.You glance at the graph,compose your thoughts,and make what comments on this project?
سؤال
سؤال
سؤال
سؤال
سؤال

فتح الحزمة
قم بالتسجيل لفتح البطاقات في هذه المجموعة!
Unlock Deck
Unlock Deck
1/107
العب
ملء الشاشة (f)
Deck 13: Project Evaluation and Control
1
Milestones are generally considered to be:
A)Demotivators for the project team.
B)Key project review gates.
C)The end of the project for all team members except the project manager.
D)Points where two or more activities merge.
A)Demotivators for the project team.
B)Key project review gates.
C)The end of the project for all team members except the project manager.
D)Points where two or more activities merge.
B
2
Use the S-curve where the solid line is actual cost and the dashed line is budgeted cost to choose the BEST statement.
A)The project never experiences negative variance.
B)With regards to budget,the project starts badly but finishes well
C)With regards to budget,the project starts well but finishes badly.
D)The project is in a constant state of positive variance.
B
3
What is a tracking Gantt chart and what are the benefits and drawbacks of its use?
A tracking Gantt chart is a Gantt chart with an indication of current project status for each activity.The bar representing each activity changes color to reflect the percentage completion status,ranging from 0% to 100%,of the activity.At any given point in time it is possible to see the progress that has been made on all activities and to determine whether a project is progressing on,ahead of,or behind schedule.
A benefit of tracking Gantt charts is that they are easy to understand.This type of chart can be updated quickly allowing for real-time control.While they show the status of activities,they do not convey why the activities are in their current state.Tracking Gantt charts also do not allow for future projections of the project's status or predictions regarding project completion time or adherence to budget.
A benefit of tracking Gantt charts is that they are easy to understand.This type of chart can be updated quickly allowing for real-time control.While they show the status of activities,they do not convey why the activities are in their current state.Tracking Gantt charts also do not allow for future projections of the project's status or predictions regarding project completion time or adherence to budget.
4
Use the S-curve to choose the BEST statement about the project it describes.The horizontal axis is in weeks.
A)More time passes from weeks 5 to 10 than from weeks 20 to 25.
B)More time passes from $50,000 to $60,000 than from $5,000 to $10,000.
C)More money is spent from weeks 0 to 10 than from weeks 30 to 40.
D)The total amount spent on the project at the end of the 40th week is approximately $110,000.
فتح الحزمة
افتح القفل للوصول البطاقات البالغ عددها 107 في هذه المجموعة.
فتح الحزمة
k this deck
5
A measurement process that determines the project goals and then the degree to which the actual performance lives up to these goals is:
A)A metric system.
B)Goal-performance linkage.
C)Five degrees of separation.
D)Gap analysis.
A)A metric system.
B)Goal-performance linkage.
C)Five degrees of separation.
D)Gap analysis.
فتح الحزمة
افتح القفل للوصول البطاقات البالغ عددها 107 في هذه المجموعة.
فتح الحزمة
k this deck
6
Use the S-curve to choose the BEST statement about the project it describes.The horizontal axis is in weeks.
A)The total project costs in week 10 are less than budgeted.
B)The total project costs in week 10 exceed the budgeted cost.
C)The project cost more from weeks 25 through 30 than it did in weeks 10 through 15.
D)The total amount spent on the project at the end of the 20th week is approximately $30,000.
فتح الحزمة
افتح القفل للوصول البطاقات البالغ عددها 107 في هذه المجموعة.
فتح الحزمة
k this deck
7
The first step in the control cycle is:
A)Setting a goal.
B)Measuring progress.
C)Comparing actual with planned performance.
D)Taking action.
A)Setting a goal.
B)Measuring progress.
C)Comparing actual with planned performance.
D)Taking action.
فتح الحزمة
افتح القفل للوصول البطاقات البالغ عددها 107 في هذه المجموعة.
فتح الحزمة
k this deck
8
An excellent way to coordinate schedules with vendors and suppliers is through the use of:
A)Milestones.
B)S-curves that plot expenditures against time.
C)S-curves that plot planned expenditures against time.
D)A tracking Gantt chart.
A)Milestones.
B)S-curves that plot expenditures against time.
C)S-curves that plot planned expenditures against time.
D)A tracking Gantt chart.
فتح الحزمة
افتح القفل للوصول البطاقات البالغ عددها 107 في هذه المجموعة.
فتح الحزمة
k this deck
9
Identify a different key success driver and inhibitor for the project stages of formation,build-up,main phase,and close-out.
فتح الحزمة
افتح القفل للوصول البطاقات البالغ عددها 107 في هذه المجموعة.
فتح الحزمة
k this deck
10
Measurement mechanisms should include a clear definition of:
A)The project baseline.
B)The reporting relationships among members of the project team.
C)What to measure.
D)Trigger points.
A)The project baseline.
B)The reporting relationships among members of the project team.
C)What to measure.
D)Trigger points.
فتح الحزمة
افتح القفل للوصول البطاقات البالغ عددها 107 في هذه المجموعة.
فتح الحزمة
k this deck
11
The classic project S-curve is a plot of:
A)Labor hours versus money expended.
B)Money expended versus elapsed time.
C)Elapsed time versus labor hours.
D)Number of personnel versus days behind schedule.
A)Labor hours versus money expended.
B)Money expended versus elapsed time.
C)Elapsed time versus labor hours.
D)Number of personnel versus days behind schedule.
فتح الحزمة
افتح القفل للوصول البطاقات البالغ عددها 107 في هذه المجموعة.
فتح الحزمة
k this deck
12
A project manager that uses milestones as a project control device is using a:
A)Proactive control system.
B)Predictive control system.
C)Feedback control system.
D)Reactive control system.
A)Proactive control system.
B)Predictive control system.
C)Feedback control system.
D)Reactive control system.
فتح الحزمة
افتح القفل للوصول البطاقات البالغ عددها 107 في هذه المجموعة.
فتح الحزمة
k this deck
13
A tracking Gantt chart:
A)Monitors costs and budget expenditures.
B)Identifies key points in the project's progress.
C)Identifies the stage of completion for each task.
D)Identifies the performance to budget for the overall project by a certain date.
A)Monitors costs and budget expenditures.
B)Identifies key points in the project's progress.
C)Identifies the stage of completion for each task.
D)Identifies the performance to budget for the overall project by a certain date.
فتح الحزمة
افتح القفل للوصول البطاقات البالغ عددها 107 في هذه المجموعة.
فتح الحزمة
k this deck
14
Define human factors and discuss their impact on project success?
فتح الحزمة
افتح القفل للوصول البطاقات البالغ عددها 107 في هذه المجموعة.
فتح الحزمة
k this deck
15
The project control cycle is continuous.
فتح الحزمة
افتح القفل للوصول البطاقات البالغ عددها 107 في هذه المجموعة.
فتح الحزمة
k this deck
16
If significant deviations from the project plan are detected,corrective action is taken and then:
A)The monitoring and control cycle begins anew.
B)Project goals are adjusted to reflect current reality.
C)The project stakeholders are informed of the budget or time difficulties.
D)The critical chain is reviewed for task dependency.
A)The monitoring and control cycle begins anew.
B)Project goals are adjusted to reflect current reality.
C)The project stakeholders are informed of the budget or time difficulties.
D)The critical chain is reviewed for task dependency.
فتح الحزمة
افتح القفل للوصول البطاقات البالغ عددها 107 في هذه المجموعة.
فتح الحزمة
k this deck
17
Sketch the project control cycle and discuss the activities that take place in each step.
فتح الحزمة
افتح القفل للوصول البطاقات البالغ عددها 107 في هذه المجموعة.
فتح الحزمة
k this deck
18
Use the S-curve where the solid line is actual cost and the dashed line is budgeted cost to choose the BEST statement.
A)The project is further ahead of budget from weeks 36 through 40 than from weeks 8 through 12.
B)The project never experiences negative variance.
C)The project is further behind budget from weeks 0 through 16 than from 24 through 40.
D)The project is in a constant state of positive variance.
فتح الحزمة
افتح القفل للوصول البطاقات البالغ عددها 107 في هذه المجموعة.
فتح الحزمة
k this deck
19
Gap analysis refers to any measurement process that first determines the goals and then the degree to which the actual performance lives up to those goals.
فتح الحزمة
افتح القفل للوصول البطاقات البالغ عددها 107 في هذه المجموعة.
فتح الحزمة
k this deck
20
Project goal setting includes setting a baseline plan,which is predicated on:
A)The progress measurement.
B)An accurate work breakdown structure.
C)The type of gap analysis the project team plans to use.
D)The budget and schedule limitations.
A)The progress measurement.
B)An accurate work breakdown structure.
C)The type of gap analysis the project team plans to use.
D)The budget and schedule limitations.
فتح الحزمة
افتح القفل للوصول البطاقات البالغ عددها 107 في هذه المجموعة.
فتح الحزمة
k this deck
21
Earned value management jointly considers the impact of:
A)Planned time and planned cost.
B)Project performance and actual cost.
C)Project performance,cost,and time.
D)Planned cost,planned performance,and time.
A)Planned time and planned cost.
B)Project performance and actual cost.
C)Project performance,cost,and time.
D)Planned cost,planned performance,and time.
فتح الحزمة
افتح القفل للوصول البطاقات البالغ عددها 107 في هذه المجموعة.
فتح الحزمة
k this deck
22
Since a project may get ahead of or fall behind schedule,a calendar date cannot be a milestone.
فتح الحزمة
افتح القفل للوصول البطاقات البالغ عددها 107 في هذه المجموعة.
فتح الحزمة
k this deck
23
How does a tracking Gantt chart's appearance differ from a standard Gantt chart?
A)The tracking Gantt chart has a plot against time on the X1 axis and shows progress against budget on the X2 axis.
B)The tracking Gantt chart is composed of dollar signs that show the relative expense of the activity in comparison with other activities.
C)Each bar in the tracking Gantt chart shows who is responsible for completion of the activity in question.
D)Each bar in the tracking Gantt chart varies from 100% solid if the activity is completed to 100% alternative pattern if the activity has not begun.
فتح الحزمة
افتح القفل للوصول البطاقات البالغ عددها 107 في هذه المجموعة.
فتح الحزمة
k this deck
24
What are any four benefits to using milestones as a form of project control? What advantage do they hold over pure S-curve analysis?
فتح الحزمة
افتح القفل للوصول البطاقات البالغ عددها 107 في هذه المجموعة.
فتح الحزمة
k this deck
25
The earned value to date divided by the planned value of work scheduled to be performed is the:
A)Cost performance index.
B)Budgeted cost at completion index.
C)Budget efficiency index.
D)Schedule performance index.
A)Cost performance index.
B)Budgeted cost at completion index.
C)Budget efficiency index.
D)Schedule performance index.
فتح الحزمة
افتح القفل للوصول البطاقات البالغ عددها 107 في هذه المجموعة.
فتح الحزمة
k this deck
26
What are the problems with milestones as a project control mechanism?
فتح الحزمة
افتح القفل للوصول البطاقات البالغ عددها 107 في هذه المجموعة.
فتح الحزمة
k this deck
27
Use the S-curves for this project to create a table showing budgeted and actual expenses and variance in thousands of dollars and comment on the project's performance.The horizontal axis is in weeks.
فتح الحزمة
افتح القفل للوصول البطاقات البالغ عددها 107 في هذه المجموعة.
فتح الحزمة
k this deck
28
Earned value is:
A)The total budget for the project.
B)A cost estimate of the budgeted resources across the project's life cycle.
C)The real budgeted value of the work that has actually been performed to date.
D)The cumulative total costs incurred in accomplishing the various project work packages.
A)The total budget for the project.
B)A cost estimate of the budgeted resources across the project's life cycle.
C)The real budgeted value of the work that has actually been performed to date.
D)The cumulative total costs incurred in accomplishing the various project work packages.
فتح الحزمة
افتح القفل للوصول البطاقات البالغ عددها 107 في هذه المجموعة.
فتح الحزمة
k this deck
29
It is possible to measure:
A)Only positive deviations from the schedule baseline with a tracking Gantt chart.
B)Only negative deviations from the schedule baseline with a tracking Gantt chart.
C)Both positive and negative deviations from the schedule baseline with the tracking Gantt chart.
D)Both positive and negative deviations from the budget with the tracking Gantt chart.
فتح الحزمة
افتح القفل للوصول البطاقات البالغ عددها 107 في هذه المجموعة.
فتح الحزمة
k this deck
30
The earned value divided by the actual,cumulative cost of the work to date is the:
A)Cost performance index.
B)Budgeted cost at completion index.
C)Budget efficiency index.
D)Schedule performance index.
A)Cost performance index.
B)Budgeted cost at completion index.
C)Budget efficiency index.
D)Schedule performance index.
فتح الحزمة
افتح القفل للوصول البطاقات البالغ عددها 107 في هذه المجموعة.
فتح الحزمة
k this deck
31
Positive variance on an S-curve is not always a sign of significant project progress.
فتح الحزمة
افتح القفل للوصول البطاقات البالغ عددها 107 في هذه المجموعة.
فتح الحزمة
k this deck
32
Take the factors considered by earned value analysis and subtract those considered by tracking Gantt charts.The factor(s)you have remaining are:
A)Cost.
B)Cost and schedule.
C)Schedule and performance.
D)Performance.
A)Cost.
B)Cost and schedule.
C)Schedule and performance.
D)Performance.
فتح الحزمة
افتح القفل للوصول البطاقات البالغ عددها 107 في هذه المجموعة.
فتح الحزمة
k this deck
33
It is possible to measure both positive and negative deviations from the schedule baseline with the tracking Gantt chart.
فتح الحزمة
افتح القفل للوصول البطاقات البالغ عددها 107 في هذه المجموعة.
فتح الحزمة
k this deck
34
Take the factors considered by earned value analysis and subtract those considered by project S-curves.The factor(s)you have remaining are:
A)Performance and cost.
B)Cost and schedule.
C)Time.
D)Performance.
A)Performance and cost.
B)Cost and schedule.
C)Time.
D)Performance.
فتح الحزمة
افتح القفل للوصول البطاقات البالغ عددها 107 في هذه المجموعة.
فتح الحزمة
k this deck
35
What are drawbacks to a pure S-curve analysis?
فتح الحزمة
افتح القفل للوصول البطاقات البالغ عددها 107 في هذه المجموعة.
فتح الحزمة
k this deck
36
One strength of S-curve analysis is that it provides real-time tracking information.
فتح الحزمة
افتح القفل للوصول البطاقات البالغ عددها 107 في هذه المجموعة.
فتح الحزمة
k this deck
37
Earned value management is also known as:
A)The golden triangle method (GTM).
B)The achieved value method (AVM).
C)The program evaluation and review method (PERM).
D)Earned value analysis (EVA).
A)The golden triangle method (GTM).
B)The achieved value method (AVM).
C)The program evaluation and review method (PERM).
D)Earned value analysis (EVA).
فتح الحزمة
افتح القفل للوصول البطاقات البالغ عددها 107 في هذه المجموعة.
فتح الحزمة
k this deck
38
Planned value is:
A)The total budget for the project.
B)A cost estimate of the budgeted resources across the project's life cycle.
C)The real budgeted value of the work that has actually been performed to date.
D)The cumulative total costs incurred in accomplishing the various project work packages.
A)The total budget for the project.
B)A cost estimate of the budgeted resources across the project's life cycle.
C)The real budgeted value of the work that has actually been performed to date.
D)The cumulative total costs incurred in accomplishing the various project work packages.
فتح الحزمة
افتح القفل للوصول البطاقات البالغ عددها 107 في هذه المجموعة.
فتح الحزمة
k this deck
39
The classic S-curve is a plot of cumulative cost versus elapsed time in weeks.
فتح الحزمة
افتح القفل للوصول البطاقات البالغ عددها 107 في هذه المجموعة.
فتح الحزمة
k this deck
40
Which of these tools allows a project team to make future projections of project status based on its current state?
A)Tracking Gantt chart
B)Milestone chart
C)S-curve
D)Budgeting
A)Tracking Gantt chart
B)Milestone chart
C)S-curve
D)Budgeting
فتح الحزمة
افتح القفل للوصول البطاقات البالغ عددها 107 في هذه المجموعة.
فتح الحزمة
k this deck
41
Use the earned value table to determine the schedule performance index given the indicated state of the project.
A)0.89
B)0.92
C)1.09
D)1.13
A)0.89
B)0.92
C)1.09
D)1.13
فتح الحزمة
افتح القفل للوصول البطاقات البالغ عددها 107 في هذه المجموعة.
فتح الحزمة
k this deck
42
Duration (weeks)
-At the end of week 25,this project has cost $79,000 and has an earned value as indicated in the table.Use the data to calculate the cost performance index for the project.All amounts are in thousands of dollars.
A)1.11
B)0.82
C)0.94
D)0.90
-At the end of week 25,this project has cost $79,000 and has an earned value as indicated in the table.Use the data to calculate the cost performance index for the project.All amounts are in thousands of dollars.
A)1.11
B)0.82
C)0.94
D)0.90
فتح الحزمة
افتح القفل للوصول البطاقات البالغ عددها 107 في هذه المجموعة.
فتح الحزمة
k this deck
43
At the end of week 10,this project has cost $9,000 and has an earned value as indicated in the table.Use the data to calculate the cost performance index for the project.All amounts are in thousands of dollars. Duration (weeks)
A)2.5
B)2.1
C)1.8
D)1.5
A)2.5
B)2.1
C)1.8
D)1.5
فتح الحزمة
افتح القفل للوصول البطاقات البالغ عددها 107 في هذه المجموعة.
فتح الحزمة
k this deck
44
The first step in earned value management is to:
A)Create the activity and resource usage schedules.
B)Develop a time-phased budget that shows expenditures across the project's life.
C)Total the actual costs of doing each task to arrive at the actual cost of work performed.
D)Clearly define each activity that will be performed including its resource needs and budget.
فتح الحزمة
افتح القفل للوصول البطاقات البالغ عددها 107 في هذه المجموعة.
فتح الحزمة
k this deck
45
The budget variance is calculated as:
A)Earned value minus planned value.
B)Planned value minus actual cost.
C)Earned value minus actual cost.
D)Cost minus planned value.
A)Earned value minus planned value.
B)Planned value minus actual cost.
C)Earned value minus actual cost.
D)Cost minus planned value.
فتح الحزمة
افتح القفل للوصول البطاقات البالغ عددها 107 في هذه المجموعة.
فتح الحزمة
k this deck
46
In earned value management,schedule variance is defined as:
A)The difference between the earned value and the actual cost.
B)The difference between the earned value and the planned value.
C)The difference between the actual cost and the planned value.
D)The difference between the cost and schedule performance indices multiplied by the budgeted cost at completion.
فتح الحزمة
افتح القفل للوصول البطاقات البالغ عددها 107 في هذه المجموعة.
فتح الحزمة
k this deck
47
Use the data to calculate the schedule performance index for the project for the end of week 10.The earned value as of the end of week 10 is indicated in the table.All amounts are in thousands of dollars. Duration (weeks)
A)1.24
B)0.93
C)0.81
D)0.76
A)1.24
B)0.93
C)0.81
D)0.76
فتح الحزمة
افتح القفل للوصول البطاقات البالغ عددها 107 في هذه المجموعة.
فتح الحزمة
k this deck
48
Use the data to calculate the earned value for the project.All amounts are in thousands of dollars. Duration (weeks)
A)$38,500
B)$46,550
C)$56,750
D)$61,125
A)$38,500
B)$46,550
C)$56,750
D)$61,125
فتح الحزمة
افتح القفل للوصول البطاقات البالغ عددها 107 في هذه المجموعة.
فتح الحزمة
k this deck
49
In earned value management analysis,the cumulative amount of the budget becomes the:
A)Planned value.
B)Scheduled value.
C)Cost basis.
D)Cost driver.
A)Planned value.
B)Scheduled value.
C)Cost basis.
D)Cost driver.
فتح الحزمة
افتح القفل للوصول البطاقات البالغ عددها 107 في هذه المجموعة.
فتح الحزمة
k this deck
50
The project baseline is established by combining data from the:
A)Work breakdown structure and the project budget.
B)Time-phased project budget and the PERT chart.
C)S-curve and the project budget.
D)Time-phased project budget and the work breakdown structure.
A)Work breakdown structure and the project budget.
B)Time-phased project budget and the PERT chart.
C)S-curve and the project budget.
D)Time-phased project budget and the work breakdown structure.
فتح الحزمة
افتح القفل للوصول البطاقات البالغ عددها 107 في هذه المجموعة.
فتح الحزمة
k this deck
51
Use the data to calculate the schedule performance index for the project for the end of week 20.The earned value as of the end of week 20 is indicated in the table.All amounts are in thousands of dollars. Duration (weeks)
A)1.14
B)0.88
C)0.94
D)0.81
A)1.14
B)0.88
C)0.94
D)0.81
فتح الحزمة
افتح القفل للوصول البطاقات البالغ عددها 107 في هذه المجموعة.
فتح الحزمة
k this deck
52
Use the earned value table to determine the estimated time to completion given the indicated state of the project.
A)35 days
B)37 days
C)39 weeks
D)41 weeks
A)35 days
B)37 days
C)39 weeks
D)41 weeks
فتح الحزمة
افتح القفل للوصول البطاقات البالغ عددها 107 في هذه المجموعة.
فتح الحزمة
k this deck
53
Use the earned value table for Project Makeready to determine the earned value at week 49.
A)$4,950
B)$6,050
C)$4,155
D)$5,250
A)$4,950
B)$6,050
C)$4,155
D)$5,250
فتح الحزمة
افتح القفل للوصول البطاقات البالغ عددها 107 في هذه المجموعة.
فتح الحزمة
k this deck
54
A project manager can calculate the projected budget to completion by using the:
A)Budgeted cost at completion index.
B)Budget efficiency index.
C)Cost performance index.
D)Schedule performance index.
A)Budgeted cost at completion index.
B)Budget efficiency index.
C)Cost performance index.
D)Schedule performance index.
فتح الحزمة
افتح القفل للوصول البطاقات البالغ عددها 107 في هذه المجموعة.
فتح الحزمة
k this deck
55
Use the earned value table (all amounts indicated are dollars)to determine the earned value to the nearest hundred dollars given the indicated state of the project.
A)$16,900
B)$14,900
C)$14,400
D)$13,200
A)$16,900
B)$14,900
C)$14,400
D)$13,200
فتح الحزمة
افتح القفل للوصول البطاقات البالغ عددها 107 في هذه المجموعة.
فتح الحزمة
k this deck
56
Use the data to calculate the earned value for the project.All amounts are in thousands of dollars. Duration (weeks)
A)$38,850
B)$43,250
C)$54,750
D)$100,000
A)$38,850
B)$43,250
C)$54,750
D)$100,000
فتح الحزمة
افتح القفل للوصول البطاقات البالغ عددها 107 في هذه المجموعة.
فتح الحزمة
k this deck
57
Use the earned value table to determine the estimated cost to completion given the indicated state of the project.
A)$15,966
B)$16,173
C)$18,164
D)$17,441
A)$15,966
B)$16,173
C)$18,164
D)$17,441
فتح الحزمة
افتح القفل للوصول البطاقات البالغ عددها 107 في هذه المجموعة.
فتح الحزمة
k this deck
58
Duration (weeks)
-Use the data to calculate the earned value for the project.All amounts are in thousands of dollars.
A)$65,500
B)$69,550
C)$71,100
D)$76,125
-Use the data to calculate the earned value for the project.All amounts are in thousands of dollars.
A)$65,500
B)$69,550
C)$71,100
D)$76,125
فتح الحزمة
افتح القفل للوصول البطاقات البالغ عددها 107 في هذه المجموعة.
فتح الحزمة
k this deck
59
Use the earned value table to determine the cost performance index given the indicated state of the project.
A)0.89
B)0.92
C)1.09
D)1.13
A)0.89
B)0.92
C)1.09
D)1.13
فتح الحزمة
افتح القفل للوصول البطاقات البالغ عددها 107 في هذه المجموعة.
فتح الحزمة
k this deck
60
A project manager can calculate the projected schedule of the project to completion by using the:
A)Cost performance index.
B)Schedule performance index.
C)Budgeted cost at completion index.
D)Budget efficiency index.
A)Cost performance index.
B)Schedule performance index.
C)Budgeted cost at completion index.
D)Budget efficiency index.
فتح الحزمة
افتح القفل للوصول البطاقات البالغ عددها 107 في هذه المجموعة.
فتح الحزمة
k this deck
61
The earned value of a project is the cumulative total costs incurred in accomplishing the various work packages.
فتح الحزمة
افتح القفل للوصول البطاقات البالغ عددها 107 في هذه المجموعة.
فتح الحزمة
k this deck
62
Geoff coolly surveyed his earned value table at the conclusion of month 24.It was hard to believe that two short years ago,with his membership at Match.com about to expire,he had managed to craft an ad that was both urbane and manly enough as to catch the eye of the divine Miss Smylie.(The male model photo he substituted for his own certainly didn't hurt either. )Now he was almost done managing this critical project.Some might think him crass for taking such an approach,but he practiced what he preached at the small commuter school where he taught.Calculate all of the schedule and cost variances (costs in the table are in dollars)for this project and comment on Geoff's skills as a project manager.
فتح الحزمة
افتح القفل للوصول البطاقات البالغ عددها 107 في هذه المجموعة.
فتح الحزمة
k this deck
63
The one factor that earned value management considers that an S-curve does not include is performance.
فتح الحزمة
افتح القفل للوصول البطاقات البالغ عددها 107 في هذه المجموعة.
فتح الحزمة
k this deck
64
Your organization is in the midst of a project in uncharted waters;nothing you have attempted before comes close to many of the activities that are necessary to bring this project to completion.Your earned value management should probably be tracked closely with a percentage complete rule in increments of 5 to 10 percent.
فتح الحزمة
افتح القفل للوصول البطاقات البالغ عددها 107 في هذه المجموعة.
فتح الحزمة
k this deck
65
Five weeks in the semester you have completed 0% of your project management class under the 0/100 rule.
فتح الحزمة
افتح القفل للوصول البطاقات البالغ عددها 107 في هذه المجموعة.
فتح الحزمة
k this deck
66
Each activity contained a series of milestones that represented a previously agreed-upon amount of work.Once the low graffiti was erased,35% of the activity had been completed and once the mid-level graffiti was erased,70% of the activity had been completed.This project manager was clearly in the:
A)Percentage complete camp.
B)Micromanagement camp.
C)35/70 camp.
D)3K specifications camp.
A)Percentage complete camp.
B)Micromanagement camp.
C)35/70 camp.
D)3K specifications camp.
فتح الحزمة
افتح القفل للوصول البطاقات البالغ عددها 107 في هذه المجموعة.
فتح الحزمة
k this deck
67
What is the cost variance of Project Makeready based on the data in the earned value table shown below?
A)-$1,896
B)-$1,096
C)-$800
D)-$406
A)-$1,896
B)-$1,096
C)-$800
D)-$406
فتح الحزمة
افتح القفل للوصول البطاقات البالغ عددها 107 في هذه المجموعة.
فتح الحزمة
k this deck
68
Use the earned value table for Project Makeready to calculate the estimated cost to completion.
A)$4,285
B)$5,250
C)$6,050
D)$7,645
A)$4,285
B)$5,250
C)$6,050
D)$7,645
فتح الحزمة
افتح القفل للوصول البطاقات البالغ عددها 107 في هذه المجموعة.
فتح الحزمة
k this deck
69
Use the earned value table for Project Makeready to determine the schedule variance.
A)-$1,896
B)-$1,096
C)-$800
D)-$206
A)-$1,896
B)-$1,096
C)-$800
D)-$206
فتح الحزمة
افتح القفل للوصول البطاقات البالغ عددها 107 في هذه المجموعة.
فتح الحزمة
k this deck
70
Once an activity is begun,it is assumed to be half done under the:
A)"Once begun,half done" rule.
B)Minimal effort rule.
C)Midway rule.
D)50/50 rule.
A)"Once begun,half done" rule.
B)Minimal effort rule.
C)Midway rule.
D)50/50 rule.
فتح الحزمة
افتح القفل للوصول البطاقات البالغ عددها 107 في هذه المجموعة.
فتح الحزمة
k this deck
71
Earned value directly links all three primary project success metrics (cost,schedule,and customer satisfaction).
فتح الحزمة
افتح القفل للوصول البطاقات البالغ عددها 107 في هذه المجموعة.
فتح الحزمة
k this deck
72
Very short work packages would be better managed by:
A)The percentage complete rule.
B)The 0/100 rule.
C)The caveat emptor rule.
D)The prior knowledge rule.
A)The percentage complete rule.
B)The 0/100 rule.
C)The caveat emptor rule.
D)The prior knowledge rule.
فتح الحزمة
افتح القفل للوصول البطاقات البالغ عددها 107 في هذه المجموعة.
فتح الحزمة
k this deck
73
What is earned value management and how can it be used to monitor project status?
فتح الحزمة
افتح القفل للوصول البطاقات البالغ عددها 107 في هذه المجموعة.
فتح الحزمة
k this deck
74
Inspired by his trip to Greece,the gentleman farmer decided he needed a Mykonos-style windmill pumping a pond for his sheep and orchard.His earned value table for the project appears below.Develop a plot that shows the project baseline and earned value through June and comment on the project.
فتح الحزمة
افتح القفل للوصول البطاقات البالغ عددها 107 في هذه المجموعة.
فتح الحزمة
k this deck
75
You are the new consultant to the project manager for a large product development project.During your first meeting with the project manager he brings you up to speed on the project status by showing you these S-curves.You glance at the graph,compose your thoughts,and make what comments on this project?
فتح الحزمة
افتح القفل للوصول البطاقات البالغ عددها 107 في هذه المجموعة.
فتح الحزمة
k this deck
76
A project manager needs the work breakdown structure and a time-phased project budget to establish the project baseline.
فتح الحزمة
افتح القفل للوصول البطاقات البالغ عددها 107 في هذه المجموعة.
فتح الحزمة
k this deck
77
Use the earned value table for Project Makeready to calculate their schedule performance index.
A)1.46
B)0.68
C)0.79
D)1.26
A)1.46
B)0.68
C)0.79
D)1.26
فتح الحزمة
افتح القفل للوصول البطاقات البالغ عددها 107 في هذه المجموعة.
فتح الحزمة
k this deck
78
If an activity's progress is defined as 0% until the activity is complete,the project manager is using:
A)The 50/50 rule.
B)The all or nothing rule.
C)The 0/100 rule.
D)The Do Not Pass Go rule.
A)The 50/50 rule.
B)The all or nothing rule.
C)The 0/100 rule.
D)The Do Not Pass Go rule.
فتح الحزمة
افتح القفل للوصول البطاقات البالغ عددها 107 في هذه المجموعة.
فتح الحزمة
k this deck
79
What are the inputs and the steps in applying earned value management as a project management tool?
فتح الحزمة
افتح القفل للوصول البطاقات البالغ عددها 107 في هذه المجموعة.
فتح الحزمة
k this deck
80
Inspired by his trip to Greece,the gentleman farmer decided he needed a Mykonos-style windmill pumping a pond for his sheep and orchard.His earned value table for the project appears below.At the end of June,what was the estimated time to completion and the estimated cumulative cost to completion?
فتح الحزمة
افتح القفل للوصول البطاقات البالغ عددها 107 في هذه المجموعة.
فتح الحزمة
k this deck
فتح الحزمة
افتح القفل للوصول البطاقات البالغ عددها 107 في هذه المجموعة.


