Deck 11: Analysis of Quantitative Data
ملء الشاشة (f)
سؤال
سؤال
سؤال
سؤال
سؤال
سؤال
سؤال
سؤال
Refer to the information in the following table when answering questions 18 to 26:

Which neighbourhood(s)has an income distribution resembling a normal curve?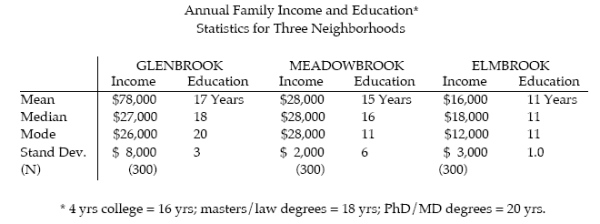
A) Glenbrook
B) Meadowbrook
C) Elmbrook
D) Glenbrook and Elmbrook
E) Meadowbrook and Elmbrook
Which neighbourhood(s)has an income distribution resembling a normal curve?
A) Glenbrook
B) Meadowbrook
C) Elmbrook
D) Glenbrook and Elmbrook
E) Meadowbrook and Elmbrook
سؤال
سؤال
سؤال
سؤال
An elementary school teacher has three classes.She finds the following mean and standard deviations for student IQ scores. 
She knows she is most effective when the students all have similar IQ levels.Which class is she likely to be most effective with?
A) Class #1
B) Class #2
C) Class #3
D) Classes #1 and #2 equally
E) Classes #1 and #3 equally
She knows she is most effective when the students all have similar IQ levels.Which class is she likely to be most effective with?
A) Class #1
B) Class #2
C) Class #3
D) Classes #1 and #2 equally
E) Classes #1 and #3 equally
سؤال
سؤال
سؤال
Refer to the information in the following table when answering questions 18 to 26:
Which neighbourhood(s)has an income distribution resembling a skewed curve?
A) Glenbrook
B) Meadowbrook
C) Elmbrook
D) Glenbrook and Elmbrook
E) Meadowbrook and Elmbrook
Which neighbourhood(s)has an income distribution resembling a skewed curve?
A) Glenbrook
B) Meadowbrook
C) Elmbrook
D) Glenbrook and Elmbrook
E) Meadowbrook and Elmbrook
سؤال
سؤال
Refer to the information in the following table when answering questions 18 to 26:
Which neighbourhood(s)has the greatest differences in family income?
A) Glenbrook
B) Meadowbrook
C) Elmbrook
D) Glenbrook and Elmbrook
E) Meadowbrook and Elmbrook
Which neighbourhood(s)has the greatest differences in family income?
A) Glenbrook
B) Meadowbrook
C) Elmbrook
D) Glenbrook and Elmbrook
E) Meadowbrook and Elmbrook
سؤال
سؤال
سؤال
سؤال
Among the violent offenders in the following table,what is the ratio of males to females? 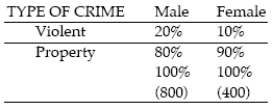
A) 1 male to 1 female, or 1:1
B) 2 males to 3 females, or 2:3
C) 4 males to 1 female, or 4:1
D) 2 males to 1 female, or 2:1
A) 1 male to 1 female, or 1:1
B) 2 males to 3 females, or 2:3
C) 4 males to 1 female, or 4:1
D) 2 males to 1 female, or 2:1
سؤال
Refer to the information in the following table when answering questions 18 to 26:
Which neighbourhood(s)has the highest number of families with the lowest incomes?
A) Glenbrook
B) Meadowbrook
C) Elmbrook
D) Glenbrook and Elmbrook
E) Meadowbrook and Elmbrook
Which neighbourhood(s)has the highest number of families with the lowest incomes?
A) Glenbrook
B) Meadowbrook
C) Elmbrook
D) Glenbrook and Elmbrook
E) Meadowbrook and Elmbrook
سؤال
سؤال
Refer to the information in the following table when answering questions 18 to 26:
Which neighbourhood(s)has the 50th percentile of education as a college education?
A) Glenbrook
B) Meadowbrook
C) Elmbrook
D) Glenbrook and Elmbrook
E) Meadowbrook and Elmbrook
Which neighbourhood(s)has the 50th percentile of education as a college education?
A) Glenbrook
B) Meadowbrook
C) Elmbrook
D) Glenbrook and Elmbrook
E) Meadowbrook and Elmbrook
سؤال
سؤال
سؤال
سؤال

Which neighbourhood(s)has the greatest variation in years of education?
A) Glenbrook
B) Meadowbrook
C) Elmbrook
D) Glenbrook and Elmbrook
E) Meadowbrook and Elmbrook
سؤال
Refer to the information in the following table when answering questions 18 to 26:
In which neighbourhood(s)do half the families have incomes of $28,000 or more?
A) Glenbrook
B) Meadowbrook
C) Elmbrook
D) Glenbrook and Elmbrook
E) Meadowbrook and Elmbrook
In which neighbourhood(s)do half the families have incomes of $28,000 or more?
A) Glenbrook
B) Meadowbrook
C) Elmbrook
D) Glenbrook and Elmbrook
E) Meadowbrook and Elmbrook
سؤال
سؤال
سؤال

Which neighbourhood(s)has a small number of very high income people and a greater proportion of families earning $26,000?
A) Glenbrook
B) Meadowbrook
C) Elmbrook
D) Glenbrook and Elmbrook
E) Meadowbrook and Elmbrook
سؤال
Refer to the information in the following table when answering questions 18 to 26:
Which neighbourhood(s)has the smallest differences in family income?
A) Glenbrook
B) Meadowbrook
C) Elmbrook
D) Glenbrook and Elmbrook
E) Meadowbrook and Elmbrook
Which neighbourhood(s)has the smallest differences in family income?
A) Glenbrook
B) Meadowbrook
C) Elmbrook
D) Glenbrook and Elmbrook
E) Meadowbrook and Elmbrook
سؤال
سؤال
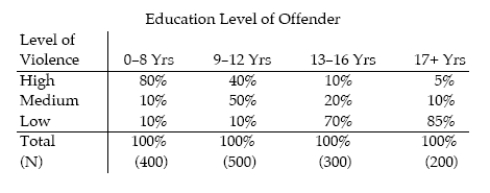
How many individuals with 17+ years of education engaged in a level of violence defined as medium?
A) 20
B) 180
C) 160
D) 55
E) 5
سؤال
سؤال
سؤال
سؤال
Refer to the information in the following table when answering questions 32 and 33:

What type of relationship exists between level of violence and level of education?
A) There is no relationship.
B) There is a negative relationship.
C) There is a positive relationship.
D) There is a nonlinear relationship.
E) There is a recursive relationship.
What type of relationship exists between level of violence and level of education?
A) There is no relationship.
B) There is a negative relationship.
C) There is a positive relationship.
D) There is a nonlinear relationship.
E) There is a recursive relationship.
سؤال
سؤال
سؤال
سؤال
سؤال
سؤال
سؤال
سؤال
سؤال
سؤال
سؤال
سؤال
سؤال
سؤال
سؤال
سؤال
سؤال
سؤال
سؤال
سؤال
سؤال
سؤال
سؤال
سؤال
سؤال
سؤال
سؤال
سؤال
سؤال
سؤال
سؤال
سؤال
سؤال
سؤال
سؤال
سؤال
سؤال
سؤال
سؤال
سؤال
سؤال

فتح الحزمة
قم بالتسجيل لفتح البطاقات في هذه المجموعة!
Unlock Deck
Unlock Deck
1/86
العب
ملء الشاشة (f)
Deck 11: Analysis of Quantitative Data
1
What are two ways in which statistical relationships can be described? Provide an example for each one.
-Correlation: To be correlated means to vary together whereby cases with certain values on one variable are likely to have certain values on the other one (e.g.,people with higher values on the income variable are likely to have higher values on the life expectancy variable).
-Independence: There is no association (i.e.,no relationship)between variables (e.g.,there is likely no relationship between the two variables "number of siblings one has" and "life expectancy").
-Independence: There is no association (i.e.,no relationship)between variables (e.g.,there is likely no relationship between the two variables "number of siblings one has" and "life expectancy").
2
You discover that the years of marriage before a divorce for nine whites and nine nonwhites are as follows: Whites 12,1,8,9,10,17,3,6,6
Non-Whites 1,9,15,18,11,13,14,7,3
Which statement about this data is true?
A) There is no difference in the range for the two groups.
B) The median years of marriage prior to divorce is three years longer for whites than nonwhites.
C) The mean years of marriage prior to divorce are the same for both groups.
D) On average, nonwhites stay married longer prior to divorce than whites.
E) The mode for the two groups is the same.
D
3
Calculate the mean for the following six shoe sizes: 9,10,10,8,12,11.
A) 8
B) 8.5
C) 9
D) 9.5
E) 10
A) 8
B) 8.5
C) 9
D) 9.5
E) 10
E
4
Is a Type I or Type II error more likely if a 0.05 level is used? Explain.
فتح الحزمة
افتح القفل للوصول البطاقات البالغ عددها 86 في هذه المجموعة.
فتح الحزمة
k this deck
5
Describe three ways a researcher can display information about univariate statistics.
فتح الحزمة
افتح القفل للوصول البطاقات البالغ عددها 86 في هذه المجموعة.
فتح الحزمة
k this deck
6
A researcher wants to express the middle of a distribution of numbers whereby half the cases are higher and half the cases are lower than the middle value.What statistical measure should the researcher use?
A) Mean
B) Median
C) Mode
D) Standard deviation
E) Correlation
A) Mean
B) Median
C) Mode
D) Standard deviation
E) Correlation
فتح الحزمة
افتح القفل للوصول البطاقات البالغ عددها 86 في هذه المجموعة.
فتح الحزمة
k this deck
7
Describe each of the three measures of central tendency.What are the main differences between them? How are they affected by a normal versus a skewed distribution of data?
فتح الحزمة
افتح القفل للوصول البطاقات البالغ عددها 86 في هذه المجموعة.
فتح الحزمة
k this deck
8
Refer to the information in the following table when answering questions 18 to 26:
Which neighbourhood(s)has an income distribution resembling a normal curve?
A) Glenbrook
B) Meadowbrook
C) Elmbrook
D) Glenbrook and Elmbrook
E) Meadowbrook and Elmbrook
Which neighbourhood(s)has an income distribution resembling a normal curve?
A) Glenbrook
B) Meadowbrook
C) Elmbrook
D) Glenbrook and Elmbrook
E) Meadowbrook and Elmbrook
فتح الحزمة
افتح القفل للوصول البطاقات البالغ عددها 86 في هذه المجموعة.
فتح الحزمة
k this deck
9
Why is knowing the variability or dispersion of a variable as important as knowing its central tendency? How is variation measured?
فتح الحزمة
افتح القفل للوصول البطاقات البالغ عددها 86 في هذه المجموعة.
فتح الحزمة
k this deck
10
Calculate the mode for the following six shoe sizes: 9,10,10,8,12,11.
A) 8
B) 8.5
C) 9
D) 9.5
E) 10
A) 8
B) 8.5
C) 9
D) 9.5
E) 10
فتح الحزمة
افتح القفل للوصول البطاقات البالغ عددها 86 في هذه المجموعة.
فتح الحزمة
k this deck
11
What are five measures of association that are useful when interpreting bivariate statistics? Describe each one and also specify which level of data each one is applicable to.
فتح الحزمة
افتح القفل للوصول البطاقات البالغ عددها 86 في هذه المجموعة.
فتح الحزمة
k this deck
12
An elementary school teacher has three classes.She finds the following mean and standard deviations for student IQ scores.
She knows she is most effective when the students all have similar IQ levels.Which class is she likely to be most effective with?
A) Class #1
B) Class #2
C) Class #3
D) Classes #1 and #2 equally
E) Classes #1 and #3 equally
She knows she is most effective when the students all have similar IQ levels.Which class is she likely to be most effective with?
A) Class #1
B) Class #2
C) Class #3
D) Classes #1 and #2 equally
E) Classes #1 and #3 equally
فتح الحزمة
افتح القفل للوصول البطاقات البالغ عددها 86 في هذه المجموعة.
فتح الحزمة
k this deck
13
Describe,as simply as possible,what is meant by the statement "It is statistically significant at the 0.05 level."
فتح الحزمة
افتح القفل للوصول البطاقات البالغ عددها 86 في هذه المجموعة.
فتح الحزمة
k this deck
14
Discuss the concepts of control variables and trivariate tables.What are three limitations of trivariate tables?
فتح الحزمة
افتح القفل للوصول البطاقات البالغ عددها 86 في هذه المجموعة.
فتح الحزمة
k this deck
15
Refer to the information in the following table when answering questions 18 to 26:
Which neighbourhood(s)has an income distribution resembling a skewed curve?
A) Glenbrook
B) Meadowbrook
C) Elmbrook
D) Glenbrook and Elmbrook
E) Meadowbrook and Elmbrook
Which neighbourhood(s)has an income distribution resembling a skewed curve?
A) Glenbrook
B) Meadowbrook
C) Elmbrook
D) Glenbrook and Elmbrook
E) Meadowbrook and Elmbrook
فتح الحزمة
افتح القفل للوصول البطاقات البالغ عددها 86 في هذه المجموعة.
فتح الحزمة
k this deck
16
Explain how a researcher codes,enters,and cleans data so that it can be used for statistical analysis.What procedures are involved in each of these steps?
فتح الحزمة
افتح القفل للوصول البطاقات البالغ عددها 86 في هذه المجموعة.
فتح الحزمة
k this deck
17
Refer to the information in the following table when answering questions 18 to 26:
Which neighbourhood(s)has the greatest differences in family income?
A) Glenbrook
B) Meadowbrook
C) Elmbrook
D) Glenbrook and Elmbrook
E) Meadowbrook and Elmbrook
Which neighbourhood(s)has the greatest differences in family income?
A) Glenbrook
B) Meadowbrook
C) Elmbrook
D) Glenbrook and Elmbrook
E) Meadowbrook and Elmbrook
فتح الحزمة
افتح القفل للوصول البطاقات البالغ عددها 86 في هذه المجموعة.
فتح الحزمة
k this deck
18
Describe each of the three techniques researchers use when deciding whether a relationship exists between two variables.
فتح الحزمة
افتح القفل للوصول البطاقات البالغ عددها 86 في هذه المجموعة.
فتح الحزمة
k this deck
19
A "codebook" is
A) only used in existing statistics research.
B) a document that tells the researcher where variables are located in the data file and what numbers go with what variable attributes.
C) the set of instructions that tell interviewers or experimenters how to treat respondents or subjects.
D) an unnecessary part of data analysis since computers were invented.
E) a sheet of paper with a grid of 80 columns corresponding to data card columns, with rows representing an individual card.
فتح الحزمة
افتح القفل للوصول البطاقات البالغ عددها 86 في هذه المجموعة.
فتح الحزمة
k this deck
20
Calculate the median for the following six shoe sizes: 9,10,10,8,12,11.
A) 8
B) 8.5
C) 9
D) 9.5
E) 10
A) 8
B) 8.5
C) 9
D) 9.5
E) 10
فتح الحزمة
افتح القفل للوصول البطاقات البالغ عددها 86 في هذه المجموعة.
فتح الحزمة
k this deck
21
Among the violent offenders in the following table,what is the ratio of males to females?
A) 1 male to 1 female, or 1:1
B) 2 males to 3 females, or 2:3
C) 4 males to 1 female, or 4:1
D) 2 males to 1 female, or 2:1
A) 1 male to 1 female, or 1:1
B) 2 males to 3 females, or 2:3
C) 4 males to 1 female, or 4:1
D) 2 males to 1 female, or 2:1
فتح الحزمة
افتح القفل للوصول البطاقات البالغ عددها 86 في هذه المجموعة.
فتح الحزمة
k this deck
22
Refer to the information in the following table when answering questions 18 to 26:
Which neighbourhood(s)has the highest number of families with the lowest incomes?
A) Glenbrook
B) Meadowbrook
C) Elmbrook
D) Glenbrook and Elmbrook
E) Meadowbrook and Elmbrook
Which neighbourhood(s)has the highest number of families with the lowest incomes?
A) Glenbrook
B) Meadowbrook
C) Elmbrook
D) Glenbrook and Elmbrook
E) Meadowbrook and Elmbrook
فتح الحزمة
افتح القفل للوصول البطاقات البالغ عددها 86 في هذه المجموعة.
فتح الحزمة
k this deck
23
All the sales representatives at Acadia Insurance are female,and their mean annual salary is $60,000 with a standard deviation of $5000.All customer account managers are male and they have a mean salary of $80,000 with a standard deviation of $15,000.Heather knows she is one standard deviation above the mean of the sales representatives.She wants to transfer to become the first female customer account manager and will begin at her same salary.After she transfers,compared to the customer account managers her salary will be at what z-score?
A) -2
B) -1
C) 0
D) +1
E) +2
A) -2
B) -1
C) 0
D) +1
E) +2
فتح الحزمة
افتح القفل للوصول البطاقات البالغ عددها 86 في هذه المجموعة.
فتح الحزمة
k this deck
24
Refer to the information in the following table when answering questions 18 to 26:
Which neighbourhood(s)has the 50th percentile of education as a college education?
A) Glenbrook
B) Meadowbrook
C) Elmbrook
D) Glenbrook and Elmbrook
E) Meadowbrook and Elmbrook
Which neighbourhood(s)has the 50th percentile of education as a college education?
A) Glenbrook
B) Meadowbrook
C) Elmbrook
D) Glenbrook and Elmbrook
E) Meadowbrook and Elmbrook
فتح الحزمة
افتح القفل للوصول البطاقات البالغ عددها 86 في هذه المجموعة.
فتح الحزمة
k this deck
25
If the true situation in the world is that there is no causal relationship,but a researcher states that there is a causal relationship,what error occurs?
A) Type I
B) Type II
C) Falsely reject the null hypothesis
D) Falsely accept the null hypothesis
E) A and C
A) Type I
B) Type II
C) Falsely reject the null hypothesis
D) Falsely accept the null hypothesis
E) A and C
فتح الحزمة
افتح القفل للوصول البطاقات البالغ عددها 86 في هذه المجموعة.
فتح الحزمة
k this deck
26
Connie and Tom both received 75 percent on the social research methods final exam.The mean for all women who took the test was 80 percent and the median was 75 percent with a standard deviation of 5 percent.The mean and median for the men was 65 percent with a standard deviation of 10 percent.What is the z-score for Connie and Tom relative to those of their own sex?
A) Connie's z-score is +1 and Tom's is -2, so Connie did better.
B) Connie's z-score is -1 and Tom's is +1, so Tom did better.
C) Both Connie and Tom have the same z-score, 1.
D) Connie's z-score is 0 and Tom's is +1, so he did worse.
E) Connie's z-score is -2 and Tom's is -1, so Tom did better.
A) Connie's z-score is +1 and Tom's is -2, so Connie did better.
B) Connie's z-score is -1 and Tom's is +1, so Tom did better.
C) Both Connie and Tom have the same z-score, 1.
D) Connie's z-score is 0 and Tom's is +1, so he did worse.
E) Connie's z-score is -2 and Tom's is -1, so Tom did better.
فتح الحزمة
افتح القفل للوصول البطاقات البالغ عددها 86 في هذه المجموعة.
فتح الحزمة
k this deck
27
Which of the following research topics is an example of multivariate analysis?
A) An analysis of the ages of all women who are corporate executives
B) An analysis of the relationship between age, sex, and type of restaurant frequented in Saskatoon
C) An analysis of the relationship between undergraduate majors and level of position held in a major corporation
D) An analysis of the relationship between type of offense and length of prison sentence
E) The relationship between socio-economic status and annual income
فتح الحزمة
افتح القفل للوصول البطاقات البالغ عددها 86 في هذه المجموعة.
فتح الحزمة
k this deck
28
Which neighbourhood(s)has the greatest variation in years of education?
A) Glenbrook
B) Meadowbrook
C) Elmbrook
D) Glenbrook and Elmbrook
E) Meadowbrook and Elmbrook
فتح الحزمة
افتح القفل للوصول البطاقات البالغ عددها 86 في هذه المجموعة.
فتح الحزمة
k this deck
29
Refer to the information in the following table when answering questions 18 to 26:
In which neighbourhood(s)do half the families have incomes of $28,000 or more?
A) Glenbrook
B) Meadowbrook
C) Elmbrook
D) Glenbrook and Elmbrook
E) Meadowbrook and Elmbrook
In which neighbourhood(s)do half the families have incomes of $28,000 or more?
A) Glenbrook
B) Meadowbrook
C) Elmbrook
D) Glenbrook and Elmbrook
E) Meadowbrook and Elmbrook
فتح الحزمة
افتح القفل للوصول البطاقات البالغ عددها 86 في هذه المجموعة.
فتح الحزمة
k this deck
30
If the true situation in the world is that there is a causal relationship,but a researcher states that there is no causal relationship,what error occurs?
A) Type I
B) Type II
C) Falsely reject the null hypothesis
D) Falsely accept the null hypothesis
E) B and D
A) Type I
B) Type II
C) Falsely reject the null hypothesis
D) Falsely accept the null hypothesis
E) B and D
فتح الحزمة
افتح القفل للوصول البطاقات البالغ عددها 86 في هذه المجموعة.
فتح الحزمة
k this deck
31
Your research assistant finds a positive relationship between mother's education and income at age 40.The relationship remained after controlling for the family's social class.This means that
A) social class is really the causal variable.
B) social class does not have an impact on the relationship.
C) the original relationship is spurious.
D) income is caused by neither the mother's education level nor her social class.
E) the mother's education has no effect on her future income.
A) social class is really the causal variable.
B) social class does not have an impact on the relationship.
C) the original relationship is spurious.
D) income is caused by neither the mother's education level nor her social class.
E) the mother's education has no effect on her future income.
فتح الحزمة
افتح القفل للوصول البطاقات البالغ عددها 86 في هذه المجموعة.
فتح الحزمة
k this deck
32
Which neighbourhood(s)has a small number of very high income people and a greater proportion of families earning $26,000?
A) Glenbrook
B) Meadowbrook
C) Elmbrook
D) Glenbrook and Elmbrook
E) Meadowbrook and Elmbrook
فتح الحزمة
افتح القفل للوصول البطاقات البالغ عددها 86 في هذه المجموعة.
فتح الحزمة
k this deck
33
Refer to the information in the following table when answering questions 18 to 26:
Which neighbourhood(s)has the smallest differences in family income?
A) Glenbrook
B) Meadowbrook
C) Elmbrook
D) Glenbrook and Elmbrook
E) Meadowbrook and Elmbrook
Which neighbourhood(s)has the smallest differences in family income?
A) Glenbrook
B) Meadowbrook
C) Elmbrook
D) Glenbrook and Elmbrook
E) Meadowbrook and Elmbrook
فتح الحزمة
افتح القفل للوصول البطاقات البالغ عددها 86 في هذه المجموعة.
فتح الحزمة
k this deck
34
Fatima Fashionista wears a size 2 blazer.She went to her favourite clothing store and found that the mean size of the store's stock of blazers is a size 10 with a standard deviation of 4 sizes.What is her z-score in the distribution of the store's blazers?
A) zero
B) 1
C) 2
D) -1.5
E) -2
A) zero
B) 1
C) 2
D) -1.5
E) -2
فتح الحزمة
افتح القفل للوصول البطاقات البالغ عددها 86 في هذه المجموعة.
فتح الحزمة
k this deck
35
How many individuals with 17+ years of education engaged in a level of violence defined as medium?
A) 20
B) 180
C) 160
D) 55
E) 5
فتح الحزمة
افتح القفل للوصول البطاقات البالغ عددها 86 في هذه المجموعة.
فتح الحزمة
k this deck
36
What feature of experimental research allows it to demonstrate causality without control variables?
A) Experimental researchers cannot demonstrate causality without control variables.
B) Experimental researchers eliminate alternative explanations by choosing a research design that physically controls potential alternative explanations for results.
C) Experimental researchers eliminate alternative explanations by testing temporal order and association.
D) Experimental researchers can be assured causal relationships are not spurious because they use random sampling procedures.
E) Experimental researchers make use of partials instead of control variables in order to demonstrate causality.
فتح الحزمة
افتح القفل للوصول البطاقات البالغ عددها 86 في هذه المجموعة.
فتح الحزمة
k this deck
37
Susan weighs 140 pounds.You learn that for the women in her sorority the mean weight is 130 pounds,the median is 125,the mode is 120,and the standard deviation is 10 pounds.What is Susan's z-score in the distribution weight in the sorority?
A) zero
B) 1
C) 2
D) 1.5
E) -1
A) zero
B) 1
C) 2
D) 1.5
E) -1
فتح الحزمة
افتح القفل للوصول البطاقات البالغ عددها 86 في هذه المجموعة.
فتح الحزمة
k this deck
38
What does it mean if someone tells you that they calculated a correlation of -0.75?
A) There is a strong negative relationship between two ratio or interval level variables.
B) There is statistical independence between the two variables.
C) The variables that were used were measured at the nominal level and the relationship between them is strong.
D) The researcher looked at two ordinal-level variables and found no relationship between them.
E) The person made an error in calculation: correlations can never be negative numbers.
فتح الحزمة
افتح القفل للوصول البطاقات البالغ عددها 86 في هذه المجموعة.
فتح الحزمة
k this deck
39
Refer to the information in the following table when answering questions 32 and 33:
What type of relationship exists between level of violence and level of education?
A) There is no relationship.
B) There is a negative relationship.
C) There is a positive relationship.
D) There is a nonlinear relationship.
E) There is a recursive relationship.
What type of relationship exists between level of violence and level of education?
A) There is no relationship.
B) There is a negative relationship.
C) There is a positive relationship.
D) There is a nonlinear relationship.
E) There is a recursive relationship.
فتح الحزمة
افتح القفل للوصول البطاقات البالغ عددها 86 في هذه المجموعة.
فتح الحزمة
k this deck
40
Which of the following tells how well a set of variables explains a dependent variable?
A) Z-score
B) Standard deviation
C) Chi-square
D) R-squared
E) Gamma
A) Z-score
B) Standard deviation
C) Chi-square
D) R-squared
E) Gamma
فتح الحزمة
افتح القفل للوصول البطاقات البالغ عددها 86 في هذه المجموعة.
فتح الحزمة
k this deck
41
curvilinear relationship
فتح الحزمة
افتح القفل للوصول البطاقات البالغ عددها 86 في هذه المجموعة.
فتح الحزمة
k this deck
42
contingency cleaning
فتح الحزمة
افتح القفل للوصول البطاقات البالغ عددها 86 في هذه المجموعة.
فتح الحزمة
k this deck
43
descriptive statistics
فتح الحزمة
افتح القفل للوصول البطاقات البالغ عددها 86 في هذه المجموعة.
فتح الحزمة
k this deck
44
control variable
فتح الحزمة
افتح القفل للوصول البطاقات البالغ عددها 86 في هذه المجموعة.
فتح الحزمة
k this deck
45
Which of the following is an example of a multivariate statistic?
A) Multiple regression
B) Standard deviation
C) Z-score
D) Chi-square
E) Age
A) Multiple regression
B) Standard deviation
C) Z-score
D) Chi-square
E) Age
فتح الحزمة
افتح القفل للوصول البطاقات البالغ عددها 86 في هذه المجموعة.
فتح الحزمة
k this deck
46
code sheet
فتح الحزمة
افتح القفل للوصول البطاقات البالغ عددها 86 في هذه المجموعة.
فتح الحزمة
k this deck
47
Usually,when constructing a scattergram,the __________ goes on the X axis and the __________ goes on the Y axis.
A) independent variable; dependent variable
B) dependent variable; independent variable
C) form; direction
D) direction; form
E) control variable; causal variable
A) independent variable; dependent variable
B) dependent variable; independent variable
C) form; direction
D) direction; form
E) control variable; causal variable
فتح الحزمة
افتح القفل للوصول البطاقات البالغ عددها 86 في هذه المجموعة.
فتح الحزمة
k this deck
48
body of a table
فتح الحزمة
افتح القفل للوصول البطاقات البالغ عددها 86 في هذه المجموعة.
فتح الحزمة
k this deck
49
Professor Quincy Quacker found a statistically significant relationship between variable X and variable Y.It is statistically significant at the 0.05 level.What does this mean?
A) There are 95 chances in 100 that the results are true.
B) There is a 5 percent chance that the results are true.
C) If 100 samples were drawn, results like these could be obtained by pure random chance 10 percent of the time.
D) A person could be 95 percent sure that the results of the study were a reflection of the population if random sampling was used.
E) A and D.
فتح الحزمة
افتح القفل للوصول البطاقات البالغ عددها 86 في هذه المجموعة.
فتح الحزمة
k this deck
50
cell of a table
فتح الحزمة
افتح القفل للوصول البطاقات البالغ عددها 86 في هذه المجموعة.
فتح الحزمة
k this deck
51
bivariate statistics
فتح الحزمة
افتح القفل للوصول البطاقات البالغ عددها 86 في هذه المجموعة.
فتح الحزمة
k this deck
52
correlation
فتح الحزمة
افتح القفل للوصول البطاقات البالغ عددها 86 في هذه المجموعة.
فتح الحزمة
k this deck
53
codebook
فتح الحزمة
افتح القفل للوصول البطاقات البالغ عددها 86 في هذه المجموعة.
فتح الحزمة
k this deck
54
Which of the following cannot be learned from a scattergram?
A) Form
B) Intensity
C) Direction
D) Precision
E) None of the above
A) Form
B) Intensity
C) Direction
D) Precision
E) None of the above
فتح الحزمة
افتح القفل للوصول البطاقات البالغ عددها 86 في هذه المجموعة.
فتح الحزمة
k this deck
55
independence
فتح الحزمة
افتح القفل للوصول البطاقات البالغ عددها 86 في هذه المجموعة.
فتح الحزمة
k this deck
56
bar chart
فتح الحزمة
افتح القفل للوصول البطاقات البالغ عددها 86 في هذه المجموعة.
فتح الحزمة
k this deck
57
frequency distribution
فتح الحزمة
افتح القفل للوصول البطاقات البالغ عددها 86 في هذه المجموعة.
فتح الحزمة
k this deck
58
direct entry method
فتح الحزمة
افتح القفل للوصول البطاقات البالغ عددها 86 في هذه المجموعة.
فتح الحزمة
k this deck
59
cross-tabulation
فتح الحزمة
افتح القفل للوصول البطاقات البالغ عددها 86 في هذه المجموعة.
فتح الحزمة
k this deck
60
contingency table
فتح الحزمة
افتح القفل للوصول البطاقات البالغ عددها 86 في هذه المجموعة.
فتح الحزمة
k this deck
61
possible code cleaning
فتح الحزمة
افتح القفل للوصول البطاقات البالغ عددها 86 في هذه المجموعة.
فتح الحزمة
k this deck
62
median
فتح الحزمة
افتح القفل للوصول البطاقات البالغ عددها 86 في هذه المجموعة.
فتح الحزمة
k this deck
63
pie chart
فتح الحزمة
افتح القفل للوصول البطاقات البالغ عددها 86 في هذه المجموعة.
فتح الحزمة
k this deck
64
mean
فتح الحزمة
افتح القفل للوصول البطاقات البالغ عددها 86 في هذه المجموعة.
فتح الحزمة
k this deck
65
range
فتح الحزمة
افتح القفل للوصول البطاقات البالغ عددها 86 في هذه المجموعة.
فتح الحزمة
k this deck
66
marginals
فتح الحزمة
افتح القفل للوصول البطاقات البالغ عددها 86 في هذه المجموعة.
فتح الحزمة
k this deck
67
skewed distribution
فتح الحزمة
افتح القفل للوصول البطاقات البالغ عددها 86 في هذه المجموعة.
فتح الحزمة
k this deck
68
partials
فتح الحزمة
افتح القفل للوصول البطاقات البالغ عددها 86 في هذه المجموعة.
فتح الحزمة
k this deck
69
linear relationship
فتح الحزمة
افتح القفل للوصول البطاقات البالغ عددها 86 في هذه المجموعة.
فتح الحزمة
k this deck
70
level of statistical significance
فتح الحزمة
افتح القفل للوصول البطاقات البالغ عددها 86 في هذه المجموعة.
فتح الحزمة
k this deck
71
Type I error
فتح الحزمة
افتح القفل للوصول البطاقات البالغ عددها 86 في هذه المجموعة.
فتح الحزمة
k this deck
72
scattergram
فتح الحزمة
افتح القفل للوصول البطاقات البالغ عددها 86 في هذه المجموعة.
فتح الحزمة
k this deck
73
standard deviation
فتح الحزمة
افتح القفل للوصول البطاقات البالغ عددها 86 في هذه المجموعة.
فتح الحزمة
k this deck
74
mode
فتح الحزمة
افتح القفل للوصول البطاقات البالغ عددها 86 في هذه المجموعة.
فتح الحزمة
k this deck
75
measure of association
فتح الحزمة
افتح القفل للوصول البطاقات البالغ عددها 86 في هذه المجموعة.
فتح الحزمة
k this deck
76
normal distribution
فتح الحزمة
افتح القفل للوصول البطاقات البالغ عددها 86 في هذه المجموعة.
فتح الحزمة
k this deck
77
multiple regression
فتح الحزمة
افتح القفل للوصول البطاقات البالغ عددها 86 في هذه المجموعة.
فتح الحزمة
k this deck
78
precision
فتح الحزمة
افتح القفل للوصول البطاقات البالغ عددها 86 في هذه المجموعة.
فتح الحزمة
k this deck
79
percentile
فتح الحزمة
افتح القفل للوصول البطاقات البالغ عددها 86 في هذه المجموعة.
فتح الحزمة
k this deck
80
statistical significance
فتح الحزمة
افتح القفل للوصول البطاقات البالغ عددها 86 في هذه المجموعة.
فتح الحزمة
k this deck
فتح الحزمة
افتح القفل للوصول البطاقات البالغ عددها 86 في هذه المجموعة.


