Deck 8: Statistical Functions
ملء الشاشة (f)
سؤال
سؤال
سؤال
سؤال
سؤال
سؤال
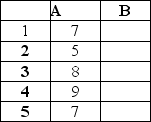
If you autofill the formula =RANK.AVG(A1,$A$1:
$A$5,0)from B1 to B5,what would the value be in B5?
A)4)5
B)4
C)3)5
D)3
$A$5,0)from B1 to B5,what would the value be in B5?
A)4)5
B)4
C)3)5
D)3
سؤال
سؤال
سؤال
سؤال
سؤال
سؤال
سؤال
سؤال
سؤال
سؤال
This is the first 4 lines of an excel list of 3082 records.
Which formula counts the number of Gold Level Members in the entire list?
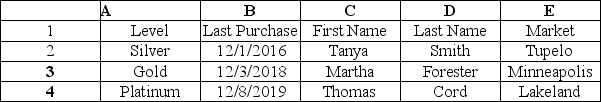
A)=COUNTIF(A2:A3083,"Gold")
B)=COUNTIFS(A2:A3083,"Gold")
C)=COUNTIF(E2:E3083,"Gold")
D)=COUNTIFS(A2:E3083,"Gold")
Which formula counts the number of Gold Level Members in the entire list?
A)=COUNTIF(A2:A3083,"Gold")
B)=COUNTIFS(A2:A3083,"Gold")
C)=COUNTIF(E2:E3083,"Gold")
D)=COUNTIFS(A2:E3083,"Gold")
سؤال
سؤال
سؤال
سؤال
This is the top three lines in a list of 8200 records.You want an average of the number of speeding tickets for Red Toyota Priuses.Which is the correct formula?
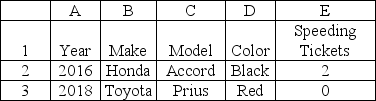
A)=AVERAGEIFS(A2:A8201,D2:D8201,"Red",B2:B8201,"Toyota",C2:C8201,"Prius")
B)=AVERAGEIFS(E2:E8201,D2:D8201,"Red",B2:B8201,"Toyota",C2:C8201,"Prius")
C)=AVERAGEIF(E2:E8201,D2:D8201,"Red",B2:B8201,"Toyota",C2:C8201,"Prius")
D)=AVERAGEIF(E2:E8201,"Red","Toyota","Prius")
A)=AVERAGEIFS(A2:A8201,D2:D8201,"Red",B2:B8201,"Toyota",C2:C8201,"Prius")
B)=AVERAGEIFS(E2:E8201,D2:D8201,"Red",B2:B8201,"Toyota",C2:C8201,"Prius")
C)=AVERAGEIF(E2:E8201,D2:D8201,"Red",B2:B8201,"Toyota",C2:C8201,"Prius")
D)=AVERAGEIF(E2:E8201,"Red","Toyota","Prius")
سؤال
سؤال
سؤال
سؤال
سؤال
سؤال
سؤال
سؤال
سؤال
سؤال
سؤال
سؤال
سؤال
سؤال
سؤال
سؤال
سؤال
سؤال
سؤال
سؤال
سؤال
سؤال
سؤال
سؤال
سؤال
سؤال
سؤال
سؤال
سؤال
سؤال
سؤال
سؤال
سؤال
سؤال
سؤال
سؤال
سؤال
سؤال
سؤال
سؤال
سؤال
سؤال
سؤال
سؤال
سؤال
سؤال
سؤال
سؤال
سؤال
سؤال
سؤال
سؤال
سؤال
سؤال
سؤال
سؤال
سؤال
سؤال
سؤال
سؤال

فتح الحزمة
قم بالتسجيل لفتح البطاقات في هذه المجموعة!
Unlock Deck
Unlock Deck
1/100
العب
ملء الشاشة (f)
Deck 8: Statistical Functions
1
A college admissions office might use which of the following functions to offer scholarships to incoming student who are in the top 10% of their high school classes?
A)PERCENTILE.INC
B)PERCENTILE.EXC
C)PERCENTRANK.INC
D)PERCENTRANK.EXC
A)PERCENTILE.INC
B)PERCENTILE.EXC
C)PERCENTRANK.INC
D)PERCENTRANK.EXC
A
2
What is the Criteria2 argument of:
=COUNTIFS(A2:
A64,"Blue",B2:
B64,"Black")?
A)"Blue"
B)B2:B64
C)"Black"
D)A2:A64
=COUNTIFS(A2:
A64,"Blue",B2:
B64,"Black")?
A)"Blue"
B)B2:B64
C)"Black"
D)A2:A64
C
3
Which of the following is not an argument in the PERCENTRANK.INC and PERCENTRANK.EXC functions?
A)array
B)criteria
C)x
D)significance
A)array
B)criteria
C)x
D)significance
B
4
When using the Function Arguments Box,Excel will ________.
A)suggest criteria
B)not enter quotation marks in text criteria
C)suggest ranges
D)enter the quotation marks in text criteria,automatically
A)suggest criteria
B)not enter quotation marks in text criteria
C)suggest ranges
D)enter the quotation marks in text criteria,automatically
فتح الحزمة
افتح القفل للوصول البطاقات البالغ عددها 100 في هذه المجموعة.
فتح الحزمة
k this deck
5
What is the sum_range argument of:
=SUMIF(A2:
A64,"Green",C2:
C64)?
A)C2:C64
B)"Green"
C)SUMIF
D)A2:A64
=SUMIF(A2:
A64,"Green",C2:
C64)?
A)C2:C64
B)"Green"
C)SUMIF
D)A2:A64
فتح الحزمة
افتح القفل للوصول البطاقات البالغ عددها 100 في هذه المجموعة.
فتح الحزمة
k this deck
6
If you autofill the formula =RANK.AVG(A1,$A$1:
$A$5,0)from B1 to B5,what would the value be in B5?
A)4)5
B)4
C)3)5
D)3
$A$5,0)from B1 to B5,what would the value be in B5?
A)4)5
B)4
C)3)5
D)3
فتح الحزمة
افتح القفل للوصول البطاقات البالغ عددها 100 في هذه المجموعة.
فتح الحزمة
k this deck
7
Which function returns the rank of a value within a dataset,assigning an average rank for tied values?
A)RANK.EQ
B)RANK.AVG
C)RANK.TIE
D)AVERAGERANK
A)RANK.EQ
B)RANK.AVG
C)RANK.TIE
D)AVERAGERANK
فتح الحزمة
افتح القفل للوصول البطاقات البالغ عددها 100 في هذه المجموعة.
فتح الحزمة
k this deck
8
What function returns the variance of a population?
A)VARA
B)VAR.P
C)VAR.S
D)VARPA
A)VARA
B)VAR.P
C)VAR.S
D)VARPA
فتح الحزمة
افتح القفل للوصول البطاقات البالغ عددها 100 في هذه المجموعة.
فتح الحزمة
k this deck
9
Which of the following is an allowable quart argument in a QUARTILE.EXC function?
A)4
B)0
C)2
D)5
A)4
B)0
C)2
D)5
فتح الحزمة
افتح القفل للوصول البطاقات البالغ عددها 100 في هذه المجموعة.
فتح الحزمة
k this deck
10
The RANK.EQ function returns ________.
A)the rank of a value within a dataset,giving an average ranking to tied values
B)the rank of a value within a dataset,giving the highest ranking possible to ties
C)the rank of a value within a dataset,throwing out ties
D)the rank of a value within a dataset,giving the same ranking to tied values
A)the rank of a value within a dataset,giving an average ranking to tied values
B)the rank of a value within a dataset,giving the highest ranking possible to ties
C)the rank of a value within a dataset,throwing out ties
D)the rank of a value within a dataset,giving the same ranking to tied values
فتح الحزمة
افتح القفل للوصول البطاقات البالغ عددها 100 في هذه المجموعة.
فتح الحزمة
k this deck
11
What are the two arguments for the FREQUENCY function?
A)data_array,correlation_array
B)data_array,bins_array
C)data_array,set_value
D)data_array,outlier
A)data_array,correlation_array
B)data_array,bins_array
C)data_array,set_value
D)data_array,outlier
فتح الحزمة
افتح القفل للوصول البطاقات البالغ عددها 100 في هذه المجموعة.
فتح الحزمة
k this deck
12
Which of the following values would demonstrate the strongest positive relationship while using the CORREL function?
A)0
B)0)5
C)-1
D)1
A)0
B)0)5
C)-1
D)1
فتح الحزمة
افتح القفل للوصول البطاقات البالغ عددها 100 في هذه المجموعة.
فتح الحزمة
k this deck
13
Which of the following functions determines the standard deviation of a sample?
A)STDEVA
B)VARA
C)STDEV.P
D)STDEV.S
A)STDEVA
B)VARA
C)STDEV.P
D)STDEV.S
فتح الحزمة
افتح القفل للوصول البطاقات البالغ عددها 100 في هذه المجموعة.
فتح الحزمة
k this deck
14
Relative Standing measures ________.
A)the median of a dataset
B)the rank value of the quartiles of a dataset
C)the standard deviation of a dataset
D)the rank of one value with regard to other values in a dataset
A)the median of a dataset
B)the rank value of the quartiles of a dataset
C)the standard deviation of a dataset
D)the rank of one value with regard to other values in a dataset
فتح الحزمة
افتح القفل للوصول البطاقات البالغ عددها 100 في هذه المجموعة.
فتح الحزمة
k this deck
15
In SUMIF,AVERAGEIF,and COUNTIF functions using text criteria,enclose the criteria in:
A)**
B)<>
C)##
D)""
A)**
B)<>
C)##
D)""
فتح الحزمة
افتح القفل للوصول البطاقات البالغ عددها 100 في هذه المجموعة.
فتح الحزمة
k this deck
16
This is the first 4 lines of an excel list of 3082 records.
Which formula counts the number of Gold Level Members in the entire list?
A)=COUNTIF(A2:A3083,"Gold")
B)=COUNTIFS(A2:A3083,"Gold")
C)=COUNTIF(E2:E3083,"Gold")
D)=COUNTIFS(A2:E3083,"Gold")
Which formula counts the number of Gold Level Members in the entire list?
A)=COUNTIF(A2:A3083,"Gold")
B)=COUNTIFS(A2:A3083,"Gold")
C)=COUNTIF(E2:E3083,"Gold")
D)=COUNTIFS(A2:E3083,"Gold")
فتح الحزمة
افتح القفل للوصول البطاقات البالغ عددها 100 في هذه المجموعة.
فتح الحزمة
k this deck
17
What would be the result of this formula:
=AVERAGEIF(A2:
A64,"Green",C2:
C64)?
A)An average of the values in the C and A columns when the values in the B column are Green
B)There isn't enough information here to tell.
C)An average of the values in the A column when the values in the C column are Green
D)An average of the values in the C column when the values in the A column are Green
فتح الحزمة
افتح القفل للوصول البطاقات البالغ عددها 100 في هذه المجموعة.
فتح الحزمة
k this deck
18
What is the first argument of an SUMIFS function?
A)Criteria_range1
B)Sum_range
C)Criteria1
D)Criteria2
A)Criteria_range1
B)Sum_range
C)Criteria1
D)Criteria2
فتح الحزمة
افتح القفل للوصول البطاقات البالغ عددها 100 في هذه المجموعة.
فتح الحزمة
k this deck
19
Which function would you use to determine the number of occurrences of a particular value in a dataset?
A)BINS
B)DEVP
C)FREQUENCY
D)CORREL
A)BINS
B)DEVP
C)FREQUENCY
D)CORREL
فتح الحزمة
افتح القفل للوصول البطاقات البالغ عددها 100 في هذه المجموعة.
فتح الحزمة
k this deck
20
This is the top three lines in a list of 8200 records.You want an average of the number of speeding tickets for Red Toyota Priuses.Which is the correct formula?
A)=AVERAGEIFS(A2:A8201,D2:D8201,"Red",B2:B8201,"Toyota",C2:C8201,"Prius")
B)=AVERAGEIFS(E2:E8201,D2:D8201,"Red",B2:B8201,"Toyota",C2:C8201,"Prius")
C)=AVERAGEIF(E2:E8201,D2:D8201,"Red",B2:B8201,"Toyota",C2:C8201,"Prius")
D)=AVERAGEIF(E2:E8201,"Red","Toyota","Prius")
A)=AVERAGEIFS(A2:A8201,D2:D8201,"Red",B2:B8201,"Toyota",C2:C8201,"Prius")
B)=AVERAGEIFS(E2:E8201,D2:D8201,"Red",B2:B8201,"Toyota",C2:C8201,"Prius")
C)=AVERAGEIF(E2:E8201,D2:D8201,"Red",B2:B8201,"Toyota",C2:C8201,"Prius")
D)=AVERAGEIF(E2:E8201,"Red","Toyota","Prius")
فتح الحزمة
افتح القفل للوصول البطاقات البالغ عددها 100 في هذه المجموعة.
فتح الحزمة
k this deck
21
Which of the following outputs from an ANOVA summary report is used to determine the significance of the F-Test?
A)F
B)dF
C)SS
D)F-crit
A)F
B)dF
C)SS
D)F-crit
فتح الحزمة
افتح القفل للوصول البطاقات البالغ عددها 100 في هذه المجموعة.
فتح الحزمة
k this deck
22
The ________ function returns the variance of a sample of numerical data
A)VARPA
B)VAR.P
C)VARA
D)VAR.S
A)VARPA
B)VAR.P
C)VARA
D)VAR.S
فتح الحزمة
افتح القفل للوصول البطاقات البالغ عددها 100 في هذه المجموعة.
فتح الحزمة
k this deck
23
What is the common name for the square root of the variance?
A)Correlation coefficient
B)P-value
C)Standard deviation
D)T-test
A)Correlation coefficient
B)P-value
C)Standard deviation
D)T-test
فتح الحزمة
افتح القفل للوصول البطاقات البالغ عددها 100 في هذه المجموعة.
فتح الحزمة
k this deck
24
The simplest method of creating a ________ is with the Analysis Toolpak
A)frequency chart
B)histogram
C)standard deviation
D)distribution chart
A)frequency chart
B)histogram
C)standard deviation
D)distribution chart
فتح الحزمة
افتح القفل للوصول البطاقات البالغ عددها 100 في هذه المجموعة.
فتح الحزمة
k this deck
25
Which function would you use to test for a relationship between students' attendance and their test scores?
A)CORREL
B)RELATE.S
C)RELATE.P
D)VARPA
A)CORREL
B)RELATE.S
C)RELATE.P
D)VARPA
فتح الحزمة
افتح القفل للوصول البطاقات البالغ عددها 100 في هذه المجموعة.
فتح الحزمة
k this deck
26
________ returns the forecasted values of a target date using exponential smoothing.
A)FORECAST.ETS.CONFINT
B)FORECAST.ETS
C)FORECAST.ETS.SEASONALITY
D)FORECAST.LINEAR
A)FORECAST.ETS.CONFINT
B)FORECAST.ETS
C)FORECAST.ETS.SEASONALITY
D)FORECAST.LINEAR
فتح الحزمة
افتح القفل للوصول البطاقات البالغ عددها 100 في هذه المجموعة.
فتح الحزمة
k this deck
27
Which of the following represents the number of data points in a sample minus one?
A)F ratio
B)Probability
C)Degrees of Freedom
D)Critical value
A)F ratio
B)Probability
C)Degrees of Freedom
D)Critical value
فتح الحزمة
افتح القفل للوصول البطاقات البالغ عددها 100 في هذه المجموعة.
فتح الحزمة
k this deck
28
What is SS in an ANOVA summary report?
A)Summary statistics
B)Statistical score
C)Sum of squares
D)Square summary
A)Summary statistics
B)Statistical score
C)Sum of squares
D)Square summary
فتح الحزمة
افتح القفل للوصول البطاقات البالغ عددها 100 في هذه المجموعة.
فتح الحزمة
k this deck
29
A(n)________ is a visual depiction of a population distribution created by the Analysis ToolPak.
A)histogram
B)ANOVA
C)correlation coefficient
D)mu
A)histogram
B)ANOVA
C)correlation coefficient
D)mu
فتح الحزمة
افتح القفل للوصول البطاقات البالغ عددها 100 في هذه المجموعة.
فتح الحزمة
k this deck
30
________ is a measure of how two sets of data vary simultaneously.
A)Deviation
B)Covariance
C)Probability
D)Frequency
A)Deviation
B)Covariance
C)Probability
D)Frequency
فتح الحزمة
افتح القفل للوصول البطاقات البالغ عددها 100 في هذه المجموعة.
فتح الحزمة
k this deck
31
________ is a measure of how two set of data vary simultaneously and is calculated by taking the average of each product of the deviation of a data point.
A)Covariance
B)Correlation
C)Causation
D)Period
A)Covariance
B)Correlation
C)Causation
D)Period
فتح الحزمة
افتح القفل للوصول البطاقات البالغ عددها 100 في هذه المجموعة.
فتح الحزمة
k this deck
32
Why is it important to analyze the relationships between a sample and full population?
A)To find out how many data points are necessary to be statistically valid
B)To help make more informed statements about a population
C)To bring diverging data into analysis
D)To limit variance
A)To find out how many data points are necessary to be statistically valid
B)To help make more informed statements about a population
C)To bring diverging data into analysis
D)To limit variance
فتح الحزمة
افتح القفل للوصول البطاقات البالغ عددها 100 في هذه المجموعة.
فتح الحزمة
k this deck
33
A(n)________ is a dataset that contains a manageable subset of a population.
A)population
B)sample
C)variance
D)standard deviation
A)population
B)sample
C)variance
D)standard deviation
فتح الحزمة
افتح القفل للوصول البطاقات البالغ عددها 100 في هذه المجموعة.
فتح الحزمة
k this deck
34
________ determines how two sets of data from a sample vary simultaneously.
A)STDEV.S
B)COVARIANCE.S
C)CORREL
D)STDEV.P
A)STDEV.S
B)COVARIANCE.S
C)CORREL
D)STDEV.P
فتح الحزمة
افتح القفل للوصول البطاقات البالغ عددها 100 في هذه المجموعة.
فتح الحزمة
k this deck
35
Which of the following is an Excel Add-in?
A)Analysis ToolPak
B)Frequency
C)Standard deviation
D)ANOVA
A)Analysis ToolPak
B)Frequency
C)Standard deviation
D)ANOVA
فتح الحزمة
افتح القفل للوصول البطاقات البالغ عددها 100 في هذه المجموعة.
فتح الحزمة
k this deck
36
Which function returns the standard deviation of a population including logical values and text?
A)STDEVA
B)STDEV.P
C)STDEVPA
D)STDEV.S
A)STDEVA
B)STDEV.P
C)STDEVPA
D)STDEV.S
فتح الحزمة
افتح القفل للوصول البطاقات البالغ عددها 100 في هذه المجموعة.
فتح الحزمة
k this deck
37
What is MS in an ANOVA summary report?
A)Mean of the sample squared
B)Maximum of squared value
C)Minimum of squared value
D)Multiplier of sample
A)Mean of the sample squared
B)Maximum of squared value
C)Minimum of squared value
D)Multiplier of sample
فتح الحزمة
افتح القفل للوصول البطاقات البالغ عددها 100 في هذه المجموعة.
فتح الحزمة
k this deck
38
Which of the following is not an ANOVA calculation type?
A)Single-factor
B)Two-factor with replication
C)Two-factor without replication
D)Two wing
A)Single-factor
B)Two-factor with replication
C)Two-factor without replication
D)Two wing
فتح الحزمة
افتح القفل للوصول البطاقات البالغ عددها 100 في هذه المجموعة.
فتح الحزمة
k this deck
39
What is F in an ANOVA summary report?
A)Frequency
B)Falling rate
C)F ratio
D)Fallibility reading
A)Frequency
B)Falling rate
C)F ratio
D)Fallibility reading
فتح الحزمة
افتح القفل للوصول البطاقات البالغ عددها 100 في هذه المجموعة.
فتح الحزمة
k this deck
40
A(n)________ is a business intelligence tool which extrapolates future values based on current trends.
A)analysis of variance
B)forecast worksheet
C)standard deviation
D)frequency
A)analysis of variance
B)forecast worksheet
C)standard deviation
D)frequency
فتح الحزمة
افتح القفل للوصول البطاقات البالغ عددها 100 في هذه المجموعة.
فتح الحزمة
k this deck
41
The ________ function returns a value's rank as a percent between 0% and 100%.
فتح الحزمة
افتح القفل للوصول البطاقات البالغ عددها 100 في هذه المجموعة.
فتح الحزمة
k this deck
42
A(n)________ is a visual display of tabulated frequencies.
فتح الحزمة
افتح القفل للوصول البطاقات البالغ عددها 100 في هذه المجموعة.
فتح الحزمة
k this deck
43
The ________ function counts the number of cells in a range that meet multiple criteria.
فتح الحزمة
افتح القفل للوصول البطاقات البالغ عددها 100 في هذه المجموعة.
فتح الحزمة
k this deck
44
To count the number of Finance majors in a list of students and their college majors,use the ________ function.
فتح الحزمة
افتح القفل للوصول البطاقات البالغ عددها 100 في هذه المجموعة.
فتح الحزمة
k this deck
45
________ is the measure of how far the data sample spreads from the mean.
فتح الحزمة
افتح القفل للوصول البطاقات البالغ عددها 100 في هذه المجموعة.
فتح الحزمة
k this deck
46
Sum_range is the argument in the ________ function that is added together if a single condition is met.
فتح الحزمة
افتح القفل للوصول البطاقات البالغ عددها 100 في هذه المجموعة.
فتح الحزمة
k this deck
47
The ________ function is best suited to calculate quartiles including quartiles 0 and 4.
فتح الحزمة
افتح القفل للوصول البطاقات البالغ عددها 100 في هذه المجموعة.
فتح الحزمة
k this deck
48
________ statistics help analyze differences between groups and relationships within groups of data.
فتح الحزمة
افتح القفل للوصول البطاقات البالغ عددها 100 في هذه المجموعة.
فتح الحزمة
k this deck
49
The ________ function calculates the average,or arithmetic mean,of all cells in a range that meet a specific condition.
فتح الحزمة
افتح القفل للوصول البطاقات البالغ عددها 100 في هذه المجموعة.
فتح الحزمة
k this deck
50
The ________ is an add-in program that provides statistical analysis tools.
فتح الحزمة
افتح القفل للوصول البطاقات البالغ عددها 100 في هذه المجموعة.
فتح الحزمة
k this deck
51
The ________ function returns the variance of a population.
فتح الحزمة
افتح القفل للوصول البطاقات البالغ عددها 100 في هذه المجموعة.
فتح الحزمة
k this deck
52
The ________ is the square root of the variance.
فتح الحزمة
افتح القفل للوصول البطاقات البالغ عددها 100 في هذه المجموعة.
فتح الحزمة
k this deck
53
________ is a statistical hypothesis test that helps determine if samples of data were taken from the same population.
فتح الحزمة
افتح القفل للوصول البطاقات البالغ عددها 100 في هذه المجموعة.
فتح الحزمة
k this deck
54
The ________ function identifies a value's rank within a list of values,omitting the next
rank in the case of tied values.
rank in the case of tied values.
فتح الحزمة
افتح القفل للوصول البطاقات البالغ عددها 100 في هذه المجموعة.
فتح الحزمة
k this deck
55
________ is a measure of how two sets of data vary simultaneously.
فتح الحزمة
افتح القفل للوصول البطاقات البالغ عددها 100 في هذه المجموعة.
فتح الحزمة
k this deck
56
The ________ function will use average values to determine the rank of a number within a list if tied values are present.
فتح الحزمة
افتح القفل للوصول البطاقات البالغ عددها 100 في هذه المجموعة.
فتح الحزمة
k this deck
57
In SUMIFS,AVERAGEIFS and COUNTIFS functions,you must have a(n)________ argument for each criteria_range argument.
فتح الحزمة
افتح القفل للوصول البطاقات البالغ عددها 100 في هذه المجموعة.
فتح الحزمة
k this deck
58
________ is a measure of a dataset's dispersion or the difference between the highest and lowest values.
فتح الحزمة
افتح القفل للوصول البطاقات البالغ عددها 100 في هذه المجموعة.
فتح الحزمة
k this deck
59
A histogram requires ________ to tabulate data and return a frequency distribution table.
فتح الحزمة
افتح القفل للوصول البطاقات البالغ عددها 100 في هذه المجموعة.
فتح الحزمة
k this deck
60
The ________ is the probability of a population being similarity to a sample.
فتح الحزمة
افتح القفل للوصول البطاقات البالغ عددها 100 في هذه المجموعة.
فتح الحزمة
k this deck
61
Sort data in ________ order before beginning a forecast analysis.
فتح الحزمة
افتح القفل للوصول البطاقات البالغ عددها 100 في هذه المجموعة.
فتح الحزمة
k this deck
62
________ returns the forecasted values for a specific future target date using exponential smoothing.
فتح الحزمة
افتح القفل للوصول البطاقات البالغ عددها 100 في هذه المجموعة.
فتح الحزمة
k this deck
63
The PERCENTRANK.INC function displays a value's rank as a percentile of a range,including 0% and 100%.
فتح الحزمة
افتح القفل للوصول البطاقات البالغ عددها 100 في هذه المجموعة.
فتح الحزمة
k this deck
64
The k argument in a PERCENTILE function is a value from 0 to 1.
فتح الحزمة
افتح القفل للوصول البطاقات البالغ عددها 100 في هذه المجموعة.
فتح الحزمة
k this deck
65
The VARPA function calculates the variance of a population for numerical values.
فتح الحزمة
افتح القفل للوصول البطاقات البالغ عددها 100 في هذه المجموعة.
فتح الحزمة
k this deck
66
The Greek letter mu is the symbol for standard deviation.
فتح الحزمة
افتح القفل للوصول البطاقات البالغ عددها 100 في هذه المجموعة.
فتح الحزمة
k this deck
67
The arguments for COUNTIFS,SUMIFS,AVERAGEIFS are Range and Criteria.
فتح الحزمة
افتح القفل للوصول البطاقات البالغ عددها 100 في هذه المجموعة.
فتح الحزمة
k this deck
68
Both RANK.EQ and RANK.AVG functions have the same arguments.
فتح الحزمة
افتح القفل للوصول البطاقات البالغ عددها 100 في هذه المجموعة.
فتح الحزمة
k this deck
69
=AVERAGEIFS(C2:
C64,A2:
A64,"Blue",B2:
B64,"Black")
Returns an average of Column C of the items which are either Blue or Black.
C64,A2:
A64,"Blue",B2:
B64,"Black")
Returns an average of Column C of the items which are either Blue or Black.
فتح الحزمة
افتح القفل للوصول البطاقات البالغ عددها 100 في هذه المجموعة.
فتح الحزمة
k this deck
70
To determine how often a value occurs in a dataset,use the SUMIFS function.
فتح الحزمة
افتح القفل للوصول البطاقات البالغ عددها 100 في هذه المجموعة.
فتح الحزمة
k this deck
71
The ________ function returns the length of the repetitive pattern Excel detects for the time series.
فتح الحزمة
افتح القفل للوصول البطاقات البالغ عددها 100 في هذه المجموعة.
فتح الحزمة
k this deck
72
A quartile is a value used to divide a range into five equal groups.
فتح الحزمة
افتح القفل للوصول البطاقات البالغ عددها 100 في هذه المجموعة.
فتح الحزمة
k this deck
73
The CORREL function would be useful to determine the strength of a relationship between two variables.
فتح الحزمة
افتح القفل للوصول البطاقات البالغ عددها 100 في هذه المجموعة.
فتح الحزمة
k this deck
74
Two or more conditions can be used with SUMIFS function.
فتح الحزمة
افتح القفل للوصول البطاقات البالغ عددها 100 في هذه المجموعة.
فتح الحزمة
k this deck
75
If you have 10 years of SAT data and 10 years of Teacher pay data and you'd like to see a trend that might predict their behavior in the future,you would create a ________ Sheet.
فتح الحزمة
افتح القفل للوصول البطاقات البالغ عددها 100 في هذه المجموعة.
فتح الحزمة
k this deck
76
The ________ function returns the forecasted values for a specific future target date using exponential smoothing.
فتح الحزمة
افتح القفل للوصول البطاقات البالغ عددها 100 في هذه المجموعة.
فتح الحزمة
k this deck
77
This formula will successfully count all green items in the range C2:
C256.
=COUNTIF(C2:
C256,green)
C256.
=COUNTIF(C2:
C256,green)
فتح الحزمة
افتح القفل للوصول البطاقات البالغ عددها 100 في هذه المجموعة.
فتح الحزمة
k this deck
78
The FREQUENCY function determines the strength of the relationship between two data sets.
فتح الحزمة
افتح القفل للوصول البطاقات البالغ عددها 100 في هذه المجموعة.
فتح الحزمة
k this deck
79
The Significance argument in a PERCENTRANK function is the input for confidence intervals.
فتح الحزمة
افتح القفل للوصول البطاقات البالغ عددها 100 في هذه المجموعة.
فتح الحزمة
k this deck
80
Inferential statistics and Descriptive statistics are the same thing.
فتح الحزمة
افتح القفل للوصول البطاقات البالغ عددها 100 في هذه المجموعة.
فتح الحزمة
k this deck
فتح الحزمة
افتح القفل للوصول البطاقات البالغ عددها 100 في هذه المجموعة.


