Deck 4: Enhancing a Workbook With Charts and Graphs
ملء الشاشة (f)
سؤال
سؤال
سؤال
سؤال
سؤال
سؤال
سؤال
سؤال
سؤال
سؤال
سؤال
سؤال
سؤال
سؤال
سؤال
سؤال
سؤال
سؤال
سؤال
سؤال
سؤال
سؤال
سؤال
سؤال
سؤال
سؤال
سؤال
سؤال
سؤال
سؤال
سؤال
سؤال
سؤال
سؤال
سؤال
سؤال
سؤال
سؤال
سؤال
سؤال
سؤال
سؤال
سؤال
سؤال
سؤال
سؤال
سؤال
سؤال
سؤال
سؤال
سؤال
سؤال
سؤال
سؤال
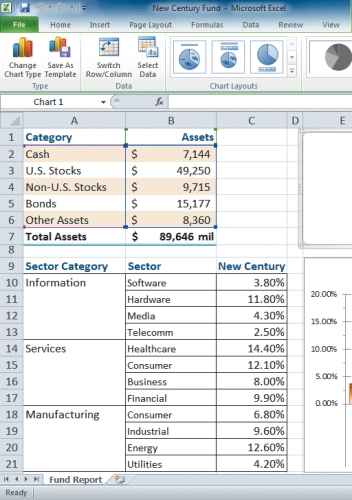
Referring to the figure above,an example of a ____ name is row 9.
A) data series
B) series name
C) data label
D) series label
سؤال
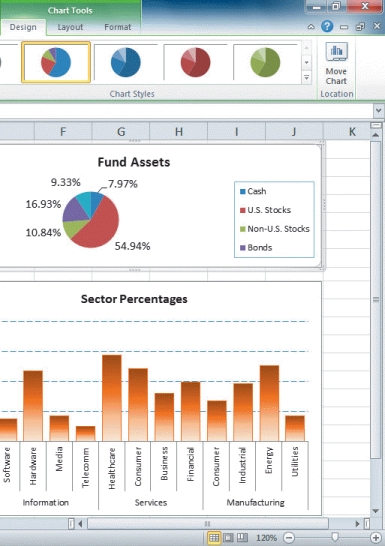
The columns and pie slices in the charts above are ____.
A) data markers
B) chart areas
C) major tick marks
D) minor tick marks
سؤال
Referring to the figure above,if you were to create a Fund Assets pie chart using the information in A1:B7,the data source for that chart would be ____.
A) A2:A6
B) B2:B6
C) A1:B5
D) A2:B6
سؤال
سؤال
سؤال
سؤال
سؤال
سؤال
In the above figure,the data markers shown in the cells in the column labeled "Percentages," are ____.
A) data lines
B) sparklines
C) data bars
D) spark bars
سؤال
سؤال
سؤال
سؤال
Depending on the pie chart layout you choose,you can ____.
A) hide or display the chart title
B) display a chart legend
C) add percentages to pie slices
D) all of the above
سؤال
سؤال
سؤال
Referring to the figure above,the entry 54.94%,shown next to the largest pie slice,is a ____.
A) data label
B) chart key
C) legend
D) series value
سؤال
سؤال
Referring to the figure above,the chart title for the pie chart is ____.
A) Fund Assets
B) Sector Percentages
C) 54.94%
D) Cash
سؤال
Referring to the figure above,the rectangular area to the right of the pie chart (listing Cash,U.S.Stocks,Non-U.S.Stocks,and Bonds)is the ____.
A) perspective
B) plot area
C) legend
D) data marker
سؤال
Referring to the figure above,in the column chart,the values along the left side (0.00%,5.00%,etc. )are ____.
A) plot markers
B) plot marks
C) data markers
D) tick marks
سؤال
سؤال
سؤال
سؤال
سؤال
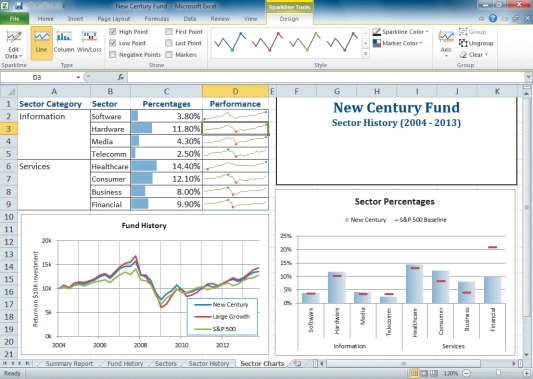
In the above figure,the data markers shown in the cells in the column labeled "Performance," are ____.
A) data lines
B) sparklines
C) data bars
D) spark bars
سؤال
سؤال

فتح الحزمة
قم بالتسجيل لفتح البطاقات في هذه المجموعة!
Unlock Deck
Unlock Deck
1/150
العب
ملء الشاشة (f)
Deck 4: Enhancing a Workbook With Charts and Graphs
1
When data bars are used with negative values,the date bars originate from the center of the cell with negative bars extending to the left and positive bars extending to the right.
True
2
In pie charts with legends,it's best to make the slice colors as similar as possible.
False
3
One of Edward Tufte's most important works is The Visual Display of Quantitative Information in which he laid out several principles for the design of charts and graphics.
True
4
The lengths of data bars are based on the value of each cell in the selected range.
فتح الحزمة
افتح القفل للوصول البطاقات البالغ عددها 150 في هذه المجموعة.
فتح الحزمة
k this deck
5
Chart sheets show both charts and worksheet data.
فتح الحزمة
افتح القفل للوصول البطاقات البالغ عددها 150 في هذه المجموعة.
فتح الحزمة
k this deck
6
Sparklines differ from data bars in that the sparklines are always placed in the cells containing the value they represent and each cell represents only a single bar from the bar chart.
فتح الحزمة
افتح القفل للوصول البطاقات البالغ عددها 150 في هذه المجموعة.
فتح الحزمة
k this deck
7
Although 3-D charts are visually attractive,they can obscure the relationship between the values in the chart by making it difficult to see which slice is larger.
فتح الحزمة
افتح القفل للوصول البطاقات البالغ عددها 150 في هذه المجموعة.
فتح الحزمة
k this deck
8
By default,embedded charts display the chart and any text or figures on separate pages.
فتح الحزمة
افتح القفل للوصول البطاقات البالغ عددها 150 في هذه المجموعة.
فتح الحزمة
k this deck
9
A chart style is similar to a cell style or a table style in that it formats several chart elements at one time.
فتح الحزمة
افتح القفل للوصول البطاقات البالغ عددها 150 في هذه المجموعة.
فتح الحزمة
k this deck
10
Excel has a built-in format to display four-digit year values,so you do not need to create one.
فتح الحزمة
افتح القفل للوصول البطاقات البالغ عددها 150 في هذه المجموعة.
فتح الحزمة
k this deck
11
Line charts are best suited for representing data that follows some sequential order.
فتح الحزمة
افتح القفل للوصول البطاقات البالغ عددها 150 في هذه المجموعة.
فتح الحزمة
k this deck
12
Charts include individual elements that can be formatted,including the chart area,the chart title,the plot area,data markers,and a legend.
فتح الحزمة
افتح القفل للوصول البطاقات البالغ عددها 150 في هذه المجموعة.
فتح الحزمة
k this deck
13
You can rotate a 3-D chart along the x-axis,y-axis,and z-axis.
فتح الحزمة
افتح القفل للوصول البطاقات البالغ عددها 150 في هذه المجموعة.
فتح الحزمة
k this deck
14
If you cannot find the right chart to meet your needs,Excel allows you to create a custom chart based on the built-in chart types.
فتح الحزمة
افتح القفل للوصول البطاقات البالغ عددها 150 في هذه المجموعة.
فتح الحزمة
k this deck
15
To change a border color on a chart,click the Color button to open the color palette.
فتح الحزمة
افتح القفل للوصول البطاقات البالغ عددها 150 في هذه المجموعة.
فتح الحزمة
k this deck
16
Embedded charts can be moved and resized.
فتح الحزمة
افتح القفل للوصول البطاقات البالغ عددها 150 في هذه المجموعة.
فتح الحزمة
k this deck
17
When selecting a data source for a pie chart,select all rows and columns,including total rows and columns.
فتح الحزمة
افتح القفل للوصول البطاقات البالغ عددها 150 في هذه المجموعة.
فتح الحزمة
k this deck
18
Every chart must have a data source.
فتح الحزمة
افتح القفل للوصول البطاقات البالغ عددها 150 في هذه المجموعة.
فتح الحزمة
k this deck
19
Excel allows you to overlay a legend on a chart as a space-saving option.
فتح الحزمة
افتح القفل للوصول البطاقات البالغ عددها 150 في هذه المجموعة.
فتح الحزمة
k this deck
20
In Excel,charts do not remain linked or connected to their data sources if they appear in different worksheets.
فتح الحزمة
افتح القفل للوصول البطاقات البالغ عددها 150 في هذه المجموعة.
فتح الحزمة
k this deck
21
MATCHING
Identify the letter of the choice that best matches the phrase or definition.
a.Bubble
g.Doughnut
b.Column
h.Bar
c.XY
i.Surface
d.Line
j.Area
e.Radar
k.Stock
f.Pie
l.Scatter
Often used to show trends and changes over time
Identify the letter of the choice that best matches the phrase or definition.
a.Bubble
g.Doughnut
b.Column
h.Bar
c.XY
i.Surface
d.Line
j.Area
e.Radar
k.Stock
f.Pie
l.Scatter
Often used to show trends and changes over time
فتح الحزمة
افتح القفل للوصول البطاقات البالغ عددها 150 في هذه المجموعة.
فتح الحزمة
k this deck
22
By default,Excel inserts a chart as an embedded chart._________________________
فتح الحزمة
افتح القفل للوصول البطاقات البالغ عددها 150 في هذه المجموعة.
فتح الحزمة
k this deck
23
MATCHING
Identify the letter of the choice that best matches the phrase or definition.
a.Bubble
g.Doughnut
b.Column
h.Bar
c.XY
i.Surface
d.Line
j.Area
e.Radar
k.Stock
f.Pie
l.Scatter
Compares values from different categories.Areas under the lines contain a fill color
Identify the letter of the choice that best matches the phrase or definition.
a.Bubble
g.Doughnut
b.Column
h.Bar
c.XY
i.Surface
d.Line
j.Area
e.Radar
k.Stock
f.Pie
l.Scatter
Compares values from different categories.Areas under the lines contain a fill color
فتح الحزمة
افتح القفل للوصول البطاقات البالغ عددها 150 في هذه المجموعة.
فتح الحزمة
k this deck
24
MATCHING
Identify the letter of the choice that best matches the phrase or definition.
a.Bubble
g.Doughnut
b.Column
h.Bar
c.XY
i.Surface
d.Line
j.Area
e.Radar
k.Stock
f.Pie
l.Scatter
Compares values from different categories.A value is indicated by the length of the ____
Identify the letter of the choice that best matches the phrase or definition.
a.Bubble
g.Doughnut
b.Column
h.Bar
c.XY
i.Surface
d.Line
j.Area
e.Radar
k.Stock
f.Pie
l.Scatter
Compares values from different categories.A value is indicated by the length of the ____
فتح الحزمة
افتح القفل للوصول البطاقات البالغ عددها 150 في هذه المجموعة.
فتح الحزمة
k this deck
25
Because of the compactness of sparklines,you can specify only the line color and the line leader color._________________________
فتح الحزمة
افتح القفل للوصول البطاقات البالغ عددها 150 في هذه المجموعة.
فتح الحزمة
k this deck
26
The series name has only one data series._________________________
فتح الحزمة
افتح القفل للوصول البطاقات البالغ عددها 150 في هذه المجموعة.
فتح الحزمة
k this deck
27
When you create sparklines,clicking any cell in the data range selects all of the sparklines in the group._________________________
فتح الحزمة
افتح القفل للوصول البطاقات البالغ عددها 150 في هذه المجموعة.
فتح الحزمة
k this deck
28
After you select the data source,Excel determines the series name,series values,and category values based on the data source._________________________
فتح الحزمة
افتح القفل للوصول البطاقات البالغ عددها 150 في هذه المجموعة.
فتح الحزمة
k this deck
29
To explode a pie chart slice,select that slice and then drag it away from the pie._________________________
فتح الحزمة
افتح القفل للوصول البطاقات البالغ عددها 150 في هذه المجموعة.
فتح الحزمة
k this deck
30
To create a set of sparklines,you first select a data range containing the data you want to graph._________________________
فتح الحزمة
افتح القفل للوصول البطاقات البالغ عددها 150 في هذه المجموعة.
فتح الحزمة
k this deck
31
If you want to represent the following data: 20%,25%,15%,17%,and 23%,a pie chart will best highlight the differences among the close in value data._________________________
فتح الحزمة
افتح القفل للوصول البطاقات البالغ عددها 150 في هذه المجموعة.
فتح الحزمة
k this deck
32
To resize the chart,drag a sizing handle,which is a square or dot on the selection box that is used to change the object's width and height._________________________
فتح الحزمة
افتح القفل للوصول البطاقات البالغ عددها 150 في هذه المجموعة.
فتح الحزمة
k this deck
33
MATCHING
Identify the letter of the choice that best matches the phrase or definition.
a.Bubble
g.Doughnut
b.Column
h.Bar
c.XY
i.Surface
d.Line
j.Area
e.Radar
k.Stock
f.Pie
l.Scatter
Compares values from different categories.A value is indicated by the height of each ____.
Identify the letter of the choice that best matches the phrase or definition.
a.Bubble
g.Doughnut
b.Column
h.Bar
c.XY
i.Surface
d.Line
j.Area
e.Radar
k.Stock
f.Pie
l.Scatter
Compares values from different categories.A value is indicated by the height of each ____.
فتح الحزمة
افتح القفل للوصول البطاقات البالغ عددها 150 في هذه المجموعة.
فتح الحزمة
k this deck
34
The sparkline axis is simply a horizontal line that separates positive values from negative values._________________________
فتح الحزمة
افتح القفل للوصول البطاقات البالغ عددها 150 في هذه المجموعة.
فتح الحزمة
k this deck
35
Extreme viewing angles in a 3-D chart may elongate the chart and misrepresent the data._________________________
فتح الحزمة
افتح القفل للوصول البطاقات البالغ عددها 150 في هذه المجموعة.
فتح الحزمة
k this deck
36
MATCHING
Identify the letter of the choice that best matches the phrase or definition.
a.Bubble
g.Doughnut
b.Column
h.Bar
c.XY
i.Surface
d.Line
j.Area
e.Radar
k.Stock
f.Pie
l.Scatter
Compares relative values of different categories to the whole.A value is indicated by the area of a(n)____
Identify the letter of the choice that best matches the phrase or definition.
a.Bubble
g.Doughnut
b.Column
h.Bar
c.XY
i.Surface
d.Line
j.Area
e.Radar
k.Stock
f.Pie
l.Scatter
Compares relative values of different categories to the whole.A value is indicated by the area of a(n)____
فتح الحزمة
افتح القفل للوصول البطاقات البالغ عددها 150 في هذه المجموعة.
فتح الحزمة
k this deck
37
You can quickly change the appearance of the entire chart by selecting a different chart style in the Chart Design gallery._________________________
فتح الحزمة
افتح القفل للوصول البطاقات البالغ عددها 150 في هذه المجموعة.
فتح الحزمة
k this deck
38
Pie charts are most effective with ten or fewer slices._________________________
فتح الحزمة
افتح القفل للوصول البطاقات البالغ عددها 150 في هذه المجموعة.
فتح الحزمة
k this deck
39
In a pie chart,the largest piece of pie represents the data series with the smallest value._________________________
فتح الحزمة
افتح القفل للوصول البطاقات البالغ عددها 150 في هذه المجموعة.
فتح الحزمة
k this deck
40
A color bar is a conditional format that adds a horizontal bar to the background of a cell containing a numeric value._________________________
فتح الحزمة
افتح القفل للوصول البطاقات البالغ عددها 150 في هذه المجموعة.
فتح الحزمة
k this deck
41
The ____ is not a component of a data series.
A) series name
B) series value
C) category name
D) category value
A) series name
B) series value
C) category name
D) category value
فتح الحزمة
افتح القفل للوصول البطاقات البالغ عددها 150 في هذه المجموعة.
فتح الحزمة
k this deck
42
MATCHING
Identify the letter of the choice that best matches the phrase or definition.
a.Bubble
g.Doughnut
b.Column
h.Bar
c.XY
i.Surface
d.Line
j.Area
e.Radar
k.Stock
f.Pie
l.Scatter
Compares a collection of values from several different data sets
Identify the letter of the choice that best matches the phrase or definition.
a.Bubble
g.Doughnut
b.Column
h.Bar
c.XY
i.Surface
d.Line
j.Area
e.Radar
k.Stock
f.Pie
l.Scatter
Compares a collection of values from several different data sets
فتح الحزمة
افتح القفل للوصول البطاقات البالغ عددها 150 في هذه المجموعة.
فتح الحزمة
k this deck
43
MATCHING
Identify the letter of the choice that best matches the phrase or definition.
a.Bubble
g.Doughnut
b.Column
h.Bar
c.XY
i.Surface
d.Line
j.Area
e.Radar
k.Stock
f.Pie
l.Scatter
Similar to the pie chart except that it can display multiple sets of data
Identify the letter of the choice that best matches the phrase or definition.
a.Bubble
g.Doughnut
b.Column
h.Bar
c.XY
i.Surface
d.Line
j.Area
e.Radar
k.Stock
f.Pie
l.Scatter
Similar to the pie chart except that it can display multiple sets of data
فتح الحزمة
افتح القفل للوصول البطاقات البالغ عددها 150 في هذه المجموعة.
فتح الحزمة
k this deck
44
The ____ Chart Tools contextual tabs appear on the Ribbon when you select a chart.
A) Insert,Layout,and Design
B) Design,Layout,and Format
C) Insert,Design,and Format
D) Format,Print,and Layout
A) Insert,Layout,and Design
B) Design,Layout,and Format
C) Insert,Design,and Format
D) Format,Print,and Layout
فتح الحزمة
افتح القفل للوصول البطاقات البالغ عددها 150 في هذه المجموعة.
فتح الحزمة
k this deck
45
To move or resize an embedded chart,____.
A) select the chart and drag the selection box
B) drag the sizing handle on the selection box
C) select the chart and press Tab
D) both a and b
A) select the chart and drag the selection box
B) drag the sizing handle on the selection box
C) select the chart and press Tab
D) both a and b
فتح الحزمة
افتح القفل للوصول البطاقات البالغ عددها 150 في هذه المجموعة.
فتح الحزمة
k this deck
46
The ____ dialog box provides options for moving charts between worksheets and chart sheets.
A) Insert New
B) Tab
C) Move Chart
D) Change Chart
A) Insert New
B) Tab
C) Move Chart
D) Change Chart
فتح الحزمة
افتح القفل للوصول البطاقات البالغ عددها 150 في هذه المجموعة.
فتح الحزمة
k this deck
47
MATCHING
Identify the letter of the choice that best matches the phrase or definition.
a.Bubble
g.Doughnut
b.Column
h.Bar
c.XY
i.Surface
d.Line
j.Area
e.Radar
k.Stock
f.Pie
l.Scatter
Displays stock market data
Identify the letter of the choice that best matches the phrase or definition.
a.Bubble
g.Doughnut
b.Column
h.Bar
c.XY
i.Surface
d.Line
j.Area
e.Radar
k.Stock
f.Pie
l.Scatter
Displays stock market data
فتح الحزمة
افتح القفل للوصول البطاقات البالغ عددها 150 في هذه المجموعة.
فتح الحزمة
k this deck
48
MATCHING
Identify the letter of the choice that best matches the phrase or definition.
a.Bubble
g.Doughnut
b.Column
h.Bar
c.XY
i.Surface
d.Line
j.Area
e.Radar
k.Stock
f.Pie
l.Scatter
Similar to the Scatter chart except the size of the data marker is determined by a third value
Identify the letter of the choice that best matches the phrase or definition.
a.Bubble
g.Doughnut
b.Column
h.Bar
c.XY
i.Surface
d.Line
j.Area
e.Radar
k.Stock
f.Pie
l.Scatter
Similar to the Scatter chart except the size of the data marker is determined by a third value
فتح الحزمة
افتح القفل للوصول البطاقات البالغ عددها 150 في هذه المجموعة.
فتح الحزمة
k this deck
49
To work with a title or other individual element of a chart,select the ____ tab.
A) Design
B) Layout
C) Format
D) Print
A) Design
B) Layout
C) Format
D) Print
فتح الحزمة
افتح القفل للوصول البطاقات البالغ عددها 150 في هذه المجموعة.
فتح الحزمة
k this deck
50
MATCHING
Identify the letter of the choice that best matches the phrase or definition.
a.Bubble
g.Doughnut
b.Column
h.Bar
c.XY
i.Surface
d.Line
j.Area
e.Radar
k.Stock
f.Pie
l.Scatter
Shows patterns or relationship between two or more sets of values.Often used in scientific studies and statistical analyses.
Identify the letter of the choice that best matches the phrase or definition.
a.Bubble
g.Doughnut
b.Column
h.Bar
c.XY
i.Surface
d.Line
j.Area
e.Radar
k.Stock
f.Pie
l.Scatter
Shows patterns or relationship between two or more sets of values.Often used in scientific studies and statistical analyses.
فتح الحزمة
افتح القفل للوصول البطاقات البالغ عددها 150 في هذه المجموعة.
فتح الحزمة
k this deck
51
Placing a chart in a ____ displays only the chart and no worksheet cells.
A) new worksheet
B) tabbed view
C) graph display
D) chart sheet
A) new worksheet
B) tabbed view
C) graph display
D) chart sheet
فتح الحزمة
افتح القفل للوصول البطاقات البالغ عددها 150 في هذه المجموعة.
فتح الحزمة
k this deck
52
MATCHING
Identify the letter of the choice that best matches the phrase or definition.
a.Bubble
g.Doughnut
b.Column
h.Bar
c.XY
i.Surface
d.Line
j.Area
e.Radar
k.Stock
f.Pie
l.Scatter
Another term for Scatter chart
Identify the letter of the choice that best matches the phrase or definition.
a.Bubble
g.Doughnut
b.Column
h.Bar
c.XY
i.Surface
d.Line
j.Area
e.Radar
k.Stock
f.Pie
l.Scatter
Another term for Scatter chart
فتح الحزمة
افتح القفل للوصول البطاقات البالغ عددها 150 في هذه المجموعة.
فتح الحزمة
k this deck
53
The words Information,Services,an Manufacturing shown in Column A are the ____.
A) data series
B) data source
C) series value
D) series source
A) data series
B) data source
C) series value
D) series source
فتح الحزمة
افتح القفل للوصول البطاقات البالغ عددها 150 في هذه المجموعة.
فتح الحزمة
k this deck
54
Referring to the figure above,an example of a ____ name is row 9.
A) data series
B) series name
C) data label
D) series label
فتح الحزمة
افتح القفل للوصول البطاقات البالغ عددها 150 في هذه المجموعة.
فتح الحزمة
k this deck
55
The columns and pie slices in the charts above are ____.
A) data markers
B) chart areas
C) major tick marks
D) minor tick marks
فتح الحزمة
افتح القفل للوصول البطاقات البالغ عددها 150 في هذه المجموعة.
فتح الحزمة
k this deck
56
Referring to the figure above,if you were to create a Fund Assets pie chart using the information in A1:B7,the data source for that chart would be ____.
A) A2:A6
B) B2:B6
C) A1:B5
D) A2:B6
فتح الحزمة
افتح القفل للوصول البطاقات البالغ عددها 150 في هذه المجموعة.
فتح الحزمة
k this deck
57
Excel supports the following three types of sparklines that does NOT include ____.
A) A win/loss sparkline for highlighting positive and negative values
B) A column sparkline used for column charts
C) A line sparkline for highlighting trends
D) a true/false sparkline for helping make decisions
A) A win/loss sparkline for highlighting positive and negative values
B) A column sparkline used for column charts
C) A line sparkline for highlighting trends
D) a true/false sparkline for helping make decisions
فتح الحزمة
افتح القفل للوصول البطاقات البالغ عددها 150 في هذه المجموعة.
فتح الحزمة
k this deck
58
For which of the following reasons would you choose to use a chart or graph?
A) To organize information in columns and rows
B) To show trends or relationships across data
C) To present data using text only
D) To add color to a report
A) To organize information in columns and rows
B) To show trends or relationships across data
C) To present data using text only
D) To add color to a report
فتح الحزمة
افتح القفل للوصول البطاقات البالغ عددها 150 في هذه المجموعة.
فتح الحزمة
k this deck
59
The ____ is the only one of the following charts to compare relative values from different categories to the whole.
A) pie
B) column
C) line
D) area
A) pie
B) column
C) line
D) area
فتح الحزمة
افتح القفل للوصول البطاقات البالغ عددها 150 في هذه المجموعة.
فتح الحزمة
k this deck
60
MATCHING
Identify the letter of the choice that best matches the phrase or definition.
a.Bubble
g.Doughnut
b.Column
h.Bar
c.XY
i.Surface
d.Line
j.Area
e.Radar
k.Stock
f.Pie
l.Scatter
Compares three sets of values in a three-dimensional chart
Identify the letter of the choice that best matches the phrase or definition.
a.Bubble
g.Doughnut
b.Column
h.Bar
c.XY
i.Surface
d.Line
j.Area
e.Radar
k.Stock
f.Pie
l.Scatter
Compares three sets of values in a three-dimensional chart
فتح الحزمة
افتح القفل للوصول البطاقات البالغ عددها 150 في هذه المجموعة.
فتح الحزمة
k this deck
61
A 90° ____ value exaggerates the 3-D effect,making distant objects appear very small.
A) angle
B) perspective
C) photo
D) rotation
A) angle
B) perspective
C) photo
D) rotation
فتح الحزمة
افتح القفل للوصول البطاقات البالغ عددها 150 في هذه المجموعة.
فتح الحزمة
k this deck
62
In the above figure,the data markers shown in the cells in the column labeled "Percentages," are ____.
A) data lines
B) sparklines
C) data bars
D) spark bars
فتح الحزمة
افتح القفل للوصول البطاقات البالغ عددها 150 في هذه المجموعة.
فتح الحزمة
k this deck
63
You can use the 3-D Format options to add drop shadows,raised or beveled corners,and textured surfaces that give the illusion of ____ reflecting off the chart elements.
A) light
B) color
C) water
D) shadows
A) light
B) color
C) water
D) shadows
فتح الحزمة
افتح القفل للوصول البطاقات البالغ عددها 150 في هذه المجموعة.
فتح الحزمة
k this deck
64
In the figure above,the value axis entries on the "Fund History" chart,are displayed with the ____ unit.
A) tens
B) hundreds
C) thousands
D) millions
A) tens
B) hundreds
C) thousands
D) millions
فتح الحزمة
افتح القفل للوصول البطاقات البالغ عددها 150 في هذه المجموعة.
فتح الحزمة
k this deck
65
____provide descriptive text for the individual data markers,such as pie slices
A) Asset labels
B) Legend values
C) Data labels
D) Leader lines
A) Asset labels
B) Legend values
C) Data labels
D) Leader lines
فتح الحزمة
افتح القفل للوصول البطاقات البالغ عددها 150 في هذه المجموعة.
فتح الحزمة
k this deck
66
Depending on the pie chart layout you choose,you can ____.
A) hide or display the chart title
B) display a chart legend
C) add percentages to pie slices
D) all of the above
فتح الحزمة
افتح القفل للوصول البطاقات البالغ عددها 150 في هذه المجموعة.
فتح الحزمة
k this deck
67
The Label Position option in the Format Data Labels dialog box includes ____.
A) Center
B) Inside End
C) Outside End
D) all of the above
A) Center
B) Inside End
C) Outside End
D) all of the above
فتح الحزمة
افتح القفل للوصول البطاقات البالغ عددها 150 في هذه المجموعة.
فتح الحزمة
k this deck
68
To reposition the legend to the left-hand side of a chart,click the Legend button,and then click ____.
A) Reposition Legend
B) Show Legend at Left
C) Move Legend
D) Adjust Legend
A) Reposition Legend
B) Show Legend at Left
C) Move Legend
D) Adjust Legend
فتح الحزمة
افتح القفل للوصول البطاقات البالغ عددها 150 في هذه المجموعة.
فتح الحزمة
k this deck
69
Referring to the figure above,the entry 54.94%,shown next to the largest pie slice,is a ____.
A) data label
B) chart key
C) legend
D) series value
فتح الحزمة
افتح القفل للوصول البطاقات البالغ عددها 150 في هذه المجموعة.
فتح الحزمة
k this deck
70
____ is not an available formatting category for legends.
A) Border Color
B) Border Styles
C) Shadow
D) Shading
A) Border Color
B) Border Styles
C) Shadow
D) Shading
فتح الحزمة
افتح القفل للوصول البطاقات البالغ عددها 150 في هذه المجموعة.
فتح الحزمة
k this deck
71
Referring to the figure above,the chart title for the pie chart is ____.
A) Fund Assets
B) Sector Percentages
C) 54.94%
D) Cash
فتح الحزمة
افتح القفل للوصول البطاقات البالغ عددها 150 في هذه المجموعة.
فتح الحزمة
k this deck
72
Referring to the figure above,the rectangular area to the right of the pie chart (listing Cash,U.S.Stocks,Non-U.S.Stocks,and Bonds)is the ____.
A) perspective
B) plot area
C) legend
D) data marker
فتح الحزمة
افتح القفل للوصول البطاقات البالغ عددها 150 في هذه المجموعة.
فتح الحزمة
k this deck
73
Referring to the figure above,in the column chart,the values along the left side (0.00%,5.00%,etc. )are ____.
A) plot markers
B) plot marks
C) data markers
D) tick marks
فتح الحزمة
افتح القفل للوصول البطاقات البالغ عددها 150 في هذه المجموعة.
فتح الحزمة
k this deck
74
The ____,shown in the figure above,include data markers to indicate the high and low points.
A) data bars
B) sparklines
C) lines
D) bars
A) data bars
B) sparklines
C) lines
D) bars
فتح الحزمة
افتح القفل للوصول البطاقات البالغ عددها 150 في هذه المجموعة.
فتح الحزمة
k this deck
75
If you do not want a chart to reflect new values in the data source,you should ____.
A) not create a chart
B) change the default settings
C) paste the chart as a Picture
D) create the chart in Microsoft Word
A) not create a chart
B) change the default settings
C) paste the chart as a Picture
D) create the chart in Microsoft Word
فتح الحزمة
افتح القفل للوصول البطاقات البالغ عددها 150 في هذه المجموعة.
فتح الحزمة
k this deck
76
To display a large number of categories whose values are close to one another,you should create a ____ chart.
A) column
B) bar
C) pie
D) either a.or b.
A) column
B) bar
C) pie
D) either a.or b.
فتح الحزمة
افتح القفل للوصول البطاقات البالغ عددها 150 في هذه المجموعة.
فتح الحزمة
k this deck
77
Since each slice of a pie represents a different value in the series,you ____.
A) must format each slice separately
B) can format the entire data series
C) can format multiple slices at once
D) cannot format any single slice
A) must format each slice separately
B) can format the entire data series
C) can format multiple slices at once
D) cannot format any single slice
فتح الحزمة
افتح القفل للوصول البطاقات البالغ عددها 150 في هذه المجموعة.
فتح الحزمة
k this deck
78
In the above figure,the data markers shown in the cells in the column labeled "Performance," are ____.
A) data lines
B) sparklines
C) data bars
D) spark bars
فتح الحزمة
افتح القفل للوصول البطاقات البالغ عددها 150 في هذه المجموعة.
فتح الحزمة
k this deck
79
To move one slice of a pie chart away from the pie creates a(n)____.
A) spontaneous pie chart
B) perfect pie chart
C) exploded pie chart
D) exponential pie chart
A) spontaneous pie chart
B) perfect pie chart
C) exploded pie chart
D) exponential pie chart
فتح الحزمة
افتح القفل للوصول البطاقات البالغ عددها 150 في هذه المجموعة.
فتح الحزمة
k this deck
80
You already created a line chart,but now decide that you want to change this chart to a pie chart.To do this,you click ____ from the Type group in the Chart Tools Design tab.
A) Change Chart Type
B) New Chart
C) Alter Existing Chart
D) Modify Chart
A) Change Chart Type
B) New Chart
C) Alter Existing Chart
D) Modify Chart
فتح الحزمة
افتح القفل للوصول البطاقات البالغ عددها 150 في هذه المجموعة.
فتح الحزمة
k this deck
فتح الحزمة
افتح القفل للوصول البطاقات البالغ عددها 150 في هذه المجموعة.


