Deck 12: Regression and Correlation
ملء الشاشة (f)
سؤال
سؤال
سؤال
سؤال
سؤال
سؤال
سؤال
سؤال
سؤال
سؤال
سؤال
سؤال
سؤال
سؤال
سؤال
سؤال
سؤال
سؤال
سؤال
سؤال
سؤال
سؤال
سؤال
سؤال
The following data on fertility rates were obtained from Eurostat on seven European countries in 2006.Considering the total fertility rate as your dependent variable,construct a scatter diagram and plot the seven observations in the table.

سؤال
سؤال
سؤال
سؤال
سؤال
An  near zero indicates either poor fit or a well-fitting line with slope zero.
near zero indicates either poor fit or a well-fitting line with slope zero. سؤال
سؤال
Residual sum of squares, 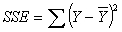 .
.
. سؤال
سؤال
سؤال
سؤال
The following data on fertility rates were obtained from Eurostat on seven European countries in 2006.Suppose you obtain the following equation which predicts the total fertility rate using information on the mean age of childbearing: Y = 9.34 - 0.25x.What is the predicted total fertility rate for a country with a mean age at childbearing of 31.5 years? Why would it be inappropriate to predict,say,the TFR for a country with a mean age at childbearing of 22.7 years?

سؤال
The following data were obtained from a sample of 12 respondents.Suppose that we started by calculating a bivariate regression equation which predicted children's education using information on fathers' education.Suppose further that we then calculated a multiple regression equation which predicted children's education using information on both fathers' education and mothers' education.What would you expect to happen to the sum of squares regression in the multiple regression equation relative to the sum of squares regression in the bivariate linear regression equation? Does it increase or decrease in value? Why?

سؤال
The following data on fertility rates were obtained from Eurostat on seven European countries in 2006.The covariance between the mean age at childbearing and the total fertility rate is -0.06.Using this information and the information provided in the table below,calculate the value of Pearson's correlation coefficient.

سؤال
The following data were obtained from a sample of 12 respondents.In reviewing the above data,imagine that you first decide to calculate Pearson's correlation coefficient for the relationship between the highest grade of school completed for respondents and their fathers.If the covariance between respondents' and fathers' education is 3.23,what is the value of Pearson's correlation coefficient?

سؤال
The residual is the difference between the predicted  and the observed Y,i.e.
  .
.
and the observed Y,i.e. . سؤال
سؤال
سؤال
سؤال
The following data on fertility rates were obtained from Eurostat on seven European countries in 2006.What is direction of the relationship between the mean age at childbearing and the total fertility rate? Which single country appears to be the exception?

سؤال
سؤال
The following data were obtained from a sample of 12 respondents.Approximately what percent of the variation in respondents' highest grade of schooling completed does fathers' highest grade of schooling explain?

سؤال
سؤال
The following data on fertility rates were obtained from Eurostat on seven European countries in 2006.The covariance between the mean age at childbearing and the total fertility rate is -0.06.Using this information and the information provided in the table below,calculate the Y-intercept and the slope and write down the linear regression equation which summarizes the relationship between these two variables.

سؤال
The following data were obtained from a sample of 12 respondents.With respondents' highest grade of schooling completed as your dependent variable and fathers' highest grade of schooling completed as your independent variable,calculate the Y-intercept and the slope and write down the linear regression equation which summarizes the relationship between these two variables.

سؤال
The following data were obtained from a sample of 12 respondents.Suppose you arrive at the following multiple regression equation which predicts child's schooling from both father and mother's schooling:
Ŷ= 8.91 + .51(Father's Schooling)- .10(Mother's Schooling).
What is the predicted number of years of schooling for a respondent whose father and mother graduated from college (i.e.,each completed 16 years of schooling)?

Ŷ= 8.91 + .51(Father's Schooling)- .10(Mother's Schooling).
What is the predicted number of years of schooling for a respondent whose father and mother graduated from college (i.e.,each completed 16 years of schooling)?
سؤال
The covariance between the mean age at childbearing and the total fertility rate is -0.06.How much predictive power does the mean age at childbearing have in predicting the total fertility rate? Calculate the coefficient of determination and interpret this quantity.


فتح الحزمة
قم بالتسجيل لفتح البطاقات في هذه المجموعة!
Unlock Deck
Unlock Deck
1/50
العب
ملء الشاشة (f)
Deck 12: Regression and Correlation
1
A residual is defined as the
A)difference between the observed Y and the predicted Y.
B)difference between two observed Y values in the data.
C)absolute values of observed Y and the observed X.
D)absolute value of the observed Y.
A)difference between the observed Y and the predicted Y.
B)difference between two observed Y values in the data.
C)absolute values of observed Y and the observed X.
D)absolute value of the observed Y.
difference between the observed Y and the predicted Y.
2
Which of the following would be the least squares (best fitting)line?
A)The residual sum of squares is closest to zero.
B)r is equal to zero.
C)The residual sum of squares is closest to one.
D)The variance of y is large.
A)The residual sum of squares is closest to zero.
B)r is equal to zero.
C)The residual sum of squares is closest to one.
D)The variance of y is large.
The residual sum of squares is closest to zero.
3
The best fitting line is one where the
A)intercept of the regression equation,a,is closest to zero.
B)slope of the regression equation,b,is closest to zero.
C)residual sum of squares is closest to zero.
D)variance of Y is large.
A)intercept of the regression equation,a,is closest to zero.
B)slope of the regression equation,b,is closest to zero.
C)residual sum of squares is closest to zero.
D)variance of Y is large.
residual sum of squares is closest to zero.
4
The coefficient of determination is symbolized by
A)r.
B)r².
C)a.
D)b.
A)r.
B)r².
C)a.
D)b.
فتح الحزمة
افتح القفل للوصول البطاقات البالغ عددها 50 في هذه المجموعة.
فتح الحزمة
k this deck
5
What is the total sum of squares?
A)The sum of the squared deviations from the mean
B)The sum of the squared deviations from the regression line
C)The difference between the sum of the squared deviations from the mean and the sum of the squared deviations from the regression line
D)The effect of two or more variables on the independent variable
فتح الحزمة
افتح القفل للوصول البطاقات البالغ عددها 50 في هذه المجموعة.
فتح الحزمة
k this deck
6
What does the quantity r refer to?
A)Pearson's correlation coefficient
B)Coefficient of determination
C)Covariance
D)Residual sum of squares
A)Pearson's correlation coefficient
B)Coefficient of determination
C)Covariance
D)Residual sum of squares
فتح الحزمة
افتح القفل للوصول البطاقات البالغ عددها 50 في هذه المجموعة.
فتح الحزمة
k this deck
7
Assume that a local company pays its employees 25 cents more per hour for each college credit earned during a given year.Consider two employees,one earning $10 per hour and having earned zero college credits and one earning $12 per hour and having earned eight college credits.What is the Y-intercept of the linear regression prediction equation?
A)2
B)8
C)10
D)12
A)2
B)8
C)10
D)12
فتح الحزمة
افتح القفل للوصول البطاقات البالغ عددها 50 في هذه المجموعة.
فتح الحزمة
k this deck
8
What is the regression sum of squares?
A)The sum of the squared deviations from the mean
B)The sum of the squared deviations from the regression line
C)The difference between the sum of the squared deviations from the mean and the sum of the squared deviations from the regression line
D)The effect of two or more variables on the independent variable
فتح الحزمة
افتح القفل للوصول البطاقات البالغ عددها 50 في هذه المجموعة.
فتح الحزمة
k this deck
9
Which type of relationship occurs when all observations fall along a straight line?
A)Deterministic linear relationship
B)Scatter plot relationship
C)Vertical relationship
D)Linear relationship
A)Deterministic linear relationship
B)Scatter plot relationship
C)Vertical relationship
D)Linear relationship
فتح الحزمة
افتح القفل للوصول البطاقات البالغ عددها 50 في هذه المجموعة.
فتح الحزمة
k this deck
10
A scatter diagram is a(n)______ step in exploring a relationship between two variables.
A)finite
B)absolute
C)preliminary
D)definitive
A)finite
B)absolute
C)preliminary
D)definitive
فتح الحزمة
افتح القفل للوصول البطاقات البالغ عددها 50 في هذه المجموعة.
فتح الحزمة
k this deck
11
Which of the following is the equation for all straight-line graphs?
A)Y = a + b (x)
B)e = Y - Ŷ
C)Ʃ (ӯ - Ŷ)
D)Ŷ = a (b)
A)Y = a + b (x)
B)e = Y - Ŷ
C)Ʃ (ӯ - Ŷ)
D)Ŷ = a (b)
فتح الحزمة
افتح القفل للوصول البطاقات البالغ عددها 50 في هذه المجموعة.
فتح الحزمة
k this deck
12
In a linear equation,the value of Y when X is 0 is called the
A)slope.
B)Y-intercept.
C)best fit.
D)directional.
A)slope.
B)Y-intercept.
C)best fit.
D)directional.
فتح الحزمة
افتح القفل للوصول البطاقات البالغ عددها 50 في هذه المجموعة.
فتح الحزمة
k this deck
13
What is the slope of the linear regression prediction equation if a person with 12 years of schooling earns $31,000 per year and a person with 13 years of schooling earns $32,500 per year?
A)1
B)12
C)13
D)1,500
A)1
B)12
C)13
D)1,500
فتح الحزمة
افتح القفل للوصول البطاقات البالغ عددها 50 في هذه المجموعة.
فتح الحزمة
k this deck
14
Consider the following linear regression prediction equation: Y = 12 + -1x.What is the direction of the relationship between these two variables?
A)The relationship between the observed X and the predicted Y is negative.
B)The relationship between the observed X and the predicted Y is positive.
C)There is no relationship between the observed X and the predicated Y.
D)There is a weak relationship between the observed X and the predicted Y with no direction..
فتح الحزمة
افتح القفل للوصول البطاقات البالغ عددها 50 في هذه المجموعة.
فتح الحزمة
k this deck
15
Consider the following linear regression prediction equation: Y = 12 + -1x.What is the direction of the relationship between these two variables?
A)Positive relationship
B)Negative relationship
C)No relationship
D)Neutral relationship
A)Positive relationship
B)Negative relationship
C)No relationship
D)Neutral relationship
فتح الحزمة
افتح القفل للوصول البطاقات البالغ عددها 50 في هذه المجموعة.
فتح الحزمة
k this deck
16
Which three quantities are needed in order to calculate the value of the Y-intercept for the linear regression prediction equation?
A)The slope,the mean of X,and the total number of observations in the data
B)The slope,the mean of Y,and the total number of observations in the data
C)The mean of X,the mean of Y,and the total number of observations in the data
D)The mean of X,the mean of Y,and the slope
A)The slope,the mean of X,and the total number of observations in the data
B)The slope,the mean of Y,and the total number of observations in the data
C)The mean of X,the mean of Y,and the total number of observations in the data
D)The mean of X,the mean of Y,and the slope
فتح الحزمة
افتح القفل للوصول البطاقات البالغ عددها 50 في هذه المجموعة.
فتح الحزمة
k this deck
17
How many independent variables are involved in a multiple regression equation?
A)One
B)Zero
C)Two or more
D)At least three
A)One
B)Zero
C)Two or more
D)At least three
فتح الحزمة
افتح القفل للوصول البطاقات البالغ عددها 50 في هذه المجموعة.
فتح الحزمة
k this deck
18
What is the residual sum of squares?
A)The sum of the squared deviations from the mean
B)The sum of the squared deviations from the regression line
C)The difference between the sum of the squared deviations from the mean and the sum of the squared deviations from the regression line
D)The effect of two or more variables on the independent variable
فتح الحزمة
افتح القفل للوصول البطاقات البالغ عددها 50 في هذه المجموعة.
فتح الحزمة
k this deck
19
A scatter diagram is a visual method used to display a relationship between two ______ variables.
A)nominal
B)unrelated
C)interval-ratio
D)ordinal
A)nominal
B)unrelated
C)interval-ratio
D)ordinal
فتح الحزمة
افتح القفل للوصول البطاقات البالغ عددها 50 في هذه المجموعة.
فتح الحزمة
k this deck
20
What is the interpretation for the slope of the linear regression prediction equation?
A)The value of Y when X = 0
B)The value of X when Y = 0
C)The change in Y with a unit change in X
D)The change in X with a unit change in Y
A)The value of Y when X = 0
B)The value of X when Y = 0
C)The change in Y with a unit change in X
D)The change in X with a unit change in Y
فتح الحزمة
افتح القفل للوصول البطاقات البالغ عددها 50 في هذه المجموعة.
فتح الحزمة
k this deck
21
SELECT ALL THAT APPLY.Covariance
A)measures the linear relationship between two variables.
B)reflects both strength and direction of the relationship.
C)will be close to zero if the variables are closely related.
D)will be negative if the relationship is unrelated.
A)measures the linear relationship between two variables.
B)reflects both strength and direction of the relationship.
C)will be close to zero if the variables are closely related.
D)will be negative if the relationship is unrelated.
فتح الحزمة
افتح القفل للوصول البطاقات البالغ عددها 50 في هذه المجموعة.
فتح الحزمة
k this deck
22
SELECT ALL THAT APPLY.A linear relationship
A)approximates the observations displayed in a scatter diagram with a straight line.
B)is termed deterministic if some observations fall along a straight line.
C)is termed perfectly linear relationship if all the observations fall along a straight line.
D)is a relationship between two interval-ratio variables.
فتح الحزمة
افتح القفل للوصول البطاقات البالغ عددها 50 في هذه المجموعة.
فتح الحزمة
k this deck
23
Consider the following linear regression prediction equation: Y = 12 + -1x.If the predicted value of Y for an observation is 5,calculate the residual for an observation where the observed value of Y is equal to 9.
فتح الحزمة
افتح القفل للوصول البطاقات البالغ عددها 50 في هذه المجموعة.
فتح الحزمة
k this deck
24
The following data on fertility rates were obtained from Eurostat on seven European countries in 2006.Considering the total fertility rate as your dependent variable,construct a scatter diagram and plot the seven observations in the table.
فتح الحزمة
افتح القفل للوصول البطاقات البالغ عددها 50 في هذه المجموعة.
فتح الحزمة
k this deck
25
SELECT ALL THAT APPLY.Regression
A)examines relationship between ordinal variables.
B)is a linear prediction model.
C)is bivariate if it involves one independent and one dependent variable.
D)is multiple if it involves two or more independent and one dependent variable.
A)examines relationship between ordinal variables.
B)is a linear prediction model.
C)is bivariate if it involves one independent and one dependent variable.
D)is multiple if it involves two or more independent and one dependent variable.
فتح الحزمة
افتح القفل للوصول البطاقات البالغ عددها 50 في هذه المجموعة.
فتح الحزمة
k this deck
26
The least-square method is a technique that chooses a and b such that the residual sum of squares is the least.
فتح الحزمة
افتح القفل للوصول البطاقات البالغ عددها 50 في هذه المجموعة.
فتح الحزمة
k this deck
27
SELECT ALL THAT APPLY.In the linear regression equation Y = a + b (X)
A)X = the score of the independent variable
B)a = the Y-intercept
C)b = the slope of the regression line
D)Y = the observed score of the dependent variable
A)X = the score of the independent variable
B)a = the Y-intercept
C)b = the slope of the regression line
D)Y = the observed score of the dependent variable
فتح الحزمة
افتح القفل للوصول البطاقات البالغ عددها 50 في هذه المجموعة.
فتح الحزمة
k this deck
28
Consider the following linear regression prediction equation: Y = 12 + -1x.If x = 7.What is the predicted value of Y for this observation?
فتح الحزمة
افتح القفل للوصول البطاقات البالغ عددها 50 في هذه المجموعة.
فتح الحزمة
k this deck
29
An near zero indicates either poor fit or a well-fitting line with slope zero.
near zero indicates either poor fit or a well-fitting line with slope zero. فتح الحزمة
افتح القفل للوصول البطاقات البالغ عددها 50 في هذه المجموعة.
فتح الحزمة
k this deck
30
The coefficient of determination,r²,is a PRE measure.What does this mean?
فتح الحزمة
افتح القفل للوصول البطاقات البالغ عددها 50 في هذه المجموعة.
فتح الحزمة
k this deck
31
Residual sum of squares, .
. فتح الحزمة
افتح القفل للوصول البطاقات البالغ عددها 50 في هذه المجموعة.
فتح الحزمة
k this deck
32
A negative slope implies the relationship between the variables is a negative one and hence covariance will also be negative.
فتح الحزمة
افتح القفل للوصول البطاقات البالغ عددها 50 في هذه المجموعة.
فتح الحزمة
k this deck
33
A bivariate regression assumes that the variables have a linear or straight-line relationship.
فتح الحزمة
افتح القفل للوصول البطاقات البالغ عددها 50 في هذه المجموعة.
فتح الحزمة
k this deck
34
Calculate the Y-intercept,a,of the regression equation using the following information:
Mean number of years of schooling: 17
Mean monthly income: $2,750
Slope,b,of the regression equation: $650
Mean number of years of schooling: 17
Mean monthly income: $2,750
Slope,b,of the regression equation: $650
فتح الحزمة
افتح القفل للوصول البطاقات البالغ عددها 50 في هذه المجموعة.
فتح الحزمة
k this deck
35
The following data on fertility rates were obtained from Eurostat on seven European countries in 2006.Suppose you obtain the following equation which predicts the total fertility rate using information on the mean age of childbearing: Y = 9.34 - 0.25x.What is the predicted total fertility rate for a country with a mean age at childbearing of 31.5 years? Why would it be inappropriate to predict,say,the TFR for a country with a mean age at childbearing of 22.7 years?
فتح الحزمة
افتح القفل للوصول البطاقات البالغ عددها 50 في هذه المجموعة.
فتح الحزمة
k this deck
36
The following data were obtained from a sample of 12 respondents.Suppose that we started by calculating a bivariate regression equation which predicted children's education using information on fathers' education.Suppose further that we then calculated a multiple regression equation which predicted children's education using information on both fathers' education and mothers' education.What would you expect to happen to the sum of squares regression in the multiple regression equation relative to the sum of squares regression in the bivariate linear regression equation? Does it increase or decrease in value? Why?
فتح الحزمة
افتح القفل للوصول البطاقات البالغ عددها 50 في هذه المجموعة.
فتح الحزمة
k this deck
37
The following data on fertility rates were obtained from Eurostat on seven European countries in 2006.The covariance between the mean age at childbearing and the total fertility rate is -0.06.Using this information and the information provided in the table below,calculate the value of Pearson's correlation coefficient.
فتح الحزمة
افتح القفل للوصول البطاقات البالغ عددها 50 في هذه المجموعة.
فتح الحزمة
k this deck
38
The following data were obtained from a sample of 12 respondents.In reviewing the above data,imagine that you first decide to calculate Pearson's correlation coefficient for the relationship between the highest grade of school completed for respondents and their fathers.If the covariance between respondents' and fathers' education is 3.23,what is the value of Pearson's correlation coefficient?
فتح الحزمة
افتح القفل للوصول البطاقات البالغ عددها 50 في هذه المجموعة.
فتح الحزمة
k this deck
39
The residual is the difference between the predicted and the observed Y,i.e. .
and the observed Y,i.e. . فتح الحزمة
افتح القفل للوصول البطاقات البالغ عددها 50 في هذه المجموعة.
فتح الحزمة
k this deck
40
Calculate the sum of squares regression using the following information:
Sum of squares total: 2340
Sum of squares residual: 1496
Sum of squares total: 2340
Sum of squares residual: 1496
فتح الحزمة
افتح القفل للوصول البطاقات البالغ عددها 50 في هذه المجموعة.
فتح الحزمة
k this deck
41
What is the difference between slope and partial slopes?
فتح الحزمة
افتح القفل للوصول البطاقات البالغ عددها 50 في هذه المجموعة.
فتح الحزمة
k this deck
42
What role does the coefficient of determination play in regression?
فتح الحزمة
افتح القفل للوصول البطاقات البالغ عددها 50 في هذه المجموعة.
فتح الحزمة
k this deck
43
The following data on fertility rates were obtained from Eurostat on seven European countries in 2006.What is direction of the relationship between the mean age at childbearing and the total fertility rate? Which single country appears to be the exception?
فتح الحزمة
افتح القفل للوصول البطاقات البالغ عددها 50 في هذه المجموعة.
فتح الحزمة
k this deck
44
Compare ANOVA and regression.
فتح الحزمة
افتح القفل للوصول البطاقات البالغ عددها 50 في هذه المجموعة.
فتح الحزمة
k this deck
45
The following data were obtained from a sample of 12 respondents.Approximately what percent of the variation in respondents' highest grade of schooling completed does fathers' highest grade of schooling explain?
فتح الحزمة
افتح القفل للوصول البطاقات البالغ عددها 50 في هذه المجموعة.
فتح الحزمة
k this deck
46
Define Covariance (X,Y).
فتح الحزمة
افتح القفل للوصول البطاقات البالغ عددها 50 في هذه المجموعة.
فتح الحزمة
k this deck
47
The following data on fertility rates were obtained from Eurostat on seven European countries in 2006.The covariance between the mean age at childbearing and the total fertility rate is -0.06.Using this information and the information provided in the table below,calculate the Y-intercept and the slope and write down the linear regression equation which summarizes the relationship between these two variables.
فتح الحزمة
افتح القفل للوصول البطاقات البالغ عددها 50 في هذه المجموعة.
فتح الحزمة
k this deck
48
The following data were obtained from a sample of 12 respondents.With respondents' highest grade of schooling completed as your dependent variable and fathers' highest grade of schooling completed as your independent variable,calculate the Y-intercept and the slope and write down the linear regression equation which summarizes the relationship between these two variables.
فتح الحزمة
افتح القفل للوصول البطاقات البالغ عددها 50 في هذه المجموعة.
فتح الحزمة
k this deck
49
The following data were obtained from a sample of 12 respondents.Suppose you arrive at the following multiple regression equation which predicts child's schooling from both father and mother's schooling:
Ŷ= 8.91 + .51(Father's Schooling)- .10(Mother's Schooling).
What is the predicted number of years of schooling for a respondent whose father and mother graduated from college (i.e.,each completed 16 years of schooling)?
Ŷ= 8.91 + .51(Father's Schooling)- .10(Mother's Schooling).
What is the predicted number of years of schooling for a respondent whose father and mother graduated from college (i.e.,each completed 16 years of schooling)?
فتح الحزمة
افتح القفل للوصول البطاقات البالغ عددها 50 في هذه المجموعة.
فتح الحزمة
k this deck
50
The covariance between the mean age at childbearing and the total fertility rate is -0.06.How much predictive power does the mean age at childbearing have in predicting the total fertility rate? Calculate the coefficient of determination and interpret this quantity.
فتح الحزمة
افتح القفل للوصول البطاقات البالغ عددها 50 في هذه المجموعة.
فتح الحزمة
k this deck
فتح الحزمة
افتح القفل للوصول البطاقات البالغ عددها 50 في هذه المجموعة.


