Deck 2: Summarizing Data: Frequency Distributions in Tables and Graphs
ملء الشاشة (f)
سؤال
سؤال
سؤال
Fill in the missing values for A and B in this frequency distribution table:

A) A = 3.2, B = 13
B) A = 3.1, B = 14
C) A = 3.3, B = 13
D) There is not enough information to complete this table.
A) A = 3.2, B = 13
B) A = 3.1, B = 14
C) A = 3.3, B = 13
D) There is not enough information to complete this table.
سؤال
سؤال
سؤال
سؤال
سؤال
سؤال
State the problem with this simple frequency distribution.

A) The interval width is too small.
B) The interval width is unequal.
C) The class intervals overlap.
D) The number of intervals is too small.
A) The interval width is too small.
B) The interval width is unequal.
C) The class intervals overlap.
D) The number of intervals is too small.
سؤال
سؤال
The following frequency distribution is an example of

A) grouped data.
B) ungrouped data.
C) categorical data.
D) ungrouped data and categorical data.
A) grouped data.
B) ungrouped data.
C) categorical data.
D) ungrouped data and categorical data.
سؤال
سؤال
سؤال
سؤال
سؤال
سؤال
سؤال
سؤال
سؤال
سؤال
سؤال
سؤال
سؤال
سؤال
The following is a simple frequency distribution table.Suppose we convert this table to a cumulative frequency distribution.The frequencies in each interval of the cumulative frequency distribution would be

A) 5, 8, 10, 14, and 20 (top down summary).
B) 6, 10, 12, 15, and 20 (bottom up summary).
C) both 5, 8, 10, 14, and 20 (top down summary) and 6, 10, 12, 15, and 20 (bottom up summary), depending on how the data were summarized.
D) it is not possible to summarize the data using a cumulative frequency distribution.
سؤال
سؤال
سؤال
سؤال
سؤال
What is the percentile point at the 90th percentile in the following distribution?

A) 9
B) 10
C) 9.5
D) 10.5
A) 9
B) 10
C) 9.5
D) 10.5
سؤال
سؤال
سؤال
The following is a simple frequency distribution table.If we convert this frequency distribution to relative percentages,which of the following gives the corresponding relative percentages in each interval?

A) 20%, 33%, 50%, 67%, and 100%
B) 0.2, 0.13, 0.17, 0.33, and 0.17
C) 20%, 13%, 17%, 33%, and 17%
D) 6, 10, 15, 25, and 30
A) 20%, 33%, 50%, 67%, and 100%
B) 0.2, 0.13, 0.17, 0.33, and 0.17
C) 20%, 13%, 17%, 33%, and 17%
D) 6, 10, 15, 25, and 30
سؤال
What is the percentile point at the 80th percentile in the following distribution?

A) 2
B) 6
C) 7
D) 8
A) 2
B) 6
C) 7
D) 8
سؤال
What is the percentile point at the 50th percentile for the following distribution?

A) 21
B) 23.5
C) 25
D) 25.5
A) 21
B) 23.5
C) 25
D) 25.5
سؤال
سؤال
سؤال
سؤال
سؤال
سؤال
سؤال
سؤال
سؤال
سؤال
سؤال
سؤال
سؤال
سؤال
State the type of graphical display for Graph A and GraphB. 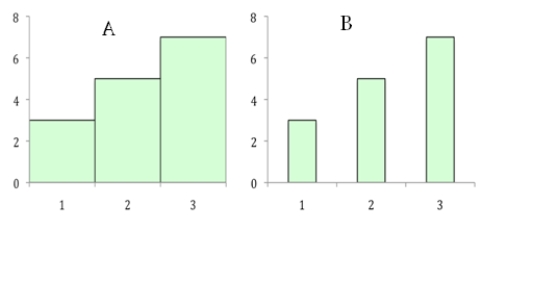
A) A is a bar chart; B is a histogram.
B) B is a bar chart; A is a histogram.
C) Both graphs are bar charts.
D) Both graphs are histograms.
A) A is a bar chart; B is a histogram.
B) B is a bar chart; A is a histogram.
C) Both graphs are bar charts.
D) Both graphs are histograms.
سؤال
سؤال
State the original data displayed in the following stem-and-leaf display.

A) 3, 2, 3, 6, 4, 7, 8, 8, 5, 4, and 9
B) 32, 33, 36, 47, 48, 54, and 59
C) 32, 33, 36, 47, 48, 48, 54, and 59
D) It is not possible to know the original data from this display.
A) 3, 2, 3, 6, 4, 7, 8, 8, 5, 4, and 9
B) 32, 33, 36, 47, 48, 54, and 59
C) 32, 33, 36, 47, 48, 48, 54, and 59
D) It is not possible to know the original data from this display.
سؤال
سؤال
سؤال
سؤال
سؤال
سؤال
سؤال
سؤال
سؤال
سؤال
سؤال
سؤال
سؤال
سؤال
سؤال
سؤال
سؤال
سؤال
سؤال
سؤال
سؤال
سؤال
سؤال
سؤال
سؤال
سؤال
سؤال
سؤال
سؤال

فتح الحزمة
قم بالتسجيل لفتح البطاقات في هذه المجموعة!
Unlock Deck
Unlock Deck
1/80
العب
ملء الشاشة (f)
Deck 2: Summarizing Data: Frequency Distributions in Tables and Graphs
1
A simple frequency distribution
A) can be used to summarize grouped data.
B) can be used to summarize ungrouped data.
C) summarizes the frequency of scores in a given category or range.
D) all of these
A) can be used to summarize grouped data.
B) can be used to summarize ungrouped data.
C) summarizes the frequency of scores in a given category or range.
D) all of these
all of these
2
Which of the following requires the calculation of a real range?
A) frequency distributions for categorical
B) frequency distributions for ungrouped data
C) frequency distributions for grouped data
D) frequency distributions that do not use real data
A) frequency distributions for categorical
B) frequency distributions for ungrouped data
C) frequency distributions for grouped data
D) frequency distributions that do not use real data
frequency distributions for grouped data
3
Fill in the missing values for A and B in this frequency distribution table:
A) A = 3.2, B = 13
B) A = 3.1, B = 14
C) A = 3.3, B = 13
D) There is not enough information to complete this table.
A) A = 3.2, B = 13
B) A = 3.1, B = 14
C) A = 3.3, B = 13
D) There is not enough information to complete this table.
A = 3.2, B = 13
4
Grouped data can be distributed
A) as a range of values.
B) with upper and lower boundaries.
C) into intervals.
D) all of these.
A) as a range of values.
B) with upper and lower boundaries.
C) into intervals.
D) all of these.
فتح الحزمة
افتح القفل للوصول البطاقات البالغ عددها 80 في هذه المجموعة.
فتح الحزمة
k this deck
5
A researcher summarizes a set of frequency data into five intervals.This is an example of a frequency distribution for
A) ungrouped data.
B) grouped data.
C) inferential statistics.
D) population parameters.
A) ungrouped data.
B) grouped data.
C) inferential statistics.
D) population parameters.
فتح الحزمة
افتح القفل للوصول البطاقات البالغ عددها 80 في هذه المجموعة.
فتح الحزمة
k this deck
6
A researcher distributes frequencies into the following intervals: 3-6,7-10,11-15,16-18,19-22,and 23-26.What is wrong with this frequency distribution?
A) The interval width is too small.
B) The interval width is unequal.
C) The first class interval does not begin at 0.
D) One interval is an open class.
A) The interval width is too small.
B) The interval width is unequal.
C) The first class interval does not begin at 0.
D) One interval is an open class.
فتح الحزمة
افتح القفل للوصول البطاقات البالغ عددها 80 في هذه المجموعة.
فتح الحزمة
k this deck
7
To determine the interval width,we divide the ______ by the number of intervals.
A) observed range
B) exclusive range
C) real range
D) all of these
A) observed range
B) exclusive range
C) real range
D) all of these
فتح الحزمة
افتح القفل للوصول البطاقات البالغ عددها 80 في هذه المجموعة.
فتح الحزمة
k this deck
8
A researcher distributes frequencies into the following intervals: 1-10,11-20,21-30,31-40,41-50,and 51 and above.What is wrong with this frequency distribution?
A) The interval width is too small.
B) The interval width is unequal.
C) The class intervals overlap.
D) One interval is an open class.
A) The interval width is too small.
B) The interval width is unequal.
C) The class intervals overlap.
D) One interval is an open class.
فتح الحزمة
افتح القفل للوصول البطاقات البالغ عددها 80 في هذه المجموعة.
فتح الحزمة
k this deck
9
State the problem with this simple frequency distribution.
A) The interval width is too small.
B) The interval width is unequal.
C) The class intervals overlap.
D) The number of intervals is too small.
A) The interval width is too small.
B) The interval width is unequal.
C) The class intervals overlap.
D) The number of intervals is too small.
فتح الحزمة
افتح القفل للوصول البطاقات البالغ عددها 80 في هذه المجموعة.
فتح الحزمة
k this deck
10
The range of scores in each interval of a grouped frequency distribution is called the
A) simple frequency.
B) interval width.
C) real range.
D) grouped data.
A) simple frequency.
B) interval width.
C) real range.
D) grouped data.
فتح الحزمة
افتح القفل للوصول البطاقات البالغ عددها 80 في هذه المجموعة.
فتح الحزمة
k this deck
11
The following frequency distribution is an example of
A) grouped data.
B) ungrouped data.
C) categorical data.
D) ungrouped data and categorical data.
A) grouped data.
B) ungrouped data.
C) categorical data.
D) ungrouped data and categorical data.
فتح الحزمة
افتح القفل للوصول البطاقات البالغ عددها 80 في هذه المجموعة.
فتح الحزمة
k this deck
12
Grouped data are distributed into ______,whereas ungrouped data are distributed into ______.
A) intervals; statistics
B) statistics; intervals
C) intervals; categories
D) categories; intervals
A) intervals; statistics
B) statistics; intervals
C) intervals; categories
D) categories; intervals
فتح الحزمة
افتح القفل للوصول البطاقات البالغ عددها 80 في هذه المجموعة.
فتح الحزمة
k this deck
13
A researcher distributes frequencies into the following classes: absent,tardy,present.What type of data are distributed?
A) nominal data
B) qualitative data
C) ungrouped data
D) all of these
A) nominal data
B) qualitative data
C) ungrouped data
D) all of these
فتح الحزمة
افتح القفل للوصول البطاقات البالغ عددها 80 في هذه المجموعة.
فتح الحزمة
k this deck
14
Grouped data are to ungrouped data as
A) continuous is to discrete.
B) qualitative is to quantitative.
C) inferential is to descriptive.
D) descriptive is to inferential.
A) continuous is to discrete.
B) qualitative is to quantitative.
C) inferential is to descriptive.
D) descriptive is to inferential.
فتح الحزمة
افتح القفل للوصول البطاقات البالغ عددها 80 في هذه المجموعة.
فتح الحزمة
k this deck
15
As a general rule,a simple frequency distribution should have between
A) 3 and 6 intervals.
B) 5 and 10 intervals.
C) 8 and 12 intervals.
D) 5 and 20 intervals.
A) 3 and 6 intervals.
B) 5 and 10 intervals.
C) 8 and 12 intervals.
D) 5 and 20 intervals.
فتح الحزمة
افتح القفل للوصول البطاقات البالغ عددها 80 في هذه المجموعة.
فتح الحزمة
k this deck
16
The three steps for constructing a simple frequency distribution are
A) find the observed range, find the interval width, and construct the frequency distribution.
B) find the real range, count the scores, and construct the frequency distribution.
C) find the real range, find the interval width, and construct the frequency distribution.
D) all of these
A) find the observed range, find the interval width, and construct the frequency distribution.
B) find the real range, count the scores, and construct the frequency distribution.
C) find the real range, find the interval width, and construct the frequency distribution.
D) all of these
فتح الحزمة
افتح القفل للوصول البطاقات البالغ عددها 80 في هذه المجموعة.
فتح الحزمة
k this deck
17
When cumulating frequencies from the bottom up,the data are discussed in terms of
A) at most.
B) less than.
C) at or below.
D) all of these.
A) at most.
B) less than.
C) at or below.
D) all of these.
فتح الحزمة
افتح القفل للوصول البطاقات البالغ عددها 80 في هذه المجموعة.
فتح الحزمة
k this deck
18
When cumulating frequencies from the top down,the data are discussed in terms of
A) greater than.
B) at or above.
C) at least.
D) all of these.
A) greater than.
B) at or above.
C) at least.
D) all of these.
فتح الحزمة
افتح القفل للوصول البطاقات البالغ عددها 80 في هذه المجموعة.
فتح الحزمة
k this deck
19
Which of the following is NOT a rule for constructing a simple frequency distribution?
A) The number of intervals should equal the number of values measured.
B) Each interval is equidistant.
C) No class interval overlaps.
D) At least five class intervals are included.
A) The number of intervals should equal the number of values measured.
B) Each interval is equidistant.
C) No class interval overlaps.
D) At least five class intervals are included.
فتح الحزمة
افتح القفل للوصول البطاقات البالغ عددها 80 في هذه المجموعة.
فتح الحزمة
k this deck
20
Ungrouped data can be distributed as
A) intervals.
B) categories.
C) upper and lower boundaries.
D) all of these.
A) intervals.
B) categories.
C) upper and lower boundaries.
D) all of these.
فتح الحزمة
افتح القفل للوصول البطاقات البالغ عددها 80 في هذه المجموعة.
فتح الحزمة
k this deck
21
A researcher finds that 12 persons in a sample of 60 reported getting between 4 and 6 hr of sleep per night.What is the relative percentage for this interval?
A) 24%
B) 22%
C) 20%
D) There is not enough information to answer this question.
A) 24%
B) 22%
C) 20%
D) There is not enough information to answer this question.
فتح الحزمة
افتح القفل للوصول البطاقات البالغ عددها 80 في هذه المجموعة.
فتح الحزمة
k this deck
22
A researcher finds that 12% of participants make between three and five visits to a physician each year.What are the real limits for this interval?
A) 3-5
B) 2.5-5.5
C) 2.5-3.5
D) equal to the sum of the products for the previous interval
A) 3-5
B) 2.5-5.5
C) 2.5-3.5
D) equal to the sum of the products for the previous interval
فتح الحزمة
افتح القفل للوصول البطاقات البالغ عددها 80 في هذه المجموعة.
فتح الحزمة
k this deck
23
A percentile point is
A) the value of a score on a measurement scale below which a specified percentage of scores in a distribution falls.
B) a summary display that distributes the sum of percentages across a series of intervals.
C) an interval with no defined upper or lower boundary.
D) the range of values contained in each interval of a grouped frequency distribution.
فتح الحزمة
افتح القفل للوصول البطاقات البالغ عددها 80 في هذه المجموعة.
فتح الحزمة
k this deck
24
A relative frequency distribution is appropriate when
A) there are large frequency counts in each interval.
B) the data are grouped into relatively small intervals.
C) there are open classes.
D) the interval width is too large.
A) there are large frequency counts in each interval.
B) the data are grouped into relatively small intervals.
C) there are open classes.
D) the interval width is too large.
فتح الحزمة
افتح القفل للوصول البطاقات البالغ عددها 80 في هذه المجموعة.
فتح الحزمة
k this deck
25
The following is a simple frequency distribution table.Suppose we convert this table to a cumulative frequency distribution.The frequencies in each interval of the cumulative frequency distribution would be
A) 5, 8, 10, 14, and 20 (top down summary).
B) 6, 10, 12, 15, and 20 (bottom up summary).
C) both 5, 8, 10, 14, and 20 (top down summary) and 6, 10, 12, 15, and 20 (bottom up summary), depending on how the data were summarized.
D) it is not possible to summarize the data using a cumulative frequency distribution.
فتح الحزمة
افتح القفل للوصول البطاقات البالغ عددها 80 في هذه المجموعة.
فتح الحزمة
k this deck
26
A percentile is
A) a percentile point.
B) a value between -1 and +1.
C) a raw score multiplied times 100.
D) only used with ungrouped data.
A) a percentile point.
B) a value between -1 and +1.
C) a raw score multiplied times 100.
D) only used with ungrouped data.
فتح الحزمة
افتح القفل للوصول البطاقات البالغ عددها 80 في هذه المجموعة.
فتح الحزمة
k this deck
27
The sum of relative frequencies for each interval is ______.
A) 1.00
B) 100%
C) equal to the total number of scores in a distribution
D) both 1.00 and 100%
A) 1.00
B) 100%
C) equal to the total number of scores in a distribution
D) both 1.00 and 100%
فتح الحزمة
افتح القفل للوصول البطاقات البالغ عددها 80 في هذه المجموعة.
فتح الحزمة
k this deck
28
The ______ is the percentage of scores with values that fall below a specified score in a distribution.
A) percentile rank
B) interval
C) relative frequency
D) percentile point
A) percentile rank
B) interval
C) relative frequency
D) percentile point
فتح الحزمة
افتح القفل للوصول البطاقات البالغ عددها 80 في هذه المجموعة.
فتح الحزمة
k this deck
29
What is the corresponding percentile of a percentile point?
A) the score
B) the frequency
C) the percentile rank
D) always 100%
A) the score
B) the frequency
C) the percentile rank
D) always 100%
فتح الحزمة
افتح القفل للوصول البطاقات البالغ عددها 80 في هذه المجموعة.
فتح الحزمة
k this deck
30
What is the percentile point at the 90th percentile in the following distribution?
A) 9
B) 10
C) 9.5
D) 10.5
A) 9
B) 10
C) 9.5
D) 10.5
فتح الحزمة
افتح القفل للوصول البطاقات البالغ عددها 80 في هذه المجموعة.
فتح الحزمة
k this deck
31
A graphical display for grouped frequency distributions with continuous data is called a
A) histogram.
B) bar chart.
C) pie chart.
D) scatter gram.
A) histogram.
B) bar chart.
C) pie chart.
D) scatter gram.
فتح الحزمة
افتح القفل للوصول البطاقات البالغ عددها 80 في هذه المجموعة.
فتح الحزمة
k this deck
32
A ______ is plotted at the midpoint of each interval,whereas a(n)______ is plotted at the upper boundary of each interval.
A) histogram; bar chart
B) frequency polygon; histogram
C) frequency polygon; ogive
D) histogram; frequency polygon
A) histogram; bar chart
B) frequency polygon; histogram
C) frequency polygon; ogive
D) histogram; frequency polygon
فتح الحزمة
افتح القفل للوصول البطاقات البالغ عددها 80 في هذه المجموعة.
فتح الحزمة
k this deck
33
The following is a simple frequency distribution table.If we convert this frequency distribution to relative percentages,which of the following gives the corresponding relative percentages in each interval?
A) 20%, 33%, 50%, 67%, and 100%
B) 0.2, 0.13, 0.17, 0.33, and 0.17
C) 20%, 13%, 17%, 33%, and 17%
D) 6, 10, 15, 25, and 30
A) 20%, 33%, 50%, 67%, and 100%
B) 0.2, 0.13, 0.17, 0.33, and 0.17
C) 20%, 13%, 17%, 33%, and 17%
D) 6, 10, 15, 25, and 30
فتح الحزمة
افتح القفل للوصول البطاقات البالغ عددها 80 في هذه المجموعة.
فتح الحزمة
k this deck
34
What is the percentile point at the 80th percentile in the following distribution?
A) 2
B) 6
C) 7
D) 8
A) 2
B) 6
C) 7
D) 8
فتح الحزمة
افتح القفل للوصول البطاقات البالغ عددها 80 في هذه المجموعة.
فتح الحزمة
k this deck
35
What is the percentile point at the 50th percentile for the following distribution?
A) 21
B) 23.5
C) 25
D) 25.5
A) 21
B) 23.5
C) 25
D) 25.5
فتح الحزمة
افتح القفل للوصول البطاقات البالغ عددها 80 في هذه المجموعة.
فتح الحزمة
k this deck
36
A psychologist wants to know how many of her clients continue with therapy for at least 12 days.If she constructs a frequency distribution for these data,what type of distribution would be most appropriate to answer her question?
A) a cumulative frequency distribution from the bottom up
B) a cumulative frequency distribution from the top down
C) a simple frequency distribution
D) a relative frequency distribution
A) a cumulative frequency distribution from the bottom up
B) a cumulative frequency distribution from the top down
C) a simple frequency distribution
D) a relative frequency distribution
فتح الحزمة
افتح القفل للوصول البطاقات البالغ عددها 80 في هذه المجموعة.
فتح الحزمة
k this deck
37
A cumulative percentage summary that indicates the percentage of scores at or below a given value is called a
A) relative percentage.
B) relative frequency.
C) percentile rank.
D) cumulative frequency.
A) relative percentage.
B) relative frequency.
C) percentile rank.
D) cumulative frequency.
فتح الحزمة
افتح القفل للوصول البطاقات البالغ عددها 80 في هذه المجموعة.
فتح الحزمة
k this deck
38
A student scores in the 80th percentile on an exam.What does this mean in comparison to all other students?
A) The student scored higher than 80% of all others who took the exam.
B) The student scored worse than 80% of all others who took the exam.
C) Of all those who took the exam, only 80% of them completed it.
D) The student would score the same grade on the exam 80% of the time.
A) The student scored higher than 80% of all others who took the exam.
B) The student scored worse than 80% of all others who took the exam.
C) Of all those who took the exam, only 80% of them completed it.
D) The student would score the same grade on the exam 80% of the time.
فتح الحزمة
افتح القفل للوصول البطاقات البالغ عددها 80 في هذه المجموعة.
فتح الحزمة
k this deck
39
A researcher wants to determine how many participants will take less than 24 s to complete a cognitive performance task.If he constructs a frequency distribution for these data,what type of distribution would be most appropriate to answer his question?
A) a simple frequency distribution
B) a relative frequency distribution
C) a cumulative frequency distribution from the bottom up
D) a cumulative frequency distribution from the top down
A) a simple frequency distribution
B) a relative frequency distribution
C) a cumulative frequency distribution from the bottom up
D) a cumulative frequency distribution from the top down
فتح الحزمة
افتح القفل للوصول البطاقات البالغ عددها 80 في هذه المجموعة.
فتح الحزمة
k this deck
40
A percentile is also called a:
A) score.
B) range.
C) distribution.
D) percentile point.
A) score.
B) range.
C) distribution.
D) percentile point.
فتح الحزمة
افتح القفل للوصول البطاقات البالغ عددها 80 في هذه المجموعة.
فتح الحزمة
k this deck
41
The midpoint of a given interval is the average of the upper and lower boundaries for that interval.
فتح الحزمة
افتح القفل للوصول البطاقات البالغ عددها 80 في هذه المجموعة.
فتح الحزمة
k this deck
42
In the stem-and-leaf display,each number to the right of the vertical line is referred to as a ______; the numbers to the left of the vertical line are called the ______.
A) stem; leaf
B) leaf; stem
C) digit; place
D) place; digit
A) stem; leaf
B) leaf; stem
C) digit; place
D) place; digit
فتح الحزمة
افتح القفل للوصول البطاقات البالغ عددها 80 في هذه المجموعة.
فتح الحزمة
k this deck
43
The data should be ungrouped for the following data set: 6,7,7,7,7,7,7,8,8,8,9,9,9,6,6,6,8,and 7.
فتح الحزمة
افتح القفل للوصول البطاقات البالغ عددها 80 في هذه المجموعة.
فتح الحزمة
k this deck
44
The data should be grouped for the following data set: 0,0,0,2,2,1,1,2,2,2,1,0,0,0,0,2,2,1,1,1,2,1,2,2,0,0,1,and 2.
فتح الحزمة
افتح القفل للوصول البطاقات البالغ عددها 80 في هذه المجموعة.
فتح الحزمة
k this deck
45
Ungrouped data are always distributed in intervals.
فتح الحزمة
افتح القفل للوصول البطاقات البالغ عددها 80 في هذه المجموعة.
فتح الحزمة
k this deck
46
A researcher records the number of children at a local school from married-,divorced-,and single-parent homes.This frequency data would be best displayed as a(n)
A) bar chart.
B) frequency polygon.
C) histogram.
D) ogive.
A) bar chart.
B) frequency polygon.
C) histogram.
D) ogive.
فتح الحزمة
افتح القفل للوصول البطاقات البالغ عددها 80 في هذه المجموعة.
فتح الحزمة
k this deck
47
The real range is the difference between the largest value and the smallest value in a data set.
فتح الحزمة
افتح القفل للوصول البطاقات البالغ عددها 80 في هذه المجموعة.
فتح الحزمة
k this deck
48
A researcher measures the time (in seconds)it takes children to complete a basic reading skills task.What type of graphical display would be most appropriate for summarizing the frequency of children falling into different intervals of time?
A) histogram
B) bar chart
C) scatter gram
D) all of these
A) histogram
B) bar chart
C) scatter gram
D) all of these
فتح الحزمة
افتح القفل للوصول البطاقات البالغ عددها 80 في هذه المجموعة.
فتح الحزمة
k this deck
49
State the type of graphical display for Graph A and GraphB.
A) A is a bar chart; B is a histogram.
B) B is a bar chart; A is a histogram.
C) Both graphs are bar charts.
D) Both graphs are histograms.
A) A is a bar chart; B is a histogram.
B) B is a bar chart; A is a histogram.
C) Both graphs are bar charts.
D) Both graphs are histograms.
فتح الحزمة
افتح القفل للوصول البطاقات البالغ عددها 80 في هذه المجموعة.
فتح الحزمة
k this deck
50
An open class is permitted when outliers exist in the data.
فتح الحزمة
افتح القفل للوصول البطاقات البالغ عددها 80 في هذه المجموعة.
فتح الحزمة
k this deck
51
State the original data displayed in the following stem-and-leaf display.
A) 3, 2, 3, 6, 4, 7, 8, 8, 5, 4, and 9
B) 32, 33, 36, 47, 48, 54, and 59
C) 32, 33, 36, 47, 48, 48, 54, and 59
D) It is not possible to know the original data from this display.
A) 3, 2, 3, 6, 4, 7, 8, 8, 5, 4, and 9
B) 32, 33, 36, 47, 48, 54, and 59
C) 32, 33, 36, 47, 48, 48, 54, and 59
D) It is not possible to know the original data from this display.
فتح الحزمة
افتح القفل للوصول البطاقات البالغ عددها 80 في هذه المجموعة.
فتح الحزمة
k this deck
52
Grouped data are used to summarize quantitative data that are continuous or discrete.
فتح الحزمة
افتح القفل للوصول البطاقات البالغ عددها 80 في هذه المجموعة.
فتح الحزمة
k this deck
53
A researcher measures the weight (in ounces)of newborn infants in the month of March.What type of graphical display would be most appropriate for summarizing the frequency of infants falling into different intervals of weight?
A) histogram
B) bar chart
C) scatter gram
D) all of these
A) histogram
B) bar chart
C) scatter gram
D) all of these
فتح الحزمة
افتح القفل للوصول البطاقات البالغ عددها 80 في هذه المجموعة.
فتح الحزمة
k this deck
54
Bar charts are a lot like histograms,except
A) the bars displayed in the graph do not touch.
B) the bar chart summarizes quantitative data.
C) the bar chart summarizes continuous data.
D) all of these.
A) the bars displayed in the graph do not touch.
B) the bar chart summarizes quantitative data.
C) the bar chart summarizes continuous data.
D) all of these.
فتح الحزمة
افتح القفل للوصول البطاقات البالغ عددها 80 في هذه المجموعة.
فتح الحزمة
k this deck
55
Frequency distributions can be used to summarize both grouped and ungrouped data.
فتح الحزمة
افتح القفل للوصول البطاقات البالغ عددها 80 في هذه المجموعة.
فتح الحزمة
k this deck
56
Which of the following is a type of graphical display used to summarize quantitative,continuous data?
A) histogram
B) frequency polygon
C) ogive
D) all of these
A) histogram
B) frequency polygon
C) ogive
D) all of these
فتح الحزمة
افتح القفل للوصول البطاقات البالغ عددها 80 في هذه المجموعة.
فتح الحزمة
k this deck
57
To construct a pie chart,first distribute the data as
A) cumulative percentages.
B) relative percentages.
C) cumulative frequencies.
D) cumulative relative percentages.
A) cumulative percentages.
B) relative percentages.
C) cumulative frequencies.
D) cumulative relative percentages.
فتح الحزمة
افتح القفل للوصول البطاقات البالغ عددها 80 في هذه المجموعة.
فتح الحزمة
k this deck
58
Which of the following is a type of graphical display used to summarize qualitative,discrete data?
A) bar chart
B) pie chart
C) histogram
D) both bar chart and pie chart
A) bar chart
B) pie chart
C) histogram
D) both bar chart and pie chart
فتح الحزمة
افتح القفل للوصول البطاقات البالغ عددها 80 في هذه المجموعة.
فتح الحزمة
k this deck
59
Summarizing data in a table or graph can make it easier to see patterns in the data.
فتح الحزمة
افتح القفل للوصول البطاقات البالغ عددها 80 في هذه المجموعة.
فتح الحزمة
k this deck
60
Frequency distributions summarize the average scores in a set of data.
فتح الحزمة
افتح القفل للوصول البطاقات البالغ عددها 80 في هذه المجموعة.
فتح الحزمة
k this deck
61
A relative frequency is typically used with smaller,but not larger,data sets.
فتح الحزمة
افتح القفل للوصول البطاقات البالغ عددها 80 في هذه المجموعة.
فتح الحزمة
k this deck
62
A cumulative frequency distribution is the sum of frequencies across a series of intervals.
فتح الحزمة
افتح القفل للوصول البطاقات البالغ عددها 80 في هذه المجموعة.
فتح الحزمة
k this deck
63
To summarize relative percent data,a pie chart can be a good choice to display the data.
فتح الحزمة
افتح القفل للوصول البطاقات البالغ عددها 80 في هذه المجموعة.
فتح الحزمة
k this deck
64
A circular graph that displays the relative percentage of a frequency distribution into sectors is called a scatter gram.
فتح الحزمة
افتح القفل للوصول البطاقات البالغ عددها 80 في هذه المجموعة.
فتح الحزمة
k this deck
65
Cumulative percent data can be summarized using an ogive.
فتح الحزمة
افتح القفل للوصول البطاقات البالغ عددها 80 في هذه المجموعة.
فتح الحزمة
k this deck
66
Whether you cumulate a frequency distribution from the bottom up or the top down depends on how you want to discuss the data.
فتح الحزمة
افتح القفل للوصول البطاقات البالغ عددها 80 في هذه المجموعة.
فتح الحزمة
k this deck
67
The corresponding percentile of a given percentile point is the percentile rank of that score.
فتح الحزمة
افتح القفل للوصول البطاقات البالغ عددها 80 في هذه المجموعة.
فتح الحزمة
k this deck
68
A frequency polygon is a dot-and-line graph where the dot is the upper class boundary of each interval and the line connects each dot.
فتح الحزمة
افتح القفل للوصول البطاقات البالغ عددها 80 في هذه المجموعة.
فتح الحزمة
k this deck
69
The percentile rank of a score is the percentage of scores with values that fall below a specified score in a distribution.
فتح الحزمة
افتح القفل للوصول البطاقات البالغ عددها 80 في هذه المجموعة.
فتح الحزمة
k this deck
70
The sum of the frequencies for a distribution is 100.This means that fewer than 100 persons were counted.
فتح الحزمة
افتح القفل للوصول البطاقات البالغ عددها 80 في هذه المجموعة.
فتح الحزمة
k this deck
71
Twelve percent of students scored at or below a failing grade on an exam.A percentile rank distribution would be appropriate to summarize this outcome.
فتح الحزمة
افتح القفل للوصول البطاقات البالغ عددها 80 في هذه المجموعة.
فتح الحزمة
k this deck
72
In a bar chart,each class or category is represented by a rectangle and each rectangle is separated (does not touch)along the x-axis.
فتح الحزمة
افتح القفل للوصول البطاقات البالغ عددها 80 في هذه المجموعة.
فتح الحزمة
k this deck
73
A histogram is used to summarize grouped data.
فتح الحزمة
افتح القفل للوصول البطاقات البالغ عددها 80 في هذه المجموعة.
فتح الحزمة
k this deck
74
Bar charts are used to summarize discrete and categorical data.
فتح الحزمة
افتح القفل للوصول البطاقات البالغ عددها 80 في هذه المجموعة.
فتح الحزمة
k this deck
75
Relative frequencies sum to the total frequency count.
فتح الحزمة
افتح القفل للوصول البطاقات البالغ عددها 80 في هذه المجموعة.
فتح الحزمة
k this deck
76
A stem-and-leaf display retains the value of each data point.
فتح الحزمة
افتح القفل للوصول البطاقات البالغ عددها 80 في هذه المجموعة.
فتح الحزمة
k this deck
77
A frequency polygon,but not an ogive,can be used to summarize cumulative percent distributions.
فتح الحزمة
افتح القفل للوصول البطاقات البالغ عددها 80 في هذه المجموعة.
فتح الحزمة
k this deck
78
A histogram is basically a bar chart in which the bars do not touch.
فتح الحزمة
افتح القفل للوصول البطاقات البالغ عددها 80 في هذه المجموعة.
فتح الحزمة
k this deck
79
A percentile rank is a cumulative percentage distribution summed from the bottom up.
فتح الحزمة
افتح القفل للوصول البطاقات البالغ عددها 80 في هذه المجموعة.
فتح الحزمة
k this deck
80
Percentages range from 0% to 100% and can never be negative.
فتح الحزمة
افتح القفل للوصول البطاقات البالغ عددها 80 في هذه المجموعة.
فتح الحزمة
k this deck
فتح الحزمة
افتح القفل للوصول البطاقات البالغ عددها 80 في هذه المجموعة.


