Deck 1: Introduction to Physiology
ملء الشاشة (f)
سؤال
سؤال
سؤال
سؤال
سؤال
سؤال
سؤال
سؤال
سؤال
سؤال
سؤال
سؤال
سؤال
سؤال
سؤال
سؤال
سؤال
سؤال
سؤال
سؤال
سؤال
سؤال
سؤال
سؤال
سؤال
سؤال
سؤال
سؤال
سؤال
سؤال
سؤال
سؤال
سؤال
سؤال
سؤال
سؤال
سؤال
سؤال
سؤال
سؤال
سؤال
سؤال
Following is a table of data collected from one section of an 8 a.m.physiology lab.There were 20 students present, 10 men and 10 women.Information collected from the students included their height, weight, age, gender, and resting pulse rate.In addition, the students were surveyed to see if they smoked cigarettes, considered themselves "regular exercisers," if they had consumed caffeine the morning of the lab, and if they had eaten breakfast that day.A "y" or "n" (yes or no) was recorded to indicate their answers.Each student did "jumping jacks" for 5 minutes and recorded the time required to regain their resting heart rate, which is listed on the table as "recovery time." Finally, each student participated in an exercise designed to measure their reaction time (in milliseconds) in catching an object dropped by a lab partner according to specified criteria.Use this table to answer the following questions.Ignore statistical problems caused by small sample size, and so on.
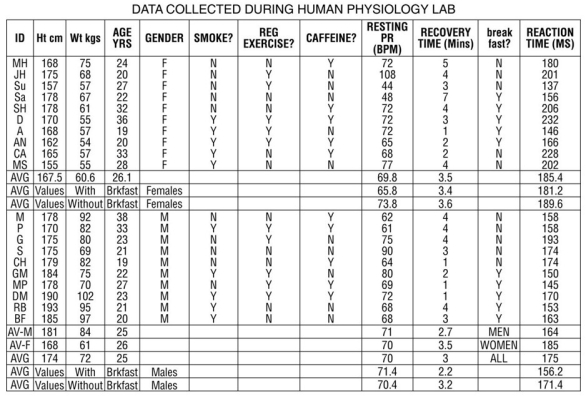
Table 1.3
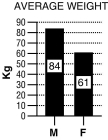
Figure 1.3
For these questions, the data were separated and analyzed by gender.
Refer to Table 1.3 and Figure 1.3 (bar graph).
A.Write a hypothesis regarding gender and weight.
B.What is the dependent variable? What is the independent variable?
C.Based on the data in the graph above, what is your conclusion?
D.Why is a bar graph a good choice for presentation of these data? Would another type of chart be as effective?
Table 1.3
Figure 1.3
For these questions, the data were separated and analyzed by gender.
Refer to Table 1.3 and Figure 1.3 (bar graph).
A.Write a hypothesis regarding gender and weight.
B.What is the dependent variable? What is the independent variable?
C.Based on the data in the graph above, what is your conclusion?
D.Why is a bar graph a good choice for presentation of these data? Would another type of chart be as effective?
سؤال
Table 1.1
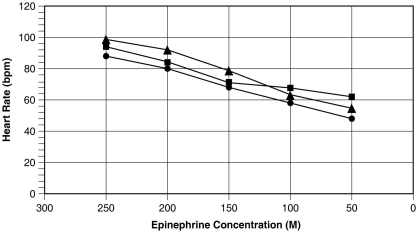
Figure 1.1
Use the table and graph below to answer the following questions.
Use Table 1.1 to graph the data appropriately.What can you CONCLUDE based on the new figure?
Figure 1.1
Use the table and graph below to answer the following questions.
Use Table 1.1 to graph the data appropriately.What can you CONCLUDE based on the new figure?
سؤال
سؤال
سؤال
Table 1.1
Figure 1.1
Use the table and graph below to answer the following questions.
List all of the errors in Figure 1.1.
Figure 1.1
Use the table and graph below to answer the following questions.
List all of the errors in Figure 1.1.
سؤال
سؤال
سؤال
سؤال
Table 1.1
Figure 1.1
Use the table and graph below to answer the following questions.
What is the reason for using a line graph to express the results of this study?
Figure 1.1
Use the table and graph below to answer the following questions.
What is the reason for using a line graph to express the results of this study?
سؤال
سؤال
سؤال
سؤال
Table 1.1
Figure 1.1
Use the table and graph below to answer the following questions.
Summarize the data shown in Figure 1.2.
Figure 1.1
Use the table and graph below to answer the following questions.
Summarize the data shown in Figure 1.2.
سؤال
Table 1.1
Figure 1.1
Use the table and graph below to answer the following questions.
Referring to Figure 1.2, at approximately what age do men begin to show higher systolic blood pressures than women? At what age does this trend reverse?
Figure 1.1
Use the table and graph below to answer the following questions.
Referring to Figure 1.2, at approximately what age do men begin to show higher systolic blood pressures than women? At what age does this trend reverse?
سؤال
سؤال
Table 1.1
Figure 1.1
Use the table and graph below to answer the following questions.
Referring to Table 1.2, what general trend in systolic blood pressures is seen as both men and women increase in age?
Figure 1.1
Use the table and graph below to answer the following questions.
Referring to Table 1.2, what general trend in systolic blood pressures is seen as both men and women increase in age?
سؤال
سؤال
سؤال
سؤال
Following is a table of data collected from one section of an 8 a.m.physiology lab.There were 20 students present, 10 men and 10 women.Information collected from the students included their height, weight, age, gender, and resting pulse rate.In addition, the students were surveyed to see if they smoked cigarettes, considered themselves "regular exercisers," if they had consumed caffeine the morning of the lab, and if they had eaten breakfast that day.A "y" or "n" (yes or no) was recorded to indicate their answers.Each student did "jumping jacks" for 5 minutes and recorded the time required to regain their resting heart rate, which is listed on the table as "recovery time." Finally, each student participated in an exercise designed to measure their reaction time (in milliseconds) in catching an object dropped by a lab partner according to specified criteria.Use this table to answer the following questions.Ignore statistical problems caused by small sample size, and so on.
Table 1.3
Figure 1.3
For these questions, the data were separated and analyzed by gender.
Refer to Table 1.3.
A.Disregarding gender, write a hypothesis that expresses the relationship between weight and height.
B.What is the dependent variable? What is the independent variable?
C.From the data in Table 1.3, construct a graph that examines this relationship.
سؤال
Following is a table of data collected from one section of an 8 a.m.physiology lab.There were 20 students present, 10 men and 10 women.Information collected from the students included their height, weight, age, gender, and resting pulse rate.In addition, the students were surveyed to see if they smoked cigarettes, considered themselves "regular exercisers," if they had consumed caffeine the morning of the lab, and if they had eaten breakfast that day.A "y" or "n" (yes or no) was recorded to indicate their answers.Each student did "jumping jacks" for 5 minutes and recorded the time required to regain their resting heart rate, which is listed on the table as "recovery time." Finally, each student participated in an exercise designed to measure their reaction time (in milliseconds) in catching an object dropped by a lab partner according to specified criteria.Use this table to answer the following questions.Ignore statistical problems caused by small sample size, and so on.
Table 1.3
Figure 1.3
For these questions, the data were separated and analyzed by gender.
Refer to Table 1.3.
A.Write a hypothesis regarding gender and recovery time.
B.What is the dependent variable? What is the independent variable?
C.Create a graph using the averages from the data table.Based on these data, what do you conclude?
سؤال
سؤال
Following is a table of data collected from one section of an 8 a.m.physiology lab.There were 20 students present, 10 men and 10 women.Information collected from the students included their height, weight, age, gender, and resting pulse rate.In addition, the students were surveyed to see if they smoked cigarettes, considered themselves "regular exercisers," if they had consumed caffeine the morning of the lab, and if they had eaten breakfast that day.A "y" or "n" (yes or no) was recorded to indicate their answers.Each student did "jumping jacks" for 5 minutes and recorded the time required to regain their resting heart rate, which is listed on the table as "recovery time." Finally, each student participated in an exercise designed to measure their reaction time (in milliseconds) in catching an object dropped by a lab partner according to specified criteria.Use this table to answer the following questions.Ignore statistical problems caused by small sample size, and so on.
Table 1.3
Figure 1.3
For these questions, the data were separated and analyzed by gender.
Refer to Table 1.3.
A.Write a hypothesis regarding the effects of breakfast consumption on reaction time.
B.What is the dependent variable? What is the independent variable?
Table 1.3
Figure 1.3
For these questions, the data were separated and analyzed by gender.
Refer to Table 1.3.
A.Write a hypothesis regarding the effects of breakfast consumption on reaction time.
B.What is the dependent variable? What is the independent variable?
سؤال
Following is a table of data collected from one section of an 8 a.m.physiology lab.There were 20 students present, 10 men and 10 women.Information collected from the students included their height, weight, age, gender, and resting pulse rate.In addition, the students were surveyed to see if they smoked cigarettes, considered themselves "regular exercisers," if they had consumed caffeine the morning of the lab, and if they had eaten breakfast that day.A "y" or "n" (yes or no) was recorded to indicate their answers.Each student did "jumping jacks" for 5 minutes and recorded the time required to regain their resting heart rate, which is listed on the table as "recovery time." Finally, each student participated in an exercise designed to measure their reaction time (in milliseconds) in catching an object dropped by a lab partner according to specified criteria.Use this table to answer the following questions.Ignore statistical problems caused by small sample size, and so on.
Table 1.3
Figure 1.3
For these questions, the data were separated and analyzed by gender.
Table 1.3 shows data on various factors that may or may not be related to resting pulse rate, time to recovery to resting pulse rate after a few minutes of exercise, and reaction time measured by how quickly a student could press a keyboard key after seeing a computer-generated prompt.For each question below, write a testable hypothesis, identify the dependent and independent variables, sketch an appropriate graph of the results, and draw a conclusion from the data presented in the table.Discuss your results.
A.Does caffeine consumption have an effect on resting pulse rate?
B.Does age play a role in resting pulse rate? Does weight?
C.Is there a relationship between eating breakfast and recovery time?
D.Is there a relationship between reaction time and height?
E.Do women who smoke show differences in their resting pulse rates compared to female nonsmokers or to male smokers and nonsmokers?
F.Does regular exercise have an effect on resting pulse rate?
سؤال
سؤال
سؤال
سؤال

فتح الحزمة
قم بالتسجيل لفتح البطاقات في هذه المجموعة!
Unlock Deck
Unlock Deck
1/69
العب
ملء الشاشة (f)
Deck 1: Introduction to Physiology
1
If a scientific model is supported or verified repeatedly by multiple investigators, it may become a
A) model.
B) theory.
C) hypothesis.
D) law.
E) variable.
A) model.
B) theory.
C) hypothesis.
D) law.
E) variable.
B
2
"Glucose is transported from blood into cells because cells require glucose to meet their energy needs." This type of explanation is
A) mechanistic.
B) theological.
C) teleological.
D) metalogical.
E) scatological.
A) mechanistic.
B) theological.
C) teleological.
D) metalogical.
E) scatological.
C
3
The Internet database for molecular, cellular, and physiological information is called the ________ Project.
A) Human Genome
B) Physiognomy
C) Physiosome
D) Physiome
E) Manhattan
A) Human Genome
B) Physiognomy
C) Physiosome
D) Physiome
E) Manhattan
D
4
How genetics influences the body's response to drugs is called
A) pharmacokinetics.
B) pharmacogenetics.
C) pharmacogenomics.
D) pharmacodynamics.
E) pharmageddon.
A) pharmacokinetics.
B) pharmacogenetics.
C) pharmacogenomics.
D) pharmacodynamics.
E) pharmageddon.
فتح الحزمة
افتح القفل للوصول البطاقات البالغ عددها 69 في هذه المجموعة.
فتح الحزمة
k this deck
5
Place these terms in the typical sequence in which they appear in the process of scientific inquiry: experimental data, theory, model, observation, hypothesis, replication.
A) experimental data, theory, model, observation, hypothesis, replication
B) replication, hypothesis, experimental data, theory, model, observation
C) theory, observation, experimental data, hypothesis, replication, model
D) observation, replication, model, experimental data, hypothesis, theory
E) observation, hypothesis, experimental data, replication, model, theory
فتح الحزمة
افتح القفل للوصول البطاقات البالغ عددها 69 في هذه المجموعة.
فتح الحزمة
k this deck
6
Which of the following is one of Cannon's "internal secretions"?
A) hormones
B) nutrients
C) water
D) inorganic ions
E) None of the answers are correct.
A) hormones
B) nutrients
C) water
D) inorganic ions
E) None of the answers are correct.
فتح الحزمة
افتح القفل للوصول البطاقات البالغ عددها 69 في هذه المجموعة.
فتح الحزمة
k this deck
7
Which of the following is a buffer zone between the outside world and most of the cells of the body?
A) cell membrane
B) red blood cells
C) intracellular fluid
D) extracellular fluid
E) All of the answers are correct.
A) cell membrane
B) red blood cells
C) intracellular fluid
D) extracellular fluid
E) All of the answers are correct.
فتح الحزمة
افتح القفل للوصول البطاقات البالغ عددها 69 في هذه المجموعة.
فتح الحزمة
k this deck
8
"Glucose is transported from blood into cells by transporters in response to insulin." This type of explanation is
A) mechanistic.
B) theological.
C) teleological.
D) metalogical.
E) scatological.
A) mechanistic.
B) theological.
C) teleological.
D) metalogical.
E) scatological.
فتح الحزمة
افتح القفل للوصول البطاقات البالغ عددها 69 في هذه المجموعة.
فتح الحزمة
k this deck
9
Because anatomy and physiology have different definitions, they are usually considered separately in studies of the body.
فتح الحزمة
افتح القفل للوصول البطاقات البالغ عددها 69 في هذه المجموعة.
فتح الحزمة
k this deck
10
Physiology is the study of
A) the structure of the body.
B) the tissues and organs of the body at the microscopic level.
C) growth and reproduction.
D) the normal function of living organisms.
E) the facial features as an indication of personality.
A) the structure of the body.
B) the tissues and organs of the body at the microscopic level.
C) growth and reproduction.
D) the normal function of living organisms.
E) the facial features as an indication of personality.
فتح الحزمة
افتح القفل للوصول البطاقات البالغ عددها 69 في هذه المجموعة.
فتح الحزمة
k this deck
11
Homeostasis is the ability of the body to
A) prevent the external environment from changing.
B) prevent the internal environment from changing.
C) quickly restore changed conditions to normal.
D) ignore external stimuli to remain in a state of rest.
E) prevent excessive blood loss.
A) prevent the external environment from changing.
B) prevent the internal environment from changing.
C) quickly restore changed conditions to normal.
D) ignore external stimuli to remain in a state of rest.
E) prevent excessive blood loss.
فتح الحزمة
افتح القفل للوصول البطاقات البالغ عددها 69 في هذه المجموعة.
فتح الحزمة
k this deck
12
Oxytocin is a hormone that is released in response to cervical dilation.It in turn causes more uterine contractions that will further dilate the cervix.Which type of feedback loop does oxytocin trigger?
A) negative feedback
B) positive feedback
C) local control
D) nociceptive feedback
A) negative feedback
B) positive feedback
C) local control
D) nociceptive feedback
فتح الحزمة
افتح القفل للوصول البطاقات البالغ عددها 69 في هذه المجموعة.
فتح الحزمة
k this deck
13
A technique used to resolve contradictory results in scientific studies is
A) meta-analysis.
B) retrospective analysis.
C) prospective analysis.
D) cross-sectional analysis.
E) longitudinal analysis.
A) meta-analysis.
B) retrospective analysis.
C) prospective analysis.
D) cross-sectional analysis.
E) longitudinal analysis.
فتح الحزمة
افتح القفل للوصول البطاقات البالغ عددها 69 في هذه المجموعة.
فتح الحزمة
k this deck
14
A placebo is
A) any drug being tested in a clinical trial.
B) any drug in a class of drugs commonly used as pain relievers.
C) a drug or treatment that is expected to have no pharmacological effect.
D) a nutritive and respiratory organ in fetal development.
E) a hole in a cavity wall through which an organ protrudes.
فتح الحزمة
افتح القفل للوصول البطاقات البالغ عددها 69 في هذه المجموعة.
فتح الحزمة
k this deck
15
A physician basing clinical decisions on primary research published in biomedical literature is doing ________ medicine.
A) evidence-based
B) traditional
C) alternative
D) whimsical
E) holistic
A) evidence-based
B) traditional
C) alternative
D) whimsical
E) holistic
فتح الحزمة
افتح القفل للوصول البطاقات البالغ عددها 69 في هذه المجموعة.
فتح الحزمة
k this deck
16
The following is a list of several levels of organization that make up the human body.
1)tissue
2)cell
3)organ
4)molecule
5)organism
6)organ system
The correct order from the smallest to the largest is
A) 2, 4, 1, 3, 6, 5.
B) 4, 2, 1, 6, 3, 5.
C) 4, 2, 1, 3, 6, 5.
D) 4, 2, 3, 1, 6, 5.
E) 6, 4, 5, 2, 3, 1.
1)tissue
2)cell
3)organ
4)molecule
5)organism
6)organ system
The correct order from the smallest to the largest is
A) 2, 4, 1, 3, 6, 5.
B) 4, 2, 1, 6, 3, 5.
C) 4, 2, 1, 3, 6, 5.
D) 4, 2, 3, 1, 6, 5.
E) 6, 4, 5, 2, 3, 1.
فتح الحزمة
افتح القفل للوصول البطاقات البالغ عددها 69 في هذه المجموعة.
فتح الحزمة
k this deck
17
The study of body function in a disease state is
A) necrology.
B) physiology.
C) microbiology.
D) pathophysiology.
E) histology.
A) necrology.
B) physiology.
C) microbiology.
D) pathophysiology.
E) histology.
فتح الحزمة
افتح القفل للوصول البطاقات البالغ عددها 69 في هذه المجموعة.
فتح الحزمة
k this deck
18
A study in which a participant acts as an experimental subject in part of the experiment and a control in another part of the experiment is called a ________ study.
A) double-blind
B) crossover
C) meta-analysis
D) retrospective
A) double-blind
B) crossover
C) meta-analysis
D) retrospective
فتح الحزمة
افتح القفل للوصول البطاقات البالغ عددها 69 في هذه المجموعة.
فتح الحزمة
k this deck
19
The literal meaning of the term physiology is knowledge of
A) organs.
B) nature.
C) science.
D) chemistry.
E) math.
A) organs.
B) nature.
C) science.
D) chemistry.
E) math.
فتح الحزمة
افتح القفل للوصول البطاقات البالغ عددها 69 في هذه المجموعة.
فتح الحزمة
k this deck
20
A scientifically logical guess is a
A) model.
B) theory.
C) hypothesis.
D) law.
E) variable.
A) model.
B) theory.
C) hypothesis.
D) law.
E) variable.
فتح الحزمة
افتح القفل للوصول البطاقات البالغ عددها 69 في هذه المجموعة.
فتح الحزمة
k this deck
21
You are interested in learning more about Parkinson's disease, a neurological disorder that primarily affects motor function.Which is the best source to begin your investigation?
A) Ask.com
B) MedlinePlusPubMed
C) public library
D) physiology textbook
E) a physician
A) Ask.com
B) MedlinePlusPubMed
C) public library
D) physiology textbook
E) a physician
فتح الحزمة
افتح القفل للوصول البطاقات البالغ عددها 69 في هذه المجموعة.
فتح الحزمة
k this deck
22
What is the major problem with the deconstructionist view of biology?
فتح الحزمة
افتح القفل للوصول البطاقات البالغ عددها 69 في هذه المجموعة.
فتح الحزمة
k this deck
23
There are 10 cloned horses, born on the same day, with identical chromosomes.They are each subjected to the same physical training regimen, but given daily injections of different concentrations of a particular vitamin.They all run the same race.You set up a graph to explore a relationship between race finish time and vitamin dose.
Which type of graph is best to explore a relationship between race finish time and vitamin dose?
A) bar graph
B) line graph
C) scatter plot
Which type of graph is best to explore a relationship between race finish time and vitamin dose?
A) bar graph
B) line graph
C) scatter plot
فتح الحزمة
افتح القفل للوصول البطاقات البالغ عددها 69 في هذه المجموعة.
فتح الحزمة
k this deck
24
Why are physiology and anatomy frequently studied together?
فتح الحزمة
افتح القفل للوصول البطاقات البالغ عددها 69 في هذه المجموعة.
فتح الحزمة
k this deck
25
List the key concepts or themes in physiology.
فتح الحزمة
افتح القفل للوصول البطاقات البالغ عددها 69 في هذه المجموعة.
فتح الحزمة
k this deck
26
Excretion is a function of the body.Which of the following would be considered excretion?
A) Movement of sodium from the intestines to the bloodstream.
B) Movement of glucose from the kidney to the blood stream.
C) Movement of potassium from kidney cells into one's urine.
D) Movement of salt from sweat glands to the surface of the skin.
E) Movement of oxygen from the lungs to the blood stream.
فتح الحزمة
افتح القفل للوصول البطاقات البالغ عددها 69 في هذه المجموعة.
فتح الحزمة
k this deck
27
You conduct an experiment on twenty 18-year-old male subjects to see how various intensities of exercise influence heart rate.Which of the following is/are considered a dependent variable?
A) age of subjects
B) sex of subjects
C) intensity of exercise
D) heart rate
E) More than one of the answers is correct.
A) age of subjects
B) sex of subjects
C) intensity of exercise
D) heart rate
E) More than one of the answers is correct.
فتح الحزمة
افتح القفل للوصول البطاقات البالغ عددها 69 في هذه المجموعة.
فتح الحزمة
k this deck
28
Adaptive significance is an important concept in physiology because it describes the
A) importance of a highly variable external environment.
B) physiological functions that promote an organism's survival.
C) ability of an organism to monitor and restore its internal state to normal conditions when necessary.
D) similarities between ancient and modern marine organisms.
E) parameters necessary to maintain a constant internal environment.
فتح الحزمة
افتح القفل للوصول البطاقات البالغ عددها 69 في هذه المجموعة.
فتح الحزمة
k this deck
29
Sarah has just flown around the world in the last 48 hours.She is having trouble sleeping, a condition known as insomnia.How do you think Sarah's long flights and her insomnia are related to biological rhythms?
فتح الحزمة
افتح القفل للوصول البطاقات البالغ عددها 69 في هذه المجموعة.
فتح الحزمة
k this deck
30
You want to display data on the finish times of the 10 fastest race horses in a single race at the Kentucky Derby.
Which type of graph would be best to display this information?
A) bar graph
B) line graph
C) scatter plot
Which type of graph would be best to display this information?
A) bar graph
B) line graph
C) scatter plot
فتح الحزمة
افتح القفل للوصول البطاقات البالغ عددها 69 في هذه المجموعة.
فتح الحزمة
k this deck
31
A horse runs 10 races, each a mile long, during a 6-month period, and you are interested in determining if the horse's race time changes with experience.You set up a graph to display the race finish times of this horse.
What would the labels be for the graph axes?
What would the labels be for the graph axes?
فتح الحزمة
افتح القفل للوصول البطاقات البالغ عددها 69 في هذه المجموعة.
فتح الحزمة
k this deck
32
Which of the following systems does NOT exchange material with the internal and external environments?
A) respiratory system
B) circulatory system
C) digestive system
D) urinary system
E) All of the above.
A) respiratory system
B) circulatory system
C) digestive system
D) urinary system
E) All of the above.
فتح الحزمة
افتح القفل للوصول البطاقات البالغ عددها 69 في هذه المجموعة.
فتح الحزمة
k this deck
33
What is a nocebo effect?
فتح الحزمة
افتح القفل للوصول البطاقات البالغ عددها 69 في هذه المجموعة.
فتح الحزمة
k this deck
34
You want to display data on the finish times of the 10 fastest race horses in a single race at the Kentucky Derby.
What would the labels be for the graph axes?
What would the labels be for the graph axes?
فتح الحزمة
افتح القفل للوصول البطاقات البالغ عددها 69 في هذه المجموعة.
فتح الحزمة
k this deck
35
What is the difference between a peer-reviewed article and a review article?
فتح الحزمة
افتح القفل للوصول البطاقات البالغ عددها 69 في هذه المجموعة.
فتح الحزمة
k this deck
36
Individuals with Type I diabetes do not make enough insulin.Which of the following would be a mechanistic explanation of how insulin is used by the body?
A) Cells need insulin because glucose will not cross the cell membrane.
B) Insulin is a hormone involved in glucose transport.
C) Insulin binds to its receptor which triggers the movement of glucose transporters to the cell membrane.
D) Since all cells need glucose, insulin is required.
E) Without insulin most cells in the body would be unable to produce enough ATP.
فتح الحزمة
افتح القفل للوصول البطاقات البالغ عددها 69 في هذه المجموعة.
فتح الحزمة
k this deck
37
You conduct an experiment on twenty 18-year-old male subjects to see how various intensities of exercise influence heart rate.Which of the following is/are considered an independent variable?
A) age of subjects
B) sex of subjects
C) intensity of exercise
D) heart rate
E) More than one of the answers is correct.
A) age of subjects
B) sex of subjects
C) intensity of exercise
D) heart rate
E) More than one of the answers is correct.
فتح الحزمة
افتح القفل للوصول البطاقات البالغ عددها 69 في هذه المجموعة.
فتح الحزمة
k this deck
38
The human environment is terrestrial, dry, and highly variable.However, our bodies expend enormous amounts of energy maintaining a constant internal environment.Studying why our bodies do this is what kind of scientific endeavor?
A) mechanistic
B) translational
C) teleological
D) anatomical
E) meterological
A) mechanistic
B) translational
C) teleological
D) anatomical
E) meterological
فتح الحزمة
افتح القفل للوصول البطاقات البالغ عددها 69 في هذه المجموعة.
فتح الحزمة
k this deck
39
There are 10 cloned horses, born on the same day, with identical chromosomes.They are each subjected to the same physical training regimen, but given daily injections of different concentrations of a particular vitamin.They all run the same race.You set up a graph to explore a relationship between race finish time and vitamin dose.
What are the labels for the graph axes?
What are the labels for the graph axes?
فتح الحزمة
افتح القفل للوصول البطاقات البالغ عددها 69 في هذه المجموعة.
فتح الحزمة
k this deck
40
A horse runs 10 races, each a mile long, during a 6-month period, and you are interested in determining if the horse's race time changes with experience.You set up a graph to display the race finish times of this horse.
Which type of graph would be best to display the race finish times of this horse?
A) bar graph
B) line graph
C) scatter plot
Which type of graph would be best to display the race finish times of this horse?
A) bar graph
B) line graph
C) scatter plot
فتح الحزمة
افتح القفل للوصول البطاقات البالغ عددها 69 في هذه المجموعة.
فتح الحزمة
k this deck
41
Use the following terms to develop a concept map:
brain, sensory neuron, an eye, foot, soccer ball, motor neuron
brain, sensory neuron, an eye, foot, soccer ball, motor neuron
فتح الحزمة
افتح القفل للوصول البطاقات البالغ عددها 69 في هذه المجموعة.
فتح الحزمة
k this deck
42
Following is a table of data collected from one section of an 8 a.m.physiology lab.There were 20 students present, 10 men and 10 women.Information collected from the students included their height, weight, age, gender, and resting pulse rate.In addition, the students were surveyed to see if they smoked cigarettes, considered themselves "regular exercisers," if they had consumed caffeine the morning of the lab, and if they had eaten breakfast that day.A "y" or "n" (yes or no) was recorded to indicate their answers.Each student did "jumping jacks" for 5 minutes and recorded the time required to regain their resting heart rate, which is listed on the table as "recovery time." Finally, each student participated in an exercise designed to measure their reaction time (in milliseconds) in catching an object dropped by a lab partner according to specified criteria.Use this table to answer the following questions.Ignore statistical problems caused by small sample size, and so on.
Table 1.3
Figure 1.3
For these questions, the data were separated and analyzed by gender.
Refer to Table 1.3 and Figure 1.3 (bar graph).
A.Write a hypothesis regarding gender and weight.
B.What is the dependent variable? What is the independent variable?
C.Based on the data in the graph above, what is your conclusion?
D.Why is a bar graph a good choice for presentation of these data? Would another type of chart be as effective?
فتح الحزمة
افتح القفل للوصول البطاقات البالغ عددها 69 في هذه المجموعة.
فتح الحزمة
k this deck
43
Table 1.1
Figure 1.1
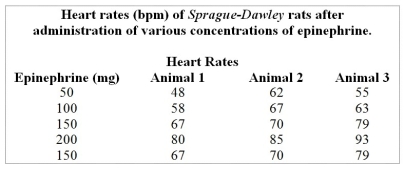
Use the table and graph below to answer the following questions.
Use Table 1.1 to graph the data appropriately.What can you CONCLUDE based on the new figure?
Figure 1.1
Use the table and graph below to answer the following questions.
Use Table 1.1 to graph the data appropriately.What can you CONCLUDE based on the new figure?
فتح الحزمة
افتح القفل للوصول البطاقات البالغ عددها 69 في هذه المجموعة.
فتح الحزمة
k this deck
44
You are designing a study to assess the effects of a new treatment for hypertension.What ethical considerations would you employ when monitoring your progress?
فتح الحزمة
افتح القفل للوصول البطاقات البالغ عددها 69 في هذه المجموعة.
فتح الحزمة
k this deck
45
You conduct an experiment on twenty 18-year-old male subjects to see how various levels of exercise influence heart rate.Explain why only 18-year-old males were used as subjects.
فتح الحزمة
افتح القفل للوصول البطاقات البالغ عددها 69 في هذه المجموعة.
فتح الحزمة
k this deck
46
Table 1.1
Figure 1.1
Use the table and graph below to answer the following questions.
List all of the errors in Figure 1.1.
Figure 1.1
Use the table and graph below to answer the following questions.
List all of the errors in Figure 1.1.
فتح الحزمة
افتح القفل للوصول البطاقات البالغ عددها 69 في هذه المجموعة.
فتح الحزمة
k this deck
47
Why is it necessary to label the axes of a graph?
فتح الحزمة
افتح القفل للوصول البطاقات البالغ عددها 69 في هذه المجموعة.
فتح الحزمة
k this deck
48
Why is it necessary to space grid marks on a graph proportionally to the quantity measured (example: each square represents one centimeter)?
فتح الحزمة
افتح القفل للوصول البطاقات البالغ عددها 69 في هذه المجموعة.
فتح الحزمة
k this deck
49
Explain why the prefix homeo- is used in the term homeostasis.Why do some physiologists prefer the term homeodynamics over homeostasis?
فتح الحزمة
افتح القفل للوصول البطاقات البالغ عددها 69 في هذه المجموعة.
فتح الحزمة
k this deck
50
Table 1.1
Figure 1.1
Use the table and graph below to answer the following questions.
What is the reason for using a line graph to express the results of this study?
Figure 1.1
Use the table and graph below to answer the following questions.
What is the reason for using a line graph to express the results of this study?
فتح الحزمة
افتح القفل للوصول البطاقات البالغ عددها 69 في هذه المجموعة.
فتح الحزمة
k this deck
51
What is a hypothesis? What are the steps involved in following the scientific method? How does one distinguish the dependent variable from the independent variable in an experiment? How are each of these represented on a graph?
فتح الحزمة
افتح القفل للوصول البطاقات البالغ عددها 69 في هذه المجموعة.
فتح الحزمة
k this deck
52
Provide an example of a control system.Be sure to include the three main components: an input signal, a controller, and an output signal.
فتح الحزمة
افتح القفل للوصول البطاقات البالغ عددها 69 في هذه المجموعة.
فتح الحزمة
k this deck
53
High cholesterol levels have been shown to be a contributing factor to heart disease and death due to cardiovascular disease for many decades.In the 1970s, scientists used this information to develop a hypothesis that giving a medicine to reduce blood cholesterol levels could reduce the chances of developing cardiovascular disease or dying from cardiovascular disease.They tested a group of people living in a town called Framingham, Massachusetts.This study became known as the Framingham Study, and it is very well known because it did not support the hypothesis that giving cholesterol-lowering medications would reduce the risk of developing or dying from cardiovascular disease.Does this mean that high cholesterol is not a risk factor for heart disease? What does this demonstrate about the scientific process, especially as it pertains to human studies? You can find a copy of the study online and read it, if necessary.
فتح الحزمة
افتح القفل للوصول البطاقات البالغ عددها 69 في هذه المجموعة.
فتح الحزمة
k this deck
54
Table 1.1
Figure 1.1
Use the table and graph below to answer the following questions.
Summarize the data shown in Figure 1.2.
Figure 1.1
Use the table and graph below to answer the following questions.
Summarize the data shown in Figure 1.2.
فتح الحزمة
افتح القفل للوصول البطاقات البالغ عددها 69 في هذه المجموعة.
فتح الحزمة
k this deck
55
Table 1.1
Figure 1.1
Use the table and graph below to answer the following questions.
Referring to Figure 1.2, at approximately what age do men begin to show higher systolic blood pressures than women? At what age does this trend reverse?
Figure 1.1
Use the table and graph below to answer the following questions.
Referring to Figure 1.2, at approximately what age do men begin to show higher systolic blood pressures than women? At what age does this trend reverse?
فتح الحزمة
افتح القفل للوصول البطاقات البالغ عددها 69 في هذه المجموعة.
فتح الحزمة
k this deck
56
Write a teleological explanation for why heart rate increases during exercise.Now write a mechanistic explanation for the same phenomenon.
فتح الحزمة
افتح القفل للوصول البطاقات البالغ عددها 69 في هذه المجموعة.
فتح الحزمة
k this deck
57
Table 1.1
Figure 1.1
Use the table and graph below to answer the following questions.
Referring to Table 1.2, what general trend in systolic blood pressures is seen as both men and women increase in age?
Figure 1.1
Use the table and graph below to answer the following questions.
Referring to Table 1.2, what general trend in systolic blood pressures is seen as both men and women increase in age?
فتح الحزمة
افتح القفل للوصول البطاقات البالغ عددها 69 في هذه المجموعة.
فتح الحزمة
k this deck
58
You are designing a study to assess the effects of a new drug treatment for hypertension.In your study of this drug's efficacy in treating hypertension, your subjects are white males, ages 40 to 60 years.Is your study applicable to all people? Explain.
فتح الحزمة
افتح القفل للوصول البطاقات البالغ عددها 69 في هذه المجموعة.
فتح الحزمة
k this deck
59
You are doing an experiment to determine if caffeine consumption affects reaction time.
A.Which is the dependent variable?
B.Which is the independent variable?
C.Briefly describe some ways you might manipulate the independent variable.
D.Name three stimuli you could use, and how you might measure reaction time for each.
E.Write an appropriate hypothesis for this study.
F.You compute the following average values from your experiment.What would be a logical conclusion for these data?
Average caffeine consumer's reaction time: 400 ms
Average noncaffeine consumer's reaction time: 650 ms
G.Sketch a simple graph to convey these results to your classmates.What kind of graph did you choose? Why? Which variable did you plot on the x-axis? Which one did you plot on the y-axis? Why?
H.Do the results of this experiment support the hypothesis you chose?
فتح الحزمة
افتح القفل للوصول البطاقات البالغ عددها 69 في هذه المجموعة.
فتح الحزمة
k this deck
60
Explain why animals are used in research.Are there any limitations to the application of animal data to human physiology? Could these limitations be addressed using cell or tissue culture, or computer simulations?
فتح الحزمة
افتح القفل للوصول البطاقات البالغ عددها 69 في هذه المجموعة.
فتح الحزمة
k this deck
61
Following is a table of data collected from one section of an 8 a.m.physiology lab.There were 20 students present, 10 men and 10 women.Information collected from the students included their height, weight, age, gender, and resting pulse rate.In addition, the students were surveyed to see if they smoked cigarettes, considered themselves "regular exercisers," if they had consumed caffeine the morning of the lab, and if they had eaten breakfast that day.A "y" or "n" (yes or no) was recorded to indicate their answers.Each student did "jumping jacks" for 5 minutes and recorded the time required to regain their resting heart rate, which is listed on the table as "recovery time." Finally, each student participated in an exercise designed to measure their reaction time (in milliseconds) in catching an object dropped by a lab partner according to specified criteria.Use this table to answer the following questions.Ignore statistical problems caused by small sample size, and so on.
Table 1.3
Figure 1.3
For these questions, the data were separated and analyzed by gender.
Refer to Table 1.3.
A.Disregarding gender, write a hypothesis that expresses the relationship between weight and height.
B.What is the dependent variable? What is the independent variable?
C.From the data in Table 1.3, construct a graph that examines this relationship.
فتح الحزمة
افتح القفل للوصول البطاقات البالغ عددها 69 في هذه المجموعة.
فتح الحزمة
k this deck
62
Following is a table of data collected from one section of an 8 a.m.physiology lab.There were 20 students present, 10 men and 10 women.Information collected from the students included their height, weight, age, gender, and resting pulse rate.In addition, the students were surveyed to see if they smoked cigarettes, considered themselves "regular exercisers," if they had consumed caffeine the morning of the lab, and if they had eaten breakfast that day.A "y" or "n" (yes or no) was recorded to indicate their answers.Each student did "jumping jacks" for 5 minutes and recorded the time required to regain their resting heart rate, which is listed on the table as "recovery time." Finally, each student participated in an exercise designed to measure their reaction time (in milliseconds) in catching an object dropped by a lab partner according to specified criteria.Use this table to answer the following questions.Ignore statistical problems caused by small sample size, and so on.
Table 1.3
Figure 1.3
For these questions, the data were separated and analyzed by gender.
Refer to Table 1.3.
A.Write a hypothesis regarding gender and recovery time.
B.What is the dependent variable? What is the independent variable?
C.Create a graph using the averages from the data table.Based on these data, what do you conclude?
فتح الحزمة
افتح القفل للوصول البطاقات البالغ عددها 69 في هذه المجموعة.
فتح الحزمة
k this deck
63
________ are kept within normal range by physiological control mechanisms which are used if the variable strays too far from its ________.
A) Setpoints, regulated variable
B) Independent variables, steady state
C) Regulated variables, setpoint
D) Dependent variables, lowest value
E) Steady state values, integrating center
A) Setpoints, regulated variable
B) Independent variables, steady state
C) Regulated variables, setpoint
D) Dependent variables, lowest value
E) Steady state values, integrating center
فتح الحزمة
افتح القفل للوصول البطاقات البالغ عددها 69 في هذه المجموعة.
فتح الحزمة
k this deck
64
Following is a table of data collected from one section of an 8 a.m.physiology lab.There were 20 students present, 10 men and 10 women.Information collected from the students included their height, weight, age, gender, and resting pulse rate.In addition, the students were surveyed to see if they smoked cigarettes, considered themselves "regular exercisers," if they had consumed caffeine the morning of the lab, and if they had eaten breakfast that day.A "y" or "n" (yes or no) was recorded to indicate their answers.Each student did "jumping jacks" for 5 minutes and recorded the time required to regain their resting heart rate, which is listed on the table as "recovery time." Finally, each student participated in an exercise designed to measure their reaction time (in milliseconds) in catching an object dropped by a lab partner according to specified criteria.Use this table to answer the following questions.Ignore statistical problems caused by small sample size, and so on.
Table 1.3
Figure 1.3
For these questions, the data were separated and analyzed by gender.
Refer to Table 1.3.
A.Write a hypothesis regarding the effects of breakfast consumption on reaction time.
B.What is the dependent variable? What is the independent variable?
Table 1.3
Figure 1.3
For these questions, the data were separated and analyzed by gender.
Refer to Table 1.3.
A.Write a hypothesis regarding the effects of breakfast consumption on reaction time.
B.What is the dependent variable? What is the independent variable?
فتح الحزمة
افتح القفل للوصول البطاقات البالغ عددها 69 في هذه المجموعة.
فتح الحزمة
k this deck
65
Following is a table of data collected from one section of an 8 a.m.physiology lab.There were 20 students present, 10 men and 10 women.Information collected from the students included their height, weight, age, gender, and resting pulse rate.In addition, the students were surveyed to see if they smoked cigarettes, considered themselves "regular exercisers," if they had consumed caffeine the morning of the lab, and if they had eaten breakfast that day.A "y" or "n" (yes or no) was recorded to indicate their answers.Each student did "jumping jacks" for 5 minutes and recorded the time required to regain their resting heart rate, which is listed on the table as "recovery time." Finally, each student participated in an exercise designed to measure their reaction time (in milliseconds) in catching an object dropped by a lab partner according to specified criteria.Use this table to answer the following questions.Ignore statistical problems caused by small sample size, and so on.
Table 1.3
Figure 1.3
For these questions, the data were separated and analyzed by gender.
Table 1.3 shows data on various factors that may or may not be related to resting pulse rate, time to recovery to resting pulse rate after a few minutes of exercise, and reaction time measured by how quickly a student could press a keyboard key after seeing a computer-generated prompt.For each question below, write a testable hypothesis, identify the dependent and independent variables, sketch an appropriate graph of the results, and draw a conclusion from the data presented in the table.Discuss your results.
A.Does caffeine consumption have an effect on resting pulse rate?
B.Does age play a role in resting pulse rate? Does weight?
C.Is there a relationship between eating breakfast and recovery time?
D.Is there a relationship between reaction time and height?
E.Do women who smoke show differences in their resting pulse rates compared to female nonsmokers or to male smokers and nonsmokers?
F.Does regular exercise have an effect on resting pulse rate?
فتح الحزمة
افتح القفل للوصول البطاقات البالغ عددها 69 في هذه المجموعة.
فتح الحزمة
k this deck
66
The vasodilation of blood vessels surrounding muscles due to the production of carbon dioxide during exercise is an example of which of the following?
A) neural control
B) long-distance control
C) reflex control
D) local control
E) hormonal control
A) neural control
B) long-distance control
C) reflex control
D) local control
E) hormonal control
فتح الحزمة
افتح القفل للوصول البطاقات البالغ عددها 69 في هذه المجموعة.
فتح الحزمة
k this deck
67
The law of mass balance states:
A) if a substance is to remain constant any gain must be offset by an equal loss.
B) that homeostasis can be maintained when the load of a substance is continuously lost.
C) if one is to survive they must have a certain amount of mass.
D) that all matter is neither created or destroyed.
E) that all substances in the body have equal mass.
فتح الحزمة
افتح القفل للوصول البطاقات البالغ عددها 69 في هذه المجموعة.
فتح الحزمة
k this deck
68
Which of the following are used to keep our systems at or near their setpoints?
A) positive feedback loops
B) response loops
C) feedback loops
D) open control loops
E) feedforward control loop
A) positive feedback loops
B) response loops
C) feedback loops
D) open control loops
E) feedforward control loop
فتح الحزمة
افتح القفل للوصول البطاقات البالغ عددها 69 في هذه المجموعة.
فتح الحزمة
k this deck
69
Mass balance involves determining the total amount of a substance in the body.We can determine the rate of production (i.e.Mass Flow)of this substance by which of the following formulas?
A) intake + production - excretion - metabolism.
B) (amount of substance / min) × (concentration of the substance)
C) volume of flow / (amount of substance / min)
D) (concentration of a substance) / volume flow
E) (concentration of a substance) × (volume/min)
A) intake + production - excretion - metabolism.
B) (amount of substance / min) × (concentration of the substance)
C) volume of flow / (amount of substance / min)
D) (concentration of a substance) / volume flow
E) (concentration of a substance) × (volume/min)
فتح الحزمة
افتح القفل للوصول البطاقات البالغ عددها 69 في هذه المجموعة.
فتح الحزمة
k this deck
فتح الحزمة
افتح القفل للوصول البطاقات البالغ عددها 69 في هذه المجموعة.


