Deck 3: Randomness in Data
ملء الشاشة (f)
سؤال
سؤال
سؤال
سؤال
سؤال
سؤال
سؤال
سؤال
سؤال
سؤال
سؤال
سؤال
سؤال
سؤال
سؤال
سؤال
سؤال
سؤال
سؤال
سؤال
سؤال
سؤال
سؤال
سؤال
سؤال
سؤال
سؤال
سؤال
سؤال
سؤال
سؤال
سؤال
سؤال
سؤال
سؤال
سؤال
سؤال
سؤال
سؤال
سؤال
سؤال
سؤال
سؤال
سؤال
سؤال
سؤال
سؤال
سؤال
Suppose a phone company reports that the average duration of a cell phone call is 1.7 minutes with a standard deviation of 1.4 minutes.
-Would "the sampling distribution of the average duration call will approximately follow a normal distribution with mean 1.7 minutes and standard deviation or 0.181 minutes. and Note: The sample size is greater than 30 , so you are willing to assume the shape will be approximately normal, even though the population distribution is most plausibly skewed to the right. This is appropriate as long as the skewness is not too severe. " be larger, smaller, or the same if the sample size were 40 calls rather than 60 calls? Explain briefly.
-Would "the sampling distribution of the average duration call will approximately follow a normal distribution with mean 1.7 minutes and standard deviation or 0.181 minutes. and Note: The sample size is greater than 30 , so you are willing to assume the shape will be approximately normal, even though the population distribution is most plausibly skewed to the right. This is appropriate as long as the skewness is not too severe.
" be larger, smaller, or the same if the sample size were 40 calls rather than 60 calls? Explain briefly. سؤال
Suppose a phone company reports that the average duration of a cell phone call is 1.7 minutes with a standard deviation of 1.4 minutes.
-Would "the sampling distribution of the average duration call will approximately follow a normal distribution with mean 1.7 minutes and standard deviation or 0.181 minutes. and Note: The sample size is greater than 30 , so you are willing to assume the shape will be approximately normal, even though the population distribution is most plausibly skewed to the right. This is appropriate as long as the skewness is not too severe. " be larger, smaller, or the same if the (population) average duration were 1.9 minutes rather than 1.7 minutes? Explain briefly.
-Would "the sampling distribution of the average duration call will approximately follow a normal distribution with mean 1.7 minutes and standard deviation or 0.181 minutes. and Note: The sample size is greater than 30 , so you are willing to assume the shape will be approximately normal, even though the population distribution is most plausibly skewed to the right. This is appropriate as long as the skewness is not too severe.
" be larger, smaller, or the same if the (population) average duration were 1.9 minutes rather than 1.7 minutes? Explain briefly. سؤال
Suppose a phone company reports that the average duration of a cell phone call is 1.7 minutes with a standard deviation of 1.4 minutes.
-Would "the sampling distribution of the average duration call will approximately follow a normal distribution with mean 1.7 minutes and standard deviation or 0.181 minutes. and Note: The sample size is greater than 30 , so you are willing to assume the shape will be approximately normal, even though the population distribution is most plausibly skewed to the right. This is appropriate as long as the skewness is not too severe.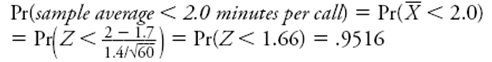 " be larger, smaller, or the same if the (population) standard deviation of call durations were 1.8 minutes rather than 1.4 minutes? Explain briefly.
-Would "the sampling distribution of the average duration call will approximately follow a normal distribution with mean 1.7 minutes and standard deviation or 0.181 minutes. and Note: The sample size is greater than 30 , so you are willing to assume the shape will be approximately normal, even though the population distribution is most plausibly skewed to the right. This is appropriate as long as the skewness is not too severe.
" be larger, smaller, or the same if the (population) standard deviation of call durations were 1.8 minutes rather than 1.4 minutes? Explain briefly. سؤال
سؤال
سؤال
سؤال
سؤال
سؤال
سؤال
سؤال
سؤال
Suppose that you have a probability of winning a game of solitaire, which remains the same in every game regardless of what happens in prior games. You decide to play games repeatedly until you win twice. You want to know the probability that you will need to play 10 games or fewer in order to achieve your goal of winning twice.
a. Describe how you could use a fair, six-sided die to simulate this process.
Now consider the following histogram that results from simulating this process 500 times: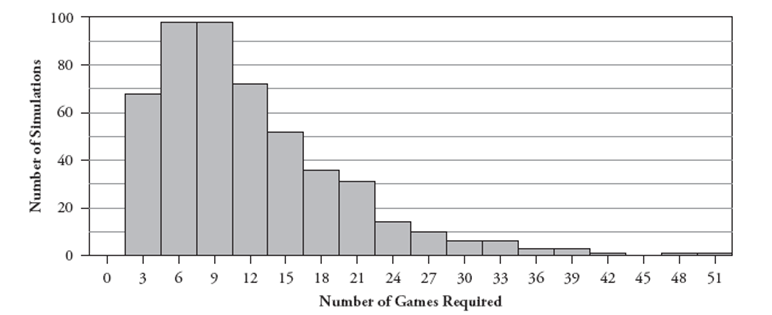 b. Use these simulation results to approximate the probability that you will finish in ten or fewer games.
a. Describe how you could use a fair, six-sided die to simulate this process.
Now consider the following histogram that results from simulating this process 500 times:
b. Use these simulation results to approximate the probability that you will finish in ten or fewer games. سؤال
سؤال

فتح الحزمة
قم بالتسجيل لفتح البطاقات في هذه المجموعة!
Unlock Deck
Unlock Deck
1/61
العب
ملء الشاشة (f)
Deck 3: Randomness in Data
1
Suppose that a family has five children, consisting of three girls and two boys. Call the girls Abigail, Brianna, and Courtney; call the boys Duane and Evan. Suppose further that two of these children are to be selected at random.
-List the sample space of all possible pairs of these five children.
-List the sample space of all possible pairs of these five children.
Using their first initial, you have 10 possible pairs:
2
Suppose that a family has five children, consisting of three girls and two boys. Call the girls Abigail, Brianna, and Courtney; call the boys Duane and Evan. Suppose further that two of these children are to be selected at random.
-Determine the probability that one child of each gender will be selected.
-Determine the probability that one child of each gender will be selected.
(one boy and one girl . You can calculate the probability this way because the 10 possible pairs are equally likely and you are choosing them at random.
3
Suppose that a family has five children, consisting of three girls and two boys. Call the girls Abigail, Brianna, and Courtney; call the boys Duane and Evan. Suppose further that two of these children are to be selected at random.
-Determine the expected value of the number of girls who will be selected.
-Determine the expected value of the number of girls who will be selected.
To determine the expected value for the number of girls, you see there is a 3 probability of 2 girls being selected, a . 6 probability of 1 girl being selected, and a . 1 probability of no girls being selected. So, the expected value is girls.
4
Suppose that a family has five children, consisting of three girls and two boys. Call the girls Abigail, Brianna, and Courtney; call the boys Duane and Evan. Suppose further that two of these children are to be selected at random.
-Write a sentence or two interpreting what this expected value means in this context
-Write a sentence or two interpreting what this expected value means in this context
فتح الحزمة
افتح القفل للوصول البطاقات البالغ عددها 61 في هذه المجموعة.
فتح الحزمة
k this deck
5
Suppose that a family has five children, consisting of three girls and two boys. Call the girls Abigail, Brianna, and Courtney; call the boys Duane and Evan. Suppose further that two of these children are to be selected at random.
-If both boys are selected, would it be reasonable for the girls to cry foul and claim that the selection process must not have been random? Explain your answer, and refer to a relevant probability calculation.
-If both boys are selected, would it be reasonable for the girls to cry foul and claim that the selection process must not have been random? Explain your answer, and refer to a relevant probability calculation.
فتح الحزمة
افتح القفل للوصول البطاقات البالغ عددها 61 في هذه المجموعة.
فتح الحزمة
k this deck
6
Give brief (one-sentence) explanations for your answers to the following.
-If you flip a fair coin (i.e., a coin with .5 probability of landing heads) twice, are you guaranteed to get one head and one tail?
-If you flip a fair coin (i.e., a coin with .5 probability of landing heads) twice, are you guaranteed to get one head and one tail?
فتح الحزمة
افتح القفل للوصول البطاقات البالغ عددها 61 في هذه المجموعة.
فتح الحزمة
k this deck
7
Give brief (one-sentence) explanations for your answers to the following.
-If you flip a fair coin five times and happen to get all heads, are you more likely to get a tail on the next flip?
-If you flip a fair coin five times and happen to get all heads, are you more likely to get a tail on the next flip?
فتح الحزمة
افتح القفل للوصول البطاقات البالغ عددها 61 في هذه المجموعة.
فتح الحزمة
k this deck
8
Give brief (one-sentence) explanations for your answers to the following.
-In which case are you more likely to get all heads from flipping a fair coin: if you flip a fair coin twice or if you flip a fair coin ten times?
-In which case are you more likely to get all heads from flipping a fair coin: if you flip a fair coin twice or if you flip a fair coin ten times?
فتح الحزمة
افتح القفل للوصول البطاقات البالغ عددها 61 في هذه المجموعة.
فتح الحزمة
k this deck
9
Give brief (one-sentence) explanations for your answers to the following.
-In which case is it more likely for the proportion of heads to be close to one-half: if you flip a fair coin twice or if you flip a fair coin 200 times?
-In which case is it more likely for the proportion of heads to be close to one-half: if you flip a fair coin twice or if you flip a fair coin 200 times?
فتح الحزمة
افتح القفل للوصول البطاقات البالغ عددها 61 في هذه المجموعة.
فتح الحزمة
k this deck
10
Give brief (one-sentence) explanations for your answers to the following.
-Suppose that you repeat a random process with two possible outcomes (such as flipping a coin and observing whether it lands heads or tails, or tossing a thumbtack and seeing whether it lands up or down, or playing a game of solitaire and seeing whether you win or lose) a large number of times. Is it always legitimate to say that the proportion of times that any one particular outcome occurs will be very close to one-half? Explain.
-Suppose that you repeat a random process with two possible outcomes (such as flipping a coin and observing whether it lands heads or tails, or tossing a thumbtack and seeing whether it lands up or down, or playing a game of solitaire and seeing whether you win or lose) a large number of times. Is it always legitimate to say that the proportion of times that any one particular outcome occurs will be very close to one-half? Explain.
فتح الحزمة
افتح القفل للوصول البطاقات البالغ عددها 61 في هذه المجموعة.
فتح الحزمة
k this deck
11
Suppose that a tire manufacturer believes that the lifetimes of its tires follow a normal distribution with mean 48,000 miles and standard deviation 5,000 miles.
-Produce a well-labeled sketch of this normal distribution.
-Produce a well-labeled sketch of this normal distribution.
فتح الحزمة
افتح القفل للوصول البطاقات البالغ عددها 61 في هذه المجموعة.
فتح الحزمة
k this deck
12
Suppose that a tire manufacturer believes that the lifetimes of its tires follow a normal distribution with mean 48,000 miles and standard deviation 5,000 miles.
-Determine the -score corresponding to 55,000 miles.
-Determine the -score corresponding to 55,000 miles.
فتح الحزمة
افتح القفل للوصول البطاقات البالغ عددها 61 في هذه المجموعة.
فتح الحزمة
k this deck
13
Suppose that a tire manufacturer believes that the lifetimes of its tires follow a normal distribution with mean 48,000 miles and standard deviation 5,000 miles.
-Determine the probability that a randomly selected tire lasts for more than 55,000 miles.
-Determine the probability that a randomly selected tire lasts for more than 55,000 miles.
فتح الحزمة
افتح القفل للوصول البطاقات البالغ عددها 61 في هذه المجموعة.
فتح الحزمة
k this deck
14
Suppose that a tire manufacturer believes that the lifetimes of its tires follow a normal distribution with mean 48,000 miles and standard deviation 5,000 miles.
-If the manufacturer wants to issue a guarantee so that of its tires last for longer than the guaranteed lifetime, what -score should it use to determine that guaranteed lifetime?
-If the manufacturer wants to issue a guarantee so that of its tires last for longer than the guaranteed lifetime, what -score should it use to determine that guaranteed lifetime?
فتح الحزمة
افتح القفل للوصول البطاقات البالغ عددها 61 في هذه المجموعة.
فتح الحزمة
k this deck
15
Suppose that a tire manufacturer believes that the lifetimes of its tires follow a normal distribution with mean 48,000 miles and standard deviation 5,000 miles.
-If the manufacturer wants to issue a guarantee so that of its tires last for longer than the guaranteed lifetime, how many miles should it advertise as its guaranteed lifetime?
-If the manufacturer wants to issue a guarantee so that of its tires last for longer than the guaranteed lifetime, how many miles should it advertise as its guaranteed lifetime?
فتح الحزمة
افتح القفل للوصول البطاقات البالغ عددها 61 في هذه المجموعة.
فتح الحزمة
k this deck
16
Suppose the number of French fries in a small bag at a particular fast-food restaurant follows a normal model with mean 49 fries and standard deviation 5 fries.
-Use this model to estimate the proportion of the bags that contain at least 40 fries.
-Use this model to estimate the proportion of the bags that contain at least 40 fries.
فتح الحزمة
افتح القفل للوصول البطاقات البالغ عددها 61 في هذه المجموعة.
فتح الحزمة
k this deck
17
Suppose the number of French fries in a small bag at a particular fast-food restaurant follows a normal model with mean 49 fries and standard deviation 5 fries.
-Use this model to estimate the proportion of the bags that contain 50 or fewer fries.
-Use this model to estimate the proportion of the bags that contain 50 or fewer fries.
فتح الحزمة
افتح القفل للوصول البطاقات البالغ عددها 61 في هذه المجموعة.
فتح الحزمة
k this deck
18
Suppose the number of French fries in a small bag at a particular fast-food restaurant follows a normal model with mean 49 fries and standard deviation 5 fries.
-The restaurant could advertise that of its bags contain at least how many fries?
-The restaurant could advertise that of its bags contain at least how many fries?
فتح الحزمة
افتح القفل للوصول البطاقات البالغ عددها 61 في هذه المجموعة.
فتح الحزمة
k this deck
19
Suppose the number of French fries in a small bag at a particular fast-food restaurant follows a normal model with mean 49 fries and standard deviation 5 fries.
-If the restaurant wants to increase the probability in "the proportion of the bags that contain at least 40 fries" by changing the mean, should it increase or decrease the mean? Explain intuitively, including a sketch but no calculations.
-If the restaurant wants to increase the probability in "the proportion of the bags that contain at least 40 fries" by changing the mean, should it increase or decrease the mean? Explain intuitively, including a sketch but no calculations.
فتح الحزمة
افتح القفل للوصول البطاقات البالغ عددها 61 في هذه المجموعة.
فتح الحزمة
k this deck
20
Suppose the number of French fries in a small bag at a particular fast-food restaurant follows a normal model with mean 49 fries and standard deviation 5 fries.
-If the restaurant wants to increase the probability in "the proportion of the bags that contain at least 40 fries" by changing the standard deviation, should it increase or decrease the standard deviation? Explain intuitively, including a sketch but no calculations.
-If the restaurant wants to increase the probability in "the proportion of the bags that contain at least 40 fries" by changing the standard deviation, should it increase or decrease the standard deviation? Explain intuitively, including a sketch but no calculations.
فتح الحزمة
افتح القفل للوصول البطاقات البالغ عددها 61 في هذه المجموعة.
فتح الحزمة
k this deck
21
According to the "quick facts" listed on Cal Poly's website in fall 2011, the proportion of Cal Poly undergraduates who are in the College of Business is. Suppose that you select a simple random sample of 150 Cal Poly undergraduates, and let represent the sample proportion who are in the College of Business.
-Describe the (approximate) sampling distribution of . Be sure to refer to shape, center, and variability.
-Describe the (approximate) sampling distribution of . Be sure to refer to shape, center, and variability.
فتح الحزمة
افتح القفل للوصول البطاقات البالغ عددها 61 في هذه المجموعة.
فتح الحزمة
k this deck
22
According to the "quick facts" listed on Cal Poly's website in fall 2011, the proportion of Cal Poly undergraduates who are in the College of Business is. Suppose that you select a simple random sample of 150 Cal Poly undergraduates, and let represent the sample proportion who are in the College of Business.
-Provide a well-labeled sketch to illustrate this sampling distribution.
-Provide a well-labeled sketch to illustrate this sampling distribution.
فتح الحزمة
افتح القفل للوصول البطاقات البالغ عددها 61 في هذه المجموعة.
فتح الحزمة
k this deck
23
According to the "quick facts" listed on Cal Poly's website in fall 2011, the proportion of Cal Poly undergraduates who are in the College of Business is. Suppose that you select a simple random sample of 150 Cal Poly undergraduates, and let represent the sample proportion who are in the College of Business.
-Check the conditions for whether the normal approximation (CLT) is reasonable to apply in this case.
-Check the conditions for whether the normal approximation (CLT) is reasonable to apply in this case.
فتح الحزمة
افتح القفل للوصول البطاقات البالغ عددها 61 في هذه المجموعة.
فتح الحزمة
k this deck
24
According to the "quick facts" listed on Cal Poly's website in fall 2011, the proportion of Cal Poly undergraduates who are in the College of Business is. Suppose that you select a simple random sample of 150 Cal Poly undergraduates, and let represent the sample proportion who are in the College of Business.
-Determine the (approximate) probability that less than of the sample would be in the College of Business.
-Determine the (approximate) probability that less than of the sample would be in the College of Business.
فتح الحزمة
افتح القفل للوصول البطاقات البالغ عددها 61 في هذه المجموعة.
فتح الحزمة
k this deck
25
According to the "quick facts" listed on Cal Poly's website in fall 2011, the proportion of Cal Poly undergraduates who are in the College of Business is. Suppose that you select a simple random sample of 150 Cal Poly undergraduates, and let represent the sample proportion who are in the College of Business.
-With a larger sample size, would the probability in #4 be larger, smaller, or the same? Explain your answer.
-With a larger sample size, would the probability in #4 be larger, smaller, or the same? Explain your answer.
فتح الحزمة
افتح القفل للوصول البطاقات البالغ عددها 61 في هذه المجموعة.
فتح الحزمة
k this deck
26
Reconsider the activities involving the sampling of Reese's Pieces candies. Continue to suppose that of all Reese's Pieces are orange.
-Is . 45 a parameter or a statistic? What symbol would you use to represent it?
-Is . 45 a parameter or a statistic? What symbol would you use to represent it?
فتح الحزمة
افتح القفل للوصول البطاقات البالغ عددها 61 في هذه المجموعة.
فتح الحزمة
k this deck
27
Reconsider the activities involving the sampling of Reese's Pieces candies. Continue to suppose that of all Reese's Pieces are orange.
-Does sampling variability refer to a statistic, a parameter, or both?
-Does sampling variability refer to a statistic, a parameter, or both?
فتح الحزمة
افتح القفل للوصول البطاقات البالغ عددها 61 في هذه المجموعة.
فتح الحزمة
k this deck
28
Reconsider the activities involving the sampling of Reese's Pieces candies. Continue to suppose that of all Reese's Pieces are orange.
-Are you more likely to get between and orange candies if you take a random sample of 40 candies or a random sample of 400 candies? Explain briefly.
-Are you more likely to get between and orange candies if you take a random sample of 40 candies or a random sample of 400 candies? Explain briefly.
فتح الحزمة
افتح القفل للوصول البطاقات البالغ عددها 61 في هذه المجموعة.
فتح الحزمة
k this deck
29
Reconsider the activities involving the sampling of Reese's Pieces candies. Continue to suppose that of all Reese's Pieces are orange.
-Are you more likely to get more than orange candies if you take a random sample of 40 candies or a random sample of 400 candies? Explain briefly.
Now suppose that 20 people each take a random sample of 40 candies, calculate the sample proportion of orange candies, and create a dotplot of their results.
فتح الحزمة
افتح القفل للوصول البطاقات البالغ عددها 61 في هذه المجموعة.
فتح الحزمة
k this deck
30
Reconsider the activities involving the sampling of Reese's Pieces candies. Continue to suppose that of all Reese's Pieces are orange.
-Identify the observational units and variable of this dotplot.
-Identify the observational units and variable of this dotplot.
فتح الحزمة
افتح القفل للوصول البطاقات البالغ عددها 61 في هذه المجموعة.
فتح الحزمة
k this deck
31
Suppose that a phone company reports that the average duration of a cell phone call is 1.7 minutes, with a standard deviation of 1.4 minutes.
-Would it be reasonable to use a normal distribution to model the duration of cell phone calls? Explain, based primarily on the values reported above.
-Would it be reasonable to use a normal distribution to model the duration of cell phone calls? Explain, based primarily on the values reported above.
فتح الحزمة
افتح القفل للوصول البطاقات البالغ عددها 61 في هذه المجموعة.
فتح الحزمة
k this deck
32
Suppose that a phone company reports that the average duration of a cell phone call is 1.7 minutes, with a standard deviation of 1.4 minutes.
-Suppose you want to examine a random sample of 60 cell phone calls. Do you think it would be reasonable to use the Central Limit Theorem to describe the sampling distribution of the sample mean call duration? Explain.
-Suppose you want to examine a random sample of 60 cell phone calls. Do you think it would be reasonable to use the Central Limit Theorem to describe the sampling distribution of the sample mean call duration? Explain.
فتح الحزمة
افتح القفل للوصول البطاقات البالغ عددها 61 في هذه المجموعة.
فتح الحزمة
k this deck
33
Suppose that a phone company reports that the average duration of a cell phone call is 1.7 minutes, with a standard deviation of 1.4 minutes.
-What does the CLT say about the sampling distribution of the sample mean call duration in a random sample of 60 calls?
-What does the CLT say about the sampling distribution of the sample mean call duration in a random sample of 60 calls?
فتح الحزمة
افتح القفل للوصول البطاقات البالغ عددها 61 في هذه المجموعة.
فتح الحزمة
k this deck
34
Suppose that a phone company reports that the average duration of a cell phone call is 1.7 minutes, with a standard deviation of 1.4 minutes.
-Draw a well-labeled sketch to "The CLT says the sampling distribution of the sample mean call duration will be approximately normal, with mean 1.7 minutes and standard deviation ".
-Draw a well-labeled sketch to "The CLT says the sampling distribution of the sample mean call duration will be approximately normal, with mean 1.7 minutes and standard deviation ".
فتح الحزمة
افتح القفل للوصول البطاقات البالغ عددها 61 في هذه المجموعة.
فتح الحزمة
k this deck
35
Suppose that a phone company reports that the average duration of a cell phone call is 1.7 minutes, with a standard deviation of 1.4 minutes.
-Describe how the sketch would change if the sample size were 160 calls rather than 60 calls.
-Describe how the sketch would change if the sample size were 160 calls rather than 60 calls.
فتح الحزمة
افتح القفل للوصول البطاقات البالغ عددها 61 في هذه المجموعة.
فتح الحزمة
k this deck
36
In general, which vary more: averages or individual observations?
فتح الحزمة
افتح القفل للوصول البطاقات البالغ عددها 61 في هذه المجموعة.
فتح الحزمة
k this deck
37
Give an intuitive explanation for "In general, individual observations vary more than averages".
فتح الحزمة
افتح القفل للوصول البطاقات البالغ عددها 61 في هذه المجموعة.
فتح الحزمة
k this deck
38
Which vary more: averages based on a few observations or averages based on many observations?
فتح الحزمة
افتح القفل للوصول البطاقات البالغ عددها 61 في هذه المجموعة.
فتح الحزمة
k this deck
39
Give an intuitive explanation for "Averages based on many observations vary less than averages based on a few observations".
فتح الحزمة
افتح القفل للوصول البطاقات البالغ عددها 61 في هذه المجموعة.
فتح الحزمة
k this deck
40
Give a mathematical explanation for "Averages based on many observations vary less than averages based on a few observations." based on the Central Limit Theorem. In other words, what aspect of the CLT justifies "Averages based on many observations vary less than averages based on a few observations.", and how does that aspect justify it?
فتح الحزمة
افتح القفل للوصول البطاقات البالغ عددها 61 في هذه المجموعة.
فتح الحزمة
k this deck
41
Suppose of the incoming email messages for a college's computer system are spam.
-Use the CLT to approximate the probability that in a random sample of 200 incoming email messages at this college, the sample proportion of these messages that are spam would exceed .75.
-Use the CLT to approximate the probability that in a random sample of 200 incoming email messages at this college, the sample proportion of these messages that are spam would exceed .75.
فتح الحزمة
افتح القفل للوصول البطاقات البالغ عددها 61 في هذه المجموعة.
فتح الحزمة
k this deck
42
Suppose of the incoming email messages for a college's computer system are spam.
-Display your answer "Because you are considering a large sample size, the Central Limit Theorem predicts the sampling distribution of sample proportions of messages that are spam is approximately normal, centered at 80 with standard deviation or .0283 . So the -score for a proportion of .75 equals or -1.77 . The probability lying to the right (exceeding .75) equals .9616." as a shaded area in a well-labeled sketch.
-Display your answer "Because you are considering a large sample size, the Central Limit Theorem predicts the sampling distribution of sample proportions of messages that are spam is approximately normal, centered at 80 with standard deviation or .0283 . So the -score for a proportion of .75 equals or -1.77 . The probability lying to the right (exceeding .75) equals .9616." as a shaded area in a well-labeled sketch.
فتح الحزمة
افتح القفل للوصول البطاقات البالغ عددها 61 في هذه المجموعة.
فتح الحزمة
k this deck
43
Suppose of the incoming email messages for a college's computer system are spam.
-After implementing a new spam blocker, if it turns out that a random sample of 200 messages contains spam, would this constitute fairly convincing evidence that the (population) percentage of spam has been reduced from ? Explain, based on your calculation in question "Use the CLT to approximate the probability that in a random sample of 200 incoming email messages at this college, the sample proportion of these messages that are spam would exceed .75.".
-After implementing a new spam blocker, if it turns out that a random sample of 200 messages contains spam, would this constitute fairly convincing evidence that the (population) percentage of spam has been reduced from ? Explain, based on your calculation in question "Use the CLT to approximate the probability that in a random sample of 200 incoming email messages at this college, the sample proportion of these messages that are spam would exceed .75.".
فتح الحزمة
افتح القفل للوصول البطاقات البالغ عددها 61 في هذه المجموعة.
فتح الحزمة
k this deck
44
Suppose of the incoming email messages for a college's computer system are spam.
-Would your answer "Because you are considering a large sample size, the Central Limit Theorem predicts the sampling distribution of sample proportions of messages that are spam is approximately normal, centered at 80 with standard deviation or .0283 . So the -score for a proportion of .75 equals or -1.77 . The probability lying to the right (exceeding .75) equals .9616." be larger, smaller, or the same if the sample size were 100 messages rather than 200 messages? Explain briefly.
-Would your answer "Because you are considering a large sample size, the Central Limit Theorem predicts the sampling distribution of sample proportions of messages that are spam is approximately normal, centered at 80 with standard deviation or .0283 . So the -score for a proportion of .75 equals or -1.77 . The probability lying to the right (exceeding .75) equals .9616." be larger, smaller, or the same if the sample size were 100 messages rather than 200 messages? Explain briefly.
فتح الحزمة
افتح القفل للوصول البطاقات البالغ عددها 61 في هذه المجموعة.
فتح الحزمة
k this deck
45
Suppose of the incoming email messages for a college's computer system are spam.
-Would your answer to "Because you are considering a large sample size, the Central Limit Theorem predicts the sampling distribution of sample proportions of messages that are spam is approximately normal, centered at 80 with standard deviation or .0283 . So the -score for a proportion of .75 equals or -1.77 . The probability lying to the right (exceeding .75) equals .9616." be larger, smaller, or the same if the (population) proportion of spam messages were .77 rather than . 80 ? Explain briefly.
-Would your answer to "Because you are considering a large sample size, the Central Limit Theorem predicts the sampling distribution of sample proportions of messages that are spam is approximately normal, centered at 80 with standard deviation or .0283 . So the -score for a proportion of .75 equals or -1.77 . The probability lying to the right (exceeding .75) equals .9616." be larger, smaller, or the same if the (population) proportion of spam messages were .77 rather than . 80 ? Explain briefly.
فتح الحزمة
افتح القفل للوصول البطاقات البالغ عددها 61 في هذه المجموعة.
فتح الحزمة
k this deck
46
Suppose a phone company reports that the average duration of a cell phone call is 1.7 minutes with a standard deviation of 1.4 minutes.
-Use the CLT to approximate the probability that in a random sample of 60 calls, the sample average duration would be less than 2 minutes.
-Use the CLT to approximate the probability that in a random sample of 60 calls, the sample average duration would be less than 2 minutes.
فتح الحزمة
افتح القفل للوصول البطاقات البالغ عددها 61 في هذه المجموعة.
فتح الحزمة
k this deck
47
Suppose a phone company reports that the average duration of a cell phone call is 1.7 minutes with a standard deviation of 1.4 minutes.
-If you examine a random sample of 60 of your cell phone calls and find that the sample mean duration is 2.0 minutes, would it be reasonable to conclude that the average duration in the population of all your cell phone calls is greater than 1.7 minutes? Explain, based on your calculation.
-If you examine a random sample of 60 of your cell phone calls and find that the sample mean duration is 2.0 minutes, would it be reasonable to conclude that the average duration in the population of all your cell phone calls is greater than 1.7 minutes? Explain, based on your calculation.
فتح الحزمة
افتح القفل للوصول البطاقات البالغ عددها 61 في هذه المجموعة.
فتح الحزمة
k this deck
48
Suppose a phone company reports that the average duration of a cell phone call is 1.7 minutes with a standard deviation of 1.4 minutes.
-Would "the sampling distribution of the average duration call will approximately follow a normal distribution with mean 1.7 minutes and standard deviation or 0.181 minutes. and Note: The sample size is greater than 30 , so you are willing to assume the shape will be approximately normal, even though the population distribution is most plausibly skewed to the right. This is appropriate as long as the skewness is not too severe. " be larger, smaller, or the same if the sample size were 40 calls rather than 60 calls? Explain briefly.
-Would "the sampling distribution of the average duration call will approximately follow a normal distribution with mean 1.7 minutes and standard deviation or 0.181 minutes. and Note: The sample size is greater than 30 , so you are willing to assume the shape will be approximately normal, even though the population distribution is most plausibly skewed to the right. This is appropriate as long as the skewness is not too severe.
" be larger, smaller, or the same if the sample size were 40 calls rather than 60 calls? Explain briefly. فتح الحزمة
افتح القفل للوصول البطاقات البالغ عددها 61 في هذه المجموعة.
فتح الحزمة
k this deck
49
Suppose a phone company reports that the average duration of a cell phone call is 1.7 minutes with a standard deviation of 1.4 minutes.
-Would "the sampling distribution of the average duration call will approximately follow a normal distribution with mean 1.7 minutes and standard deviation or 0.181 minutes. and Note: The sample size is greater than 30 , so you are willing to assume the shape will be approximately normal, even though the population distribution is most plausibly skewed to the right. This is appropriate as long as the skewness is not too severe. " be larger, smaller, or the same if the (population) average duration were 1.9 minutes rather than 1.7 minutes? Explain briefly.
-Would "the sampling distribution of the average duration call will approximately follow a normal distribution with mean 1.7 minutes and standard deviation or 0.181 minutes. and Note: The sample size is greater than 30 , so you are willing to assume the shape will be approximately normal, even though the population distribution is most plausibly skewed to the right. This is appropriate as long as the skewness is not too severe.
" be larger, smaller, or the same if the (population) average duration were 1.9 minutes rather than 1.7 minutes? Explain briefly. فتح الحزمة
افتح القفل للوصول البطاقات البالغ عددها 61 في هذه المجموعة.
فتح الحزمة
k this deck
50
Suppose a phone company reports that the average duration of a cell phone call is 1.7 minutes with a standard deviation of 1.4 minutes.
-Would "the sampling distribution of the average duration call will approximately follow a normal distribution with mean 1.7 minutes and standard deviation or 0.181 minutes. and Note: The sample size is greater than 30 , so you are willing to assume the shape will be approximately normal, even though the population distribution is most plausibly skewed to the right. This is appropriate as long as the skewness is not too severe. " be larger, smaller, or the same if the (population) standard deviation of call durations were 1.8 minutes rather than 1.4 minutes? Explain briefly.
-Would "the sampling distribution of the average duration call will approximately follow a normal distribution with mean 1.7 minutes and standard deviation or 0.181 minutes. and Note: The sample size is greater than 30 , so you are willing to assume the shape will be approximately normal, even though the population distribution is most plausibly skewed to the right. This is appropriate as long as the skewness is not too severe.
" be larger, smaller, or the same if the (population) standard deviation of call durations were 1.8 minutes rather than 1.4 minutes? Explain briefly. فتح الحزمة
افتح القفل للوصول البطاقات البالغ عددها 61 في هذه المجموعة.
فتح الحزمة
k this deck
51
Suppose that two employees have to be fired from a group of seven:
- Amy, female, age 35
- Bob, male, age 41
- Chad, male, age 43
- Diana, female, age 44
- Elvis, male, age 49
- Frank, male, age 61
- Ginger, female, age 62
Suppose for now that the company selects the two employees to be fired at random, so all possible pairs of people have the same probability of being fired.
a. List all outcomes in the sample space. In other words, list all possible pairs of people that can be chosen from this group of seven people. (To save time and space, just use initials. For example, write AB to represent the (Amy, Bob) pair.)
b. Determine the probability (both as a fraction and a decimal) that both employees selected are female.
c. Determine the probability (both as a fraction and a decimal) that the average age of the employees selected is older than 50.
d. Determine the probability that both employees selected are older than 60 .
Suppose that Frank and Ginger are the employees selected to be fired. They proceed to file a lawsuit, alleging that the company is guilty of age discrimination for choosing the two oldest employees to fire. The company responds that it did not discriminate; it simply happened to choose these two by random chance.
e. Does your probability analysis provide evidence to support the allegation of age discrimination? Explain (with 1-3 sentences) the reasoning process behind your answer.
فتح الحزمة
افتح القفل للوصول البطاقات البالغ عددها 61 في هذه المجموعة.
فتح الحزمة
k this deck
52
Suppose that the drying time for a certain type of paint under specified test conditions is known to be normally distributed with mean 75 minutes and standard deviation 5 minutes. Suppose also that chemists have devised a new additive that they hope will reduce the mean drying time (without changing the standard deviation). A test is then conducted to measure the drying time for a test specimen, and the company executives decide that they will be convinced that the additive is effective only if the drying time on this specimen is less than 70 minutes.
a. If the additive actually has no effect at all on the drying time, what is the probability the company executives will mistakenly conclude that it is effective? Include a sketch with your calculation.
b. If you want to alter the cutoff value from 70 in order to reduce the error probability in part a to .05 , what cutoff value should you choose?
c. Now suppose that the standard deviation of the drying times to 65 minutes is 2 rather than 5 minutes. Without doing any new calculations, describe how this change would affect your answers to parts a and . Give an intuitive explanation for your reasoning in both cases.
فتح الحزمة
افتح القفل للوصول البطاقات البالغ عددها 61 في هذه المجموعة.
فتح الحزمة
k this deck
53
Suppose of all heart transplant patients do not survive the operation.
a. Think about taking repeated random samples of 371 patients from this population.
Describe how the sample proportion who die would vary from sample to sample. (Hint: Be sure to refer to the shape, center, and spread of its sampling distribution.) Also include a well-labeled sketch to represent this distribution.
b. Suppose you take a random sample of 371 heart transplant patients. Determine the probability that the sample proportion who die would be .213 or higher.
فتح الحزمة
افتح القفل للوصول البطاقات البالغ عددها 61 في هذه المجموعة.
فتح الحزمة
k this deck
54
Suppose I tell you that I flipped a coin multiple times and got heads. Would you be reasonably convinced that this was not a fair coin (where "fair" means that the coin has a 50/50 chance of landing heads or tails)? If so, explain why. If not, describe what additional information you would ask for and explain why that information is necessary.
فتح الحزمة
افتح القفل للوصول البطاقات البالغ عددها 61 في هذه المجموعة.
فتح الحزمة
k this deck
55
The distribution of house prices is skewed to the right because most houses cost a modest amount but a few cost a very large amount. If you take a random sample of 1000 houses, can you reasonably expect the distribution of the house prices to be approximately normal? Explain your answer.
فتح الحزمة
افتح القفل للوصول البطاقات البالغ عددها 61 في هذه المجموعة.
فتح الحزمة
k this deck
56
Suppose you flip a fair coin until it lands heads up for the first time. It can be shown (do not try to calculate this) that the expected value of the number of flips required is 2. Explain (with a sentence or two) what this expected value means in this context.
فتح الحزمة
افتح القفل للوصول البطاقات البالغ عددها 61 في هذه المجموعة.
فتح الحزمة
k this deck
57
Scores on the verbal ability portion of the Graduate Record Examination (GRE) follow a normal distribution with mean 500 and standard deviation 115 .
a. Between what two values do the middle of scores fall?
b. If your score is 650 , then you did better than what percentage of exam takers?
c. Suppose you study a random sample of 100 GRE verbal exams. Determine the probability that the average (mean) score in this sample will be between 485 and 515.
فتح الحزمة
افتح القفل للوصول البطاقات البالغ عددها 61 في هذه المجموعة.
فتح الحزمة
k this deck
58
If you bet one dollar on a color in a spin of a roulette wheel, then you will either win one dollar or lose one dollar. The probability is (about .526) that you will lose one dollar and 18/38 (about .474 ) that you will win one dollar.
a. Explain what it means to say that the probability of winning one dollar is 474 , as if to someone with no formal knowledge of statistics.
b. Consider losing one dollar to mean that your winnings are (_1) dollar.
Determine the expected value of your winnings from betting one dollar on one spin of a roulette wheel.
c. Write a sentence or two interpreting what this expected value means in this context.
فتح الحزمة
افتح القفل للوصول البطاقات البالغ عددها 61 في هذه المجموعة.
فتح الحزمة
k this deck
59
Suppose that you have a probability of winning a game of solitaire, which remains the same in every game regardless of what happens in prior games. You decide to play games repeatedly until you win twice. You want to know the probability that you will need to play 10 games or fewer in order to achieve your goal of winning twice.
a. Describe how you could use a fair, six-sided die to simulate this process.
Now consider the following histogram that results from simulating this process 500 times: b. Use these simulation results to approximate the probability that you will finish in ten or fewer games.
a. Describe how you could use a fair, six-sided die to simulate this process.
Now consider the following histogram that results from simulating this process 500 times:
b. Use these simulation results to approximate the probability that you will finish in ten or fewer games. فتح الحزمة
افتح القفل للوصول البطاقات البالغ عددها 61 في هذه المجموعة.
فتح الحزمة
k this deck
60
Suppose that of all students at your school ride a bicycle to class each day. Suppose further that you take a random sample of 80 students at your school.
a. Is number a parameter or a statistic? Explain briefly.
b. Are you guaranteed that of your sample ride a bicycle to class each day? Explain briefly.
c. Describe the sampling distribution of the sample proportion of these 80 students who ride a bicycle to class each day. (Hint: Be sure to refer to the shape, center, and spread of this sampling distribution.) Also include a well-labeled sketch of this distribution.
فتح الحزمة
افتح القفل للوصول البطاقات البالغ عددها 61 في هذه المجموعة.
فتح الحزمة
k this deck
61
Suppose that of the email messages arriving to a college's computer system are spam. You want to take a random sample of incoming email messages and perform probability calculations involving the sample proportion that are spam. How large must the sample size be so you can reasonably apply the Central Limit Theorem?
فتح الحزمة
افتح القفل للوصول البطاقات البالغ عددها 61 في هذه المجموعة.
فتح الحزمة
k this deck
فتح الحزمة
افتح القفل للوصول البطاقات البالغ عددها 61 في هذه المجموعة.


