Deck 4: Summarizing Data: Measures of Variation
ملء الشاشة (f)
سؤال
سؤال
سؤال
سؤال
سؤال
سؤال
سؤال
سؤال
سؤال
سؤال
سؤال
سؤال
سؤال
سؤال
The frequency distribution of grades on a test for a class of 30 students is given below:
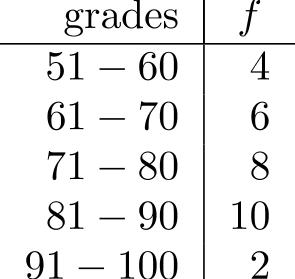
-Find the variance of the grades.
-Find the variance of the grades.
سؤال
The frequency distribution of grades on a test for a class of 30 students is given below:
-Find the standard deviation of the grades.
-Find the standard deviation of the grades.
سؤال
سؤال
سؤال
سؤال
The number of sales of homes having two bedrooms or less in a state for a ten-week period in 1987 is given in the following table:
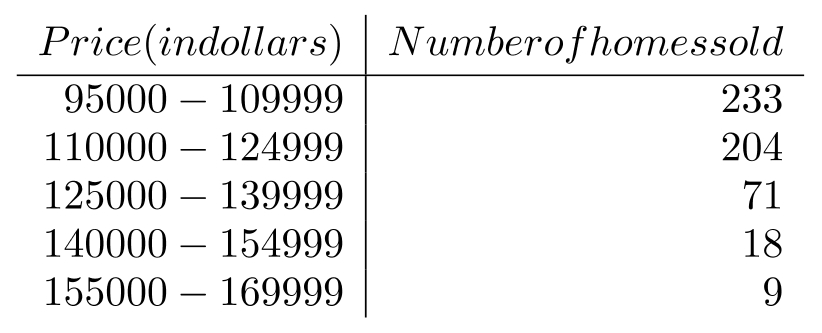
-For a two-bedroom or less home in this state during the given period, find the variance of the prices.
-For a two-bedroom or less home in this state during the given period, find the variance of the prices.
سؤال
The number of sales of homes having two bedrooms or less in a state for a ten-week period in 1987 is given in the following table:
-For a two-bedroom or less home in this state during the given period, find the standard deviation of the price.
-For a two-bedroom or less home in this state during the given period, find the standard deviation of the price.
سؤال
Table 2
Two companies have the following sales results for a particular month.
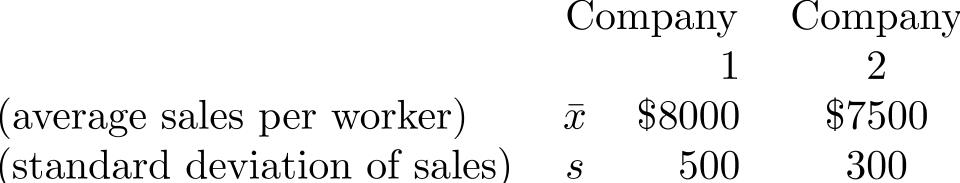
-Use the data in Table 2 to solve the following:
A salesperson with of sales has lower sales relative to the mean in which of the two companies?
Two companies have the following sales results for a particular month.
-Use the data in Table 2 to solve the following:
A salesperson with of sales has lower sales relative to the mean in which of the two companies?
سؤال
Table 2
Two companies have the following sales results for a particular month.
-Use the data in Table 2 to solve the following:
In company 1 , at least what percentage of salespersons have sales between and ?
Two companies have the following sales results for a particular month.
-Use the data in Table 2 to solve the following:
In company 1 , at least what percentage of salespersons have sales between and ?
سؤال
Table 2
Two companies have the following sales results for a particular month.
-Use the data in Table 2 to solve the following:
In company 1 , between what values does at least of the salespersons' sales fall?
Two companies have the following sales results for a particular month.
-Use the data in Table 2 to solve the following:
In company 1 , between what values does at least of the salespersons' sales fall?
سؤال
Table 2
Two companies have the following sales results for a particular month.
-Use the data in Table 2 to solve the following:
Give the coefficient of variation of the sales of each of the two companies.
Two companies have the following sales results for a particular month.
-Use the data in Table 2 to solve the following:
Give the coefficient of variation of the sales of each of the two companies.
سؤال
سؤال
سؤال
سؤال
سؤال
سؤال
سؤال
سؤال
سؤال
سؤال
سؤال
سؤال
سؤال
سؤال
سؤال
سؤال
سؤال
سؤال
سؤال
سؤال
سؤال
سؤال
سؤال
سؤال
سؤال
سؤال
سؤال
سؤال
سؤال
سؤال
سؤال
سؤال

فتح الحزمة
قم بالتسجيل لفتح البطاقات في هذه المجموعة!
Unlock Deck
Unlock Deck
1/56
العب
ملء الشاشة (f)
Deck 4: Summarizing Data: Measures of Variation
1
Which of the following is a measure of variation?
A) the mean
B) the median
C) the midquartile
D) the semi-interquartile range
A) the mean
B) the median
C) the midquartile
D) the semi-interquartile range
the semi-interquartile range
2
In order to compare the values of two numbers which belong to different sets of data, we use:
A) -scores.
B) Chebyshev's theorem.
C) the coefficient of variation.
D) the semi-interquartile range.
A) -scores.
B) Chebyshev's theorem.
C) the coefficient of variation.
D) the semi-interquartile range.
-scores.
3
The measure of variation that is most affected by outliers is the:
A) range.
B) interquartile range.
C) standard deviation.
D) variance.
A) range.
B) interquartile range.
C) standard deviation.
D) variance.
range.
4
The _______ is not a measure of variation.
A) range
B) midrange
C) semi-interquartile range
D) mean deviation
A) range
B) midrange
C) semi-interquartile range
D) mean deviation
فتح الحزمة
افتح القفل للوصول البطاقات البالغ عددها 56 في هذه المجموعة.
فتح الحزمة
k this deck
5
A set of data has a mean of 80 and a standard deviation of 5 . To determine two values that contain at least of the data, we use:
A) Chebyshev's theorem.
B) the coefficient of variation.
C) -scores.
D) the empirical rule.
A) Chebyshev's theorem.
B) the coefficient of variation.
C) -scores.
D) the empirical rule.
فتح الحزمة
افتح القفل للوصول البطاقات البالغ عددها 56 في هذه المجموعة.
فتح الحزمة
k this deck
6
In order to measure the dispersion of a set of data relative to its level of magnitude, we use:
A) -scores.
B) Chebyshev's theorem.
C) the coefficient of variation.
D) the empirical rule.
A) -scores.
B) Chebyshev's theorem.
C) the coefficient of variation.
D) the empirical rule.
فتح الحزمة
افتح القفل للوصول البطاقات البالغ عددها 56 في هذه المجموعة.
فتح الحزمة
k this deck
7
Which of the following symbols represents a sample value, not a population value?
A)
B)
C)
D)
A)
B)
C)
D)
فتح الحزمة
افتح القفل للوصول البطاقات البالغ عددها 56 في هذه المجموعة.
فتح الحزمة
k this deck
8
The degree of symmetry of a distribution is given by:
A) the standard deviation.
B) the interquartile range.
C) .
D) .
A) the standard deviation.
B) the interquartile range.
C) .
D) .
فتح الحزمة
افتح القفل للوصول البطاقات البالغ عددها 56 في هذه المجموعة.
فتح الحزمة
k this deck
9
Which of the following does not provide an application of the standard deviation?
A) -scores.
B) Chebyshev's theorem.
C) the coefficient of variation.
D) the midquartile.
A) -scores.
B) Chebyshev's theorem.
C) the coefficient of variation.
D) the midquartile.
فتح الحزمة
افتح القفل للوصول البطاقات البالغ عددها 56 في هذه المجموعة.
فتح الحزمة
k this deck
10
The interquartile range is a better measure of variation than:
A) the range.
B) the mean deviation.
C) the standard deviation.
D) the variance.
A) the range.
B) the mean deviation.
C) the standard deviation.
D) the variance.
فتح الحزمة
افتح القفل للوصول البطاقات البالغ عددها 56 في هذه المجموعة.
فتح الحزمة
k this deck
11
The grades obtained on a test by twelve students in a class are listed below.
-Find the range of the grades.
-Find the range of the grades.
فتح الحزمة
افتح القفل للوصول البطاقات البالغ عددها 56 في هذه المجموعة.
فتح الحزمة
k this deck
12
The grades obtained on a test by twelve students in a class are listed below.
-Find the standard deviation of the grades.
-Find the standard deviation of the grades.
فتح الحزمة
افتح القفل للوصول البطاقات البالغ عددها 56 في هذه المجموعة.
فتح الحزمة
k this deck
13
The grades obtained on a test by twelve students in a class are listed below.
-Find the variance of the grades.
-Find the variance of the grades.
فتح الحزمة
افتح القفل للوصول البطاقات البالغ عددها 56 في هذه المجموعة.
فتح الحزمة
k this deck
14
The frequency distribution of grades on a test for a class of 30 students is given below:
-Find the variance of the grades.
-Find the variance of the grades.
فتح الحزمة
افتح القفل للوصول البطاقات البالغ عددها 56 في هذه المجموعة.
فتح الحزمة
k this deck
15
The frequency distribution of grades on a test for a class of 30 students is given below:
-Find the standard deviation of the grades.
-Find the standard deviation of the grades.
فتح الحزمة
افتح القفل للوصول البطاقات البالغ عددها 56 في هذه المجموعة.
فتح الحزمة
k this deck
16
At the start of the program, ten dieters entering a weight-loss program have the weights (in pounds) shown below.
-For this data, find the hinges.
-For this data, find the hinges.
فتح الحزمة
افتح القفل للوصول البطاقات البالغ عددها 56 في هذه المجموعة.
فتح الحزمة
k this deck
17
At the start of the program, ten dieters entering a weight-loss program have the weights (in pounds) shown below.
-For this data, construct a boxplot.
-For this data, construct a boxplot.
فتح الحزمة
افتح القفل للوصول البطاقات البالغ عددها 56 في هذه المجموعة.
فتح الحزمة
k this deck
18
At the start of the program, ten dieters entering a weight-loss program have the weights (in pounds) shown below.
-For this data, using the hinges as quartiles, find the interquartile range.
-For this data, using the hinges as quartiles, find the interquartile range.
فتح الحزمة
افتح القفل للوصول البطاقات البالغ عددها 56 في هذه المجموعة.
فتح الحزمة
k this deck
19
The number of sales of homes having two bedrooms or less in a state for a ten-week period in 1987 is given in the following table:
-For a two-bedroom or less home in this state during the given period, find the variance of the prices.
-For a two-bedroom or less home in this state during the given period, find the variance of the prices.
فتح الحزمة
افتح القفل للوصول البطاقات البالغ عددها 56 في هذه المجموعة.
فتح الحزمة
k this deck
20
The number of sales of homes having two bedrooms or less in a state for a ten-week period in 1987 is given in the following table:
-For a two-bedroom or less home in this state during the given period, find the standard deviation of the price.
-For a two-bedroom or less home in this state during the given period, find the standard deviation of the price.
فتح الحزمة
افتح القفل للوصول البطاقات البالغ عددها 56 في هذه المجموعة.
فتح الحزمة
k this deck
21
Table 2
Two companies have the following sales results for a particular month.
-Use the data in Table 2 to solve the following:
A salesperson with of sales has lower sales relative to the mean in which of the two companies?
Two companies have the following sales results for a particular month.
-Use the data in Table 2 to solve the following:
A salesperson with of sales has lower sales relative to the mean in which of the two companies?
فتح الحزمة
افتح القفل للوصول البطاقات البالغ عددها 56 في هذه المجموعة.
فتح الحزمة
k this deck
22
Table 2
Two companies have the following sales results for a particular month.
-Use the data in Table 2 to solve the following:
In company 1 , at least what percentage of salespersons have sales between and ?
Two companies have the following sales results for a particular month.
-Use the data in Table 2 to solve the following:
In company 1 , at least what percentage of salespersons have sales between and ?
فتح الحزمة
افتح القفل للوصول البطاقات البالغ عددها 56 في هذه المجموعة.
فتح الحزمة
k this deck
23
Table 2
Two companies have the following sales results for a particular month.
-Use the data in Table 2 to solve the following:
In company 1 , between what values does at least of the salespersons' sales fall?
Two companies have the following sales results for a particular month.
-Use the data in Table 2 to solve the following:
In company 1 , between what values does at least of the salespersons' sales fall?
فتح الحزمة
افتح القفل للوصول البطاقات البالغ عددها 56 في هذه المجموعة.
فتح الحزمة
k this deck
24
Table 2
Two companies have the following sales results for a particular month.
-Use the data in Table 2 to solve the following:
Give the coefficient of variation of the sales of each of the two companies.
Two companies have the following sales results for a particular month.
-Use the data in Table 2 to solve the following:
Give the coefficient of variation of the sales of each of the two companies.
فتح الحزمة
افتح القفل للوصول البطاقات البالغ عددها 56 في هذه المجموعة.
فتح الحزمة
k this deck
25
How does the interquartile range compare to the range when the distribution is shaped like the cross section of a bell?
فتح الحزمة
افتح القفل للوصول البطاقات البالغ عددها 56 في هذه المجموعة.
فتح الحزمة
k this deck
26
How does the interquartile range compare to the range when the distribution is shaped like a U?
فتح الحزمة
افتح القفل للوصول البطاقات البالغ عددها 56 في هذه المجموعة.
فتح الحزمة
k this deck
27
The prices (in dollars) of 16 film video cassettes on sale at a video store are given below.
-For this data, find the range.
-For this data, find the range.
فتح الحزمة
افتح القفل للوصول البطاقات البالغ عددها 56 في هذه المجموعة.
فتح الحزمة
k this deck
28
The prices (in dollars) of 16 film video cassettes on sale at a video store are given below.
-For this data, find the standard deviation (if the data is viewed as a population).
-For this data, find the standard deviation (if the data is viewed as a population).
فتح الحزمة
افتح القفل للوصول البطاقات البالغ عددها 56 في هذه المجموعة.
فتح الحزمة
k this deck
29
The prices (in dollars) of 16 film video cassettes on sale at a video store are given below.
-For this data, find the Pearsonian coefficient of skewness.
-For this data, find the Pearsonian coefficient of skewness.
فتح الحزمة
افتح القفل للوصول البطاقات البالغ عددها 56 في هذه المجموعة.
فتح الحزمة
k this deck
30
The following is a list of the number of dollars a sample of students say they are willing to spend for a present for a close friend.
Males:
Females:
-Find the range for the entire group.
Males:
Females:
-Find the range for the entire group.
فتح الحزمة
افتح القفل للوصول البطاقات البالغ عددها 56 في هذه المجموعة.
فتح الحزمة
k this deck
31
The following is a list of the number of dollars a sample of students say they are willing to spend for a present for a close friend.
Males:
Females:
-Find the standard deviation for the females.
Males:
Females:
-Find the standard deviation for the females.
فتح الحزمة
افتح القفل للوصول البطاقات البالغ عددها 56 في هذه المجموعة.
فتح الحزمة
k this deck
32
The following is a list of the number of dollars a sample of students say they are willing to spend for a present for a close friend.
Males:
Females:
-Find the interquartile range for the males.
Males:
Females:
-Find the interquartile range for the males.
فتح الحزمة
افتح القفل للوصول البطاقات البالغ عددها 56 في هذه المجموعة.
فتح الحزمة
k this deck
33
The mean, median, and standard deviation of a list of numbers are 128, 160, and 8.2. Suppose that the number 25 is added to each number in the list.
-What is the new value of the mean?
-What is the new value of the mean?
فتح الحزمة
افتح القفل للوصول البطاقات البالغ عددها 56 في هذه المجموعة.
فتح الحزمة
k this deck
34
The mean, median, and standard deviation of a list of numbers are 128, 160, and 8.2. Suppose that the number 25 is added to each number in the list.
-What is the new value of the median?
-What is the new value of the median?
فتح الحزمة
افتح القفل للوصول البطاقات البالغ عددها 56 في هذه المجموعة.
فتح الحزمة
k this deck
35
The mean, median, and standard deviation of a list of numbers are 128, 160, and 8.2. Suppose that the number 25 is added to each number in the list.
-What is the new value of the standard deviation?
-What is the new value of the standard deviation?
فتح الحزمة
افتح القفل للوصول البطاقات البالغ عددها 56 في هذه المجموعة.
فتح الحزمة
k this deck
36
The mean, median, and standard deviation of a list of numbers are 128, 160, and 8.2. Suppose that the number 25 is added to each number in the list.
-What is the new value of the variance?
-What is the new value of the variance?
فتح الحزمة
افتح القفل للوصول البطاقات البالغ عددها 56 في هذه المجموعة.
فتح الحزمة
k this deck
37
A measure of variation that is greatly affected by extreme values is the standard deviation.
فتح الحزمة
افتح القفل للوصول البطاقات البالغ عددها 56 في هذه المجموعة.
فتح الحزمة
k this deck
38
Distributions having a tail to the right are called negative skewed.
فتح الحزمة
افتح القفل للوصول البطاقات البالغ عددها 56 في هذه المجموعة.
فتح الحزمة
k this deck
39
The midrange is a measure of variation.
فتح الحزمة
افتح القفل للوصول البطاقات البالغ عددها 56 في هذه المجموعة.
فتح الحزمة
k this deck
40
The standard deviation of the numbers is zero.
فتح الحزمة
افتح القفل للوصول البطاقات البالغ عددها 56 في هذه المجموعة.
فتح الحزمة
k this deck
41
In a boxplot, if the median is close to the left side of the box, the data is symmetric.
فتح الحزمة
افتح القفل للوصول البطاقات البالغ عددها 56 في هذه المجموعة.
فتح الحزمة
k this deck
42
An outlier is an extreme value in the data that may be due to an error in measurement.
فتح الحزمة
افتح القفل للوصول البطاقات البالغ عددها 56 في هذه المجموعة.
فتح الحزمة
k this deck
43
A measure of variation that depends on all the data is a range.
فتح الحزمة
افتح القفل للوصول البطاقات البالغ عددها 56 في هذه المجموعة.
فتح الحزمة
k this deck
44
The symbol represents the population standard deviation.
فتح الحزمة
افتح القفل للوصول البطاقات البالغ عددها 56 في هذه المجموعة.
فتح الحزمة
k this deck
45
If the mean of a set of data is negative, then the standard deviation is negative.
فتح الحزمة
افتح القفل للوصول البطاقات البالغ عددها 56 في هذه المجموعة.
فتح الحزمة
k this deck
46
If the mean and standard deviation of a set of data are 60 and 5 respectively, then the values 50 and 70 have -scores which are equal in magnitude, but opposite in sign.
فتح الحزمة
افتح القفل للوصول البطاقات البالغ عددها 56 في هذه المجموعة.
فتح الحزمة
k this deck
47
One advantage of the computing formula for the standard deviation is that it does not require calculating the _______.
فتح الحزمة
افتح القفل للوصول البطاقات البالغ عددها 56 في هذه المجموعة.
فتح الحزمة
k this deck
48
The number of standard deviations a value lies above or below the mean is given by a _______.
فتح الحزمة
افتح القفل للوصول البطاقات البالغ عددها 56 في هذه المجموعة.
فتح الحزمة
k this deck
49
The symbol denotes the _______.
فتح الحزمة
افتح القفل للوصول البطاقات البالغ عددها 56 في هذه المجموعة.
فتح الحزمة
k this deck
50
A denominator of in the defining formula for a standard deviation indicates that the formula measures the variance of a _______.
فتح الحزمة
افتح القفل للوصول البطاقات البالغ عددها 56 في هذه المجموعة.
فتح الحزمة
k this deck
51
A disadvantage that the range has compared to the standard deviation is that the range is _______.
فتح الحزمة
افتح القفل للوصول البطاقات البالغ عددها 56 في هذه المجموعة.
فتح الحزمة
k this deck
52
If a distribution has the general shape of the cross section of a bell, then the _______ allows for a stronger statement than Chebyshev's theorem.
فتح الحزمة
افتح القفل للوصول البطاقات البالغ عددها 56 في هذه المجموعة.
فتح الحزمة
k this deck
53
In order to compare the variability of several populations having different magnitude levels, we should use the _______.
فتح الحزمة
افتح القفل للوصول البطاقات البالغ عددها 56 في هذه المجموعة.
فتح الحزمة
k this deck
54
The closer the Pearsonian coefficient of skewness is to _______ the more symmetric the distribution.
فتح الحزمة
افتح القفل للوصول البطاقات البالغ عددها 56 في هذه المجموعة.
فتح الحزمة
k this deck
55
When drawing a boxplot, we usually omit _______ from the data.
فتح الحزمة
افتح القفل للوصول البطاقات البالغ عددها 56 في هذه المجموعة.
فتح الحزمة
k this deck
56
The three measures that are needed to calculate the Pearsonian coefficient of skewness are the mean, the median, and the _______.
فتح الحزمة
افتح القفل للوصول البطاقات البالغ عددها 56 في هذه المجموعة.
فتح الحزمة
k this deck
فتح الحزمة
افتح القفل للوصول البطاقات البالغ عددها 56 في هذه المجموعة.


