Deck 14: Inference About Simple Regression
ملء الشاشة (f)
سؤال
Which expression is a regression equation for a simple linear relationship in a population?
A) = b0 + b1 x
B) = 44 + 0.60 x
C)
D)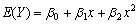
A) = b0 + b1 x
B) = 44 + 0.60 x
C)
D)
سؤال
سؤال
سؤال
Which statement is not one of the assumptions made about a simple linear regression model for a population?
A) The variance of Y is the same for every value of x.
B) The distribution of Y follows a normal distribution at every value of x.
C) The average (or mean) of Y changes linearly with x.
D) The deviations (or residuals) follow a normal distribution with mean .
.
A) The variance of Y is the same for every value of x.
B) The distribution of Y follows a normal distribution at every value of x.
C) The average (or mean) of Y changes linearly with x.
D) The deviations (or residuals) follow a normal distribution with mean
. سؤال
سؤال
سؤال
سؤال
سؤال
سؤال
سؤال
Shown below is a scatterplot of y versus x. 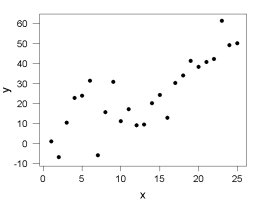 Which choice is most likely to be the approximate value of r2, the proportion of variation in y explained by the linear relationship with x?
A) 0%
B) 5%
C) 63%
D) 95%
Which choice is most likely to be the approximate value of r2, the proportion of variation in y explained by the linear relationship with x?A) 0%
B) 5%
C) 63%
D) 95%
سؤال
Shown below is a scatterplot of y versus x. 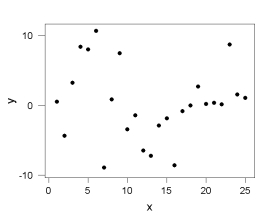 Which choice is most likely to be the approximate value of r2, the proportion of variation in y explained by the linear relationship with x?
A) 0%
B) 63%
C) 95%
D) 99%
Which choice is most likely to be the approximate value of r2, the proportion of variation in y explained by the linear relationship with x?A) 0%
B) 63%
C) 95%
D) 99%
سؤال
Shown below is a scatterplot of y versus x. 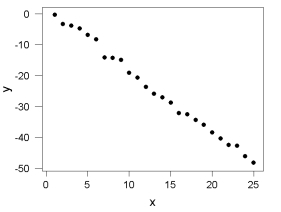
Which choice is most likely to be the approximate value of r2, the proportion of variation in y explained by the linear relationship with x?
A) -99.5%
B) 2.0%
C) 50.0%
D) 99.5%
Which choice is most likely to be the approximate value of r2, the proportion of variation in y explained by the linear relationship with x?
A) -99.5%
B) 2.0%
C) 50.0%
D) 99.5%
سؤال
سؤال
سؤال
سؤال
سؤال
سؤال
سؤال
سؤال
سؤال
سؤال
سؤال
سؤال
سؤال
سؤال
سؤال
سؤال
سؤال
سؤال
سؤال
سؤال
سؤال
سؤال
سؤال
سؤال
سؤال
سؤال
سؤال
سؤال
سؤال
سؤال
سؤال
سؤال
سؤال
Use the following information for questions:
A representative sample of n = 12 male college students is used to find a regression equation for y = weight (lbs) and x = height (inches). The least squares regression equation is = 30 + 2 x. The standard error of the estimated slope is 1. The following hypotheses will be tested:
H0:
Ha:
-What is the p-value for testing the following hypothesis about the correlation coefficient
A) 0.074
B) 0.162
C) 0.226
D) None of the above
سؤال
Use the following information for questions:
Grades for a random sample of students who have taken statistics from a certain professor over the past 20 year were used to estimate the relationship between y = grade on the final exam and x = average exam score (for the three exams given during the term).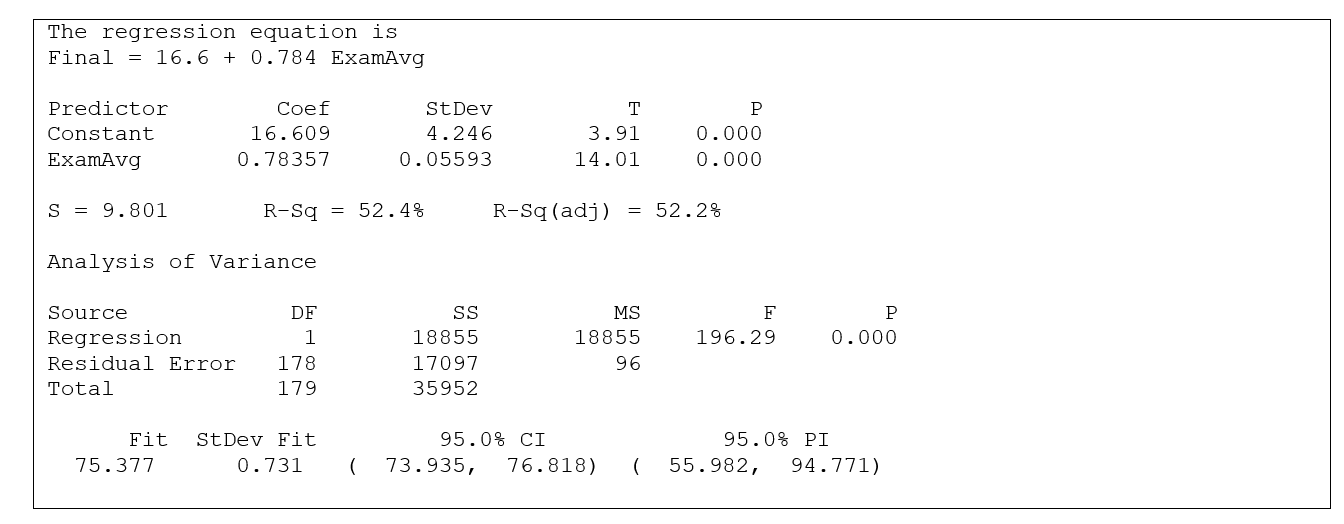
-The results for a test of H0: 1 = 0 versus Ha 1 0 show that
A) the null hypothesis can be rejected because t = 3.91 and the p-value = 0.000.
B) the null hypothesis can be rejected because t = 14.01 and the p-value = 0.000.
C) the null hypothesis cannot be rejected because t = 3.91 and the p-value = 0.000.
D) the null hypothesis cannot be rejected because t = 14.01 and the p-value = 0.000.
سؤال
Use the following information for questions:
Grades for a random sample of students who have taken statistics from a certain professor over the past 20 year were used to estimate the relationship between y = grade on the final exam and x = average exam score (for the three exams given during the term).
-The estimate of the population standard deviation is given by
A) SSE = 17097
B) MSE = 96
C) StDev = 4.246
D) S = 9.801
سؤال
Use the following information for questions:
Grades for a random sample of students who have taken statistics from a certain professor over the past 20 year were used to estimate the relationship between y = grade on the final exam and x = average exam score (for the three exams given during the term).
-The "Fit"information shown at the end of the output is for ExamAvg = 75. From this, we can conclude that
A) the probability is about 0.95 that a randomly selected student with an exam average of 75 will score between 74 and 77 on the final exam.
B) the final exam score for a randomly selected student with an exam average of 75 is likely to be between 56 and 95.
C) about 95% of the students with an exam average of 75 will score between 74 and 77 on the final exam.
D) the average final exam score for students with an exam average of 75 is likely to be between 56 and 95.
سؤال
Use the following information for questions:
Grades for a random sample of students who have taken statistics from a certain professor over the past 20 year were used to estimate the relationship between y = grade on the final exam and x = average exam score (for the three exams given during the term).
-The two values used to determine r2 are
A) 17097 and 35952
B) 96 and 17097
C) 1 and 178
D) 178 and 179
سؤال
سؤال
سؤال
سؤال
سؤال
سؤال
سؤال
سؤال
سؤال
سؤال
سؤال
سؤال
سؤال
سؤال
سؤال
Use the following information for questions:
Data has been obtained on the house size (in square feet) and the selling price (in dollars) for a sample of 100 homes in your town. Your friend is saving to buy a house and she asks you to investigate the relationship between house size and selling price and to develop a model to predict the price from size.
-Consider the scatterplot below.
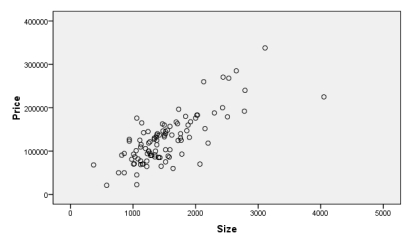 Does a linear relationship between price and size seem reasonable? If so, what appears to be the direction of the relationship?
Data has been obtained on the house size (in square feet) and the selling price (in dollars) for a sample of 100 homes in your town. Your friend is saving to buy a house and she asks you to investigate the relationship between house size and selling price and to develop a model to predict the price from size.
-Consider the scatterplot below.
Does a linear relationship between price and size seem reasonable? If so, what appears to be the direction of the relationship? سؤال
Use the following information for questions:
Data has been obtained on the house size (in square feet) and the selling price (in dollars) for a sample of 100 homes in your town. Your friend is saving to buy a house and she asks you to investigate the relationship between house size and selling price and to develop a model to predict the price from size.
-Some of the regression output is provided below.
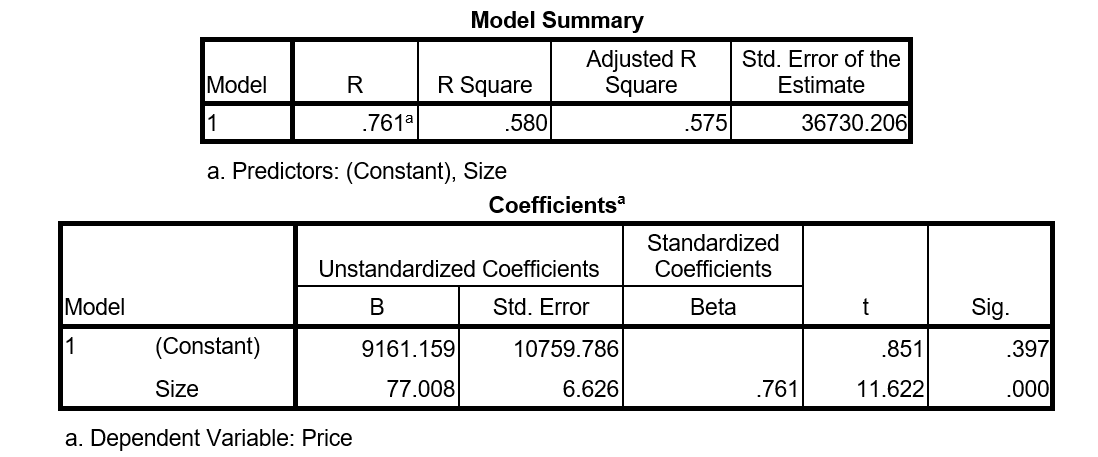
Give the value of and interpret it in the context of the problem.
Data has been obtained on the house size (in square feet) and the selling price (in dollars) for a sample of 100 homes in your town. Your friend is saving to buy a house and she asks you to investigate the relationship between house size and selling price and to develop a model to predict the price from size.
-Some of the regression output is provided below.
Give the value of and interpret it in the context of the problem.
سؤال
سؤال
سؤال
سؤال
سؤال
سؤال
سؤال
سؤال
سؤال
سؤال
سؤال
سؤال
سؤال
سؤال
Use the following information for questions:
A car salesman is curious if he can predict the fuel efficiency of a car (in MPG) if he knows the fuel capacity of the car (in gallons). He collects data on a variety of makes and models of cars. The scatterplot shows that a linear model is appropriate. SPSS output is provided below.
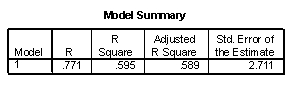
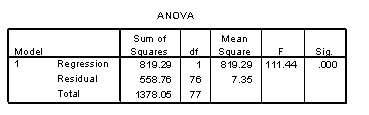
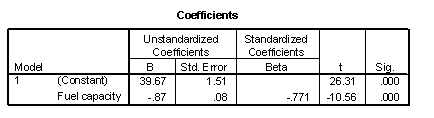
-How many cars were included in the study?
A car salesman is curious if he can predict the fuel efficiency of a car (in MPG) if he knows the fuel capacity of the car (in gallons). He collects data on a variety of makes and models of cars. The scatterplot shows that a linear model is appropriate. SPSS output is provided below.
-How many cars were included in the study?

فتح الحزمة
قم بالتسجيل لفتح البطاقات في هذه المجموعة!
Unlock Deck
Unlock Deck
1/115
العب
ملء الشاشة (f)
Deck 14: Inference About Simple Regression
1
Which expression is a regression equation for a simple linear relationship in a population?
A) = b0 + b1 x
B) = 44 + 0.60 x
C)
D)
A) = b0 + b1 x
B) = 44 + 0.60 x
C)
D)
2
The slope of the regression line tells us
A) the average value of x when y = 0.
B) the average value of y when x = 0.
C) how much the average value of y changes per one unit change in x.
D) how much the average value of x changes per one unit change in y.
A) the average value of x when y = 0.
B) the average value of y when x = 0.
C) how much the average value of y changes per one unit change in x.
D) how much the average value of x changes per one unit change in y.
how much the average value of y changes per one unit change in x.
3
A regression line is used for all of the following except one. Which one is not a valid use of a regression line?
A) to estimate the average value of y at a specified value of x.
B) to predict the value of y for an individual, given that individual's x-value.
C) to estimate the change in y for a one-unit change in x.
D) to determine if a change in x causes a change in y.
A) to estimate the average value of y at a specified value of x.
B) to predict the value of y for an individual, given that individual's x-value.
C) to estimate the change in y for a one-unit change in x.
D) to determine if a change in x causes a change in y.
to determine if a change in x causes a change in y.
4
Which statement is not one of the assumptions made about a simple linear regression model for a population?
A) The variance of Y is the same for every value of x.
B) The distribution of Y follows a normal distribution at every value of x.
C) The average (or mean) of Y changes linearly with x.
D) The deviations (or residuals) follow a normal distribution with mean .
A) The variance of Y is the same for every value of x.
B) The distribution of Y follows a normal distribution at every value of x.
C) The average (or mean) of Y changes linearly with x.
D) The deviations (or residuals) follow a normal distribution with mean
. فتح الحزمة
افتح القفل للوصول البطاقات البالغ عددها 115 في هذه المجموعة.
فتح الحزمة
k this deck
5
Which choice is not an appropriate description of in a regression equation?
A) Estimated response
B) Predicted response
C) Estimated average response
D) Observed response
A) Estimated response
B) Predicted response
C) Estimated average response
D) Observed response
فتح الحزمة
افتح القفل للوصول البطاقات البالغ عددها 115 في هذه المجموعة.
فتح الحزمة
k this deck
6
Which choice is not an appropriate term for the x variable in a regression equation?
A) independent variable
B) dependent variable
C) predictor variable
D) explanatory variable
A) independent variable
B) dependent variable
C) predictor variable
D) explanatory variable
فتح الحزمة
افتح القفل للوصول البطاقات البالغ عددها 115 في هذه المجموعة.
فتح الحزمة
k this deck
7
What is the best way to determine whether or not there is a statistically significant linear relationship between two quantitative variables?
A) Compute a regression line from a sample and see if the sample slope is 0.
B) Compute the correlation coefficient and see if it is greater than 0.5 or less than -0.5.
C) Conduct a test of the null hypothesis that the population slope is 0.
D) Conduct a test of the null hypothesis that the population intercept is 0.
فتح الحزمة
افتح القفل للوصول البطاقات البالغ عددها 115 في هذه المجموعة.
فتح الحزمة
k this deck
8
In a statistics class at Penn State University, a group working on a project recorded the time it took each of 20 students to drink a 12-ounce beverage and also recorded body weights for the students. Which of these statistical techniques would be the most appropriate for determining if there is a statistically significant relationship between drinking time and body weight? (Assume that the necessary conditions for the correct procedure are met.)
A) Compute a chi-square statistic and test to see if the two variables are independent.
B) Compute a regression line and test to see if the slope is significantly different from 0.
C) Compute a regression line and test to see if the slope is significantly different from 1.
D) Conduct a paired difference t-test to see if the mean difference is significantly different from 0.
فتح الحزمة
افتح القفل للوصول البطاقات البالغ عددها 115 في هذه المجموعة.
فتح الحزمة
k this deck
9
To determine if there is a statistically significant relationship between two quantitative variables, one test that can be conducted is
A) a t-test of the null hypotheses that the slope of the regression line is zero.
B) a t-test of the null hypotheses that the intercept of the regression line is zero.
C) a test that the correlation coefficient is less than one.
D) a test that the correlation coefficient is greater than one.
A) a t-test of the null hypotheses that the slope of the regression line is zero.
B) a t-test of the null hypotheses that the intercept of the regression line is zero.
C) a test that the correlation coefficient is less than one.
D) a test that the correlation coefficient is greater than one.
فتح الحزمة
افتح القفل للوصول البطاقات البالغ عددها 115 في هذه المجموعة.
فتح الحزمة
k this deck
10
The r2 value is reported by a researcher to be 49%. Which of the following statements is correct?
A) The explanatory variable explains 49% of the variability in the response variable.
B) The explanatory variable explains 70% of the variability in the response variable.
C) The response variable explains 49% of the variability in the explanatory variable.
D) The response variable explains 70% of the variability in the explanatory variable.
فتح الحزمة
افتح القفل للوصول البطاقات البالغ عددها 115 في هذه المجموعة.
فتح الحزمة
k this deck
11
Shown below is a scatterplot of y versus x. Which choice is most likely to be the approximate value of r2, the proportion of variation in y explained by the linear relationship with x?
A) 0%
B) 5%
C) 63%
D) 95%
Which choice is most likely to be the approximate value of r2, the proportion of variation in y explained by the linear relationship with x?A) 0%
B) 5%
C) 63%
D) 95%
فتح الحزمة
افتح القفل للوصول البطاقات البالغ عددها 115 في هذه المجموعة.
فتح الحزمة
k this deck
12
Shown below is a scatterplot of y versus x. Which choice is most likely to be the approximate value of r2, the proportion of variation in y explained by the linear relationship with x?
A) 0%
B) 63%
C) 95%
D) 99%
Which choice is most likely to be the approximate value of r2, the proportion of variation in y explained by the linear relationship with x?A) 0%
B) 63%
C) 95%
D) 99%
فتح الحزمة
افتح القفل للوصول البطاقات البالغ عددها 115 في هذه المجموعة.
فتح الحزمة
k this deck
13
Shown below is a scatterplot of y versus x.
Which choice is most likely to be the approximate value of r2, the proportion of variation in y explained by the linear relationship with x?
A) -99.5%
B) 2.0%
C) 50.0%
D) 99.5%
Which choice is most likely to be the approximate value of r2, the proportion of variation in y explained by the linear relationship with x?
A) -99.5%
B) 2.0%
C) 50.0%
D) 99.5%
فتح الحزمة
افتح القفل للوصول البطاقات البالغ عددها 115 في هذه المجموعة.
فتح الحزمة
k this deck
14
Use the following information for questions:
A regression equation is determined that describes the relationship between average January temperature (degrees Fahrenheit) and geographic latitude, based on a random sample of cities in the United States. The equation is:
Temperature = 110 - 2(Latitude).
-Estimate the average January temperature for a city at Latitude = 45.
A) 10 degrees
B) 20 degrees
C) 30 degrees
D) 45 degrees
فتح الحزمة
افتح القفل للوصول البطاقات البالغ عددها 115 في هذه المجموعة.
فتح الحزمة
k this deck
15
Use the following information for questions:
A regression equation is determined that describes the relationship between average January temperature (degrees Fahrenheit) and geographic latitude, based on a random sample of cities in the United States. The equation is:
Temperature = 110 - 2(Latitude).
-How does the estimated temperature change when latitude is increased by one?
A) It goes up 2 degrees.
B) It goes up 108 degrees.
C) It goes up 110 degrees.
D) It goes down 2 degrees.
فتح الحزمة
افتح القفل للوصول البطاقات البالغ عددها 115 في هذه المجموعة.
فتح الحزمة
k this deck
16
Use the following information for questions:
A regression equation is determined that describes the relationship between average January temperature (degrees Fahrenheit) and geographic latitude, based on a random sample of cities in the United States. The equation is:
Temperature = 110 - 2(Latitude).
-Based on the equation, what can be said about the association between temperature and latitude in the sample?
A) There is a positive association.
B) There is no association.
C) There is a negative association.
D) The direction of the association can't be determined from the equation.
فتح الحزمة
افتح القفل للوصول البطاقات البالغ عددها 115 في هذه المجموعة.
فتح الحزمة
k this deck
17
Use the following information for questions:
A regression equation is determined that describes the relationship between average January temperature (degrees Fahrenheit) and geographic latitude, based on a random sample of cities in the United States. The equation is:
Temperature = 110 - 2(Latitude).
-Suppose that the latitudes of two cities differ by 10. What is the estimated difference in the average January temperatures in the two cities?
A) 2 degrees
B) 10 degrees
C) 20 degrees
D) 90 degrees
فتح الحزمة
افتح القفل للوصول البطاقات البالغ عددها 115 في هذه المجموعة.
فتح الحزمة
k this deck
18
Use the following information for questions:
Based on a representative sample of college men, a regression line relating y = ideal weight tox = actual weight, for men, is given by
Ideal weight = 53 + 0.7 *actual weight
-For a man with actual weight = 200 pounds, his ideal weight is predicted to be
A) 153 pounds.
B) 193 pounds.
C) 200 pounds.
D) 253 pounds.
فتح الحزمة
افتح القفل للوصول البطاقات البالغ عددها 115 في هذه المجموعة.
فتح الحزمة
k this deck
19
Use the following information for questions:
Based on a representative sample of college men, a regression line relating y = ideal weight tox = actual weight, for men, is given by
Ideal weight = 53 + 0.7 *actual weight
-If a man weighs 200 pounds but his ideal weight is 210 pounds, then his residual is
A) 10 pounds.
B) -10 pounds.
C) 17 pounds.
D)-17 pounds.
فتح الحزمة
افتح القفل للوصول البطاقات البالغ عددها 115 في هذه المجموعة.
فتح الحزمة
k this deck
20
Use the following information for questions:
Based on a representative sample of college men, a regression line relating y = ideal weight tox = actual weight, for men, is given by
Ideal weight = 53 + 0.7 *actual weight
-In this situation, if a man has a residual of 10 pounds it means that
A) his predicted ideal weight is 10 pounds more than his stated ideal weight.
B) his predicted ideal weight is 10 pounds less than his stated ideal weight.
C) his predicted ideal weight is 10 pounds more than his actual weight.
D) his predicted ideal weight is 10 pounds less than his actual weight.
فتح الحزمة
افتح القفل للوصول البطاقات البالغ عددها 115 في هذه المجموعة.
فتح الحزمة
k this deck
21
Use the following information for questions:
Based on a representative sample of college men, a regression line relating y = ideal weight tox = actual weight, for men, is given by
Ideal weight = 53 + 0.7 *actual weight
-In this context, the slope of +0.7 indicates that
A) all men would like to weigh 0.7 pounds more than they do.
B) on average, men would like to weigh 0.7 pounds more than they do.
C) on average, as ideal weight increases by 1 pound actual weight increases by 0.7 pounds.
D) on average, as actual weight increases by 1 pound ideal weight increases by 0.7 pounds.
فتح الحزمة
افتح القفل للوصول البطاقات البالغ عددها 115 في هذه المجموعة.
فتح الحزمة
k this deck
22
Use the following information for questions:
The relation between y = ideal weight (lbs) and x =actual weight (lbs), based on data fromn = 119 women, resulted in the regression line = 44 + 0.60 x
-The slope of the regression line is ______
A) 119
B) 44
C) 0.60
D) None of the above
The relation between y = ideal weight (lbs) and x =actual weight (lbs), based on data fromn = 119 women, resulted in the regression line = 44 + 0.60 x
-The slope of the regression line is ______
A) 119
B) 44
C) 0.60
D) None of the above
فتح الحزمة
افتح القفل للوصول البطاقات البالغ عددها 115 في هذه المجموعة.
فتح الحزمة
k this deck
23
Use the following information for questions:
The relation between y = ideal weight (lbs) and x =actual weight (lbs), based on data fromn = 119 women, resulted in the regression line = 44 + 0.60 x
-The intercept of the regression line is ______
A) 119
B) 44
C) 0.60
D) None of the above
The relation between y = ideal weight (lbs) and x =actual weight (lbs), based on data fromn = 119 women, resulted in the regression line = 44 + 0.60 x
-The intercept of the regression line is ______
A) 119
B) 44
C) 0.60
D) None of the above
فتح الحزمة
افتح القفل للوصول البطاقات البالغ عددها 115 في هذه المجموعة.
فتح الحزمة
k this deck
24
Use the following information for questions:
The relation between y = ideal weight (lbs) and x =actual weight (lbs), based on data fromn = 119 women, resulted in the regression line = 44 + 0.60 x
-The estimated ideal weight for a women who weighs 118 pounds is ______
A) 120.0 pounds.
B) 118.0 pounds.
C) 114.8 pounds.
D) None of the above
The relation between y = ideal weight (lbs) and x =actual weight (lbs), based on data fromn = 119 women, resulted in the regression line = 44 + 0.60 x
-The estimated ideal weight for a women who weighs 118 pounds is ______
A) 120.0 pounds.
B) 118.0 pounds.
C) 114.8 pounds.
D) None of the above
فتح الحزمة
افتح القفل للوصول البطاقات البالغ عددها 115 في هذه المجموعة.
فتح الحزمة
k this deck
25
Use the following information for questions:
The relation between y = ideal weight (lbs) and x =actual weight (lbs), based on data fromn = 119 women, resulted in the regression line = 44 + 0.60 x
-What is the interpretation of the value 0.60 in the regression equation for this question?
A) The proportion of women whose ideal weight is greater than their actual weight.
B) The estimated increase in average actual weight for an increase on one pound in ideal weight.
C) The estimated increase in average ideal weight for an increase of one pound in actual weight.
D) None of the above
فتح الحزمة
افتح القفل للوصول البطاقات البالغ عددها 115 في هذه المجموعة.
فتح الحزمة
k this deck
26
Use the following information for questions:
The relation between y = ideal weight (lbs) and x =actual weight (lbs), based on data fromn = 119 women, resulted in the regression line = 44 + 0.60 x
-What is the interpretation of the value 44 in the regression for this question?
A) The slope of the regression line.
B) The difference between the actual and ideal weight for a woman who weighs 100 pounds.
C) The ideal weight for a woman who weighs 0 pounds.
D) None of the above
فتح الحزمة
افتح القفل للوصول البطاقات البالغ عددها 115 في هذه المجموعة.
فتح الحزمة
k this deck
27
Use the following information for questions:
The relation between y = ideal weight (lbs) and x =actual weight (lbs), based on data fromn = 119 women, resulted in the regression line = 44 + 0.60 x
-If a woman weighs 100 pounds and her ideal weight is just that, 100 pounds, then her residual is
A)-4 pounds
B) 4 pounds
C) 44 pounds
D) None of the above
فتح الحزمة
افتح القفل للوصول البطاقات البالغ عددها 115 في هذه المجموعة.
فتح الحزمة
k this deck
28
Use the following information for questions:
The relation between y = ideal weight (lbs) and x =actual weight (lbs), based on data fromn = 119 women, resulted in the regression line = 44 + 0.60 x
-If a woman weighs 120 pounds and her ideal weight is just that, 120 pounds, then her residual is
A)-4 pounds
B) 4 pounds
C) 44 pounds
D) None of the above
فتح الحزمة
افتح القفل للوصول البطاقات البالغ عددها 115 في هذه المجموعة.
فتح الحزمة
k this deck
29
Use the following information for questions:
A representative sample of 190 students resulted in a regression equation between y = left hand spans (cm) and x = right hand spans (cm). The least squares regression equation is = 1.46 + 0.938 x. The error sum of squares (SSE) was 76.67, and total sum of squares (SSTO) was 784.8.
-What is the estimated standard deviation for the regression, s?
A) 0.6352
B) 0.6369
C) 0.6386
D) None of the above
فتح الحزمة
افتح القفل للوصول البطاقات البالغ عددها 115 في هذه المجموعة.
فتح الحزمة
k this deck
30
Use the following information for questions:
A representative sample of 190 students resulted in a regression equation between y = left hand spans (cm) and x = right hand spans (cm). The least squares regression equation is = 1.46 + 0.938 x. The error sum of squares (SSE) was 76.67, and total sum of squares (SSTO) was 784.8.
-For a student with a right hand span of 26 cm, what is the estimated left hand span?
A) 24.39
B) 25.85
C) 29.60
D) None of the above
فتح الحزمة
افتح القفل للوصول البطاقات البالغ عددها 115 في هذه المجموعة.
فتح الحزمة
k this deck
31
Use the following information for questions:
A representative sample of 190 students resulted in a regression equation between y = left hand spans (cm) and x = right hand spans (cm). The least squares regression equation is = 1.46 + 0.938 x. The error sum of squares (SSE) was 76.67, and total sum of squares (SSTO) was 784.8.
-For a student with a right and left hand span of 26 cm, what is the value of the residual?
A) -0.152
B) 0.152
C) 25.848
D) 26
فتح الحزمة
افتح القفل للوصول البطاقات البالغ عددها 115 في هذه المجموعة.
فتح الحزمة
k this deck
32
Use the following information for questions:
A representative sample of 190 students resulted in a regression equation between y = left hand spans (cm) and x = right hand spans (cm). The least squares regression equation is = 1.46 + 0.938 x. The error sum of squares (SSE) was 76.67, and total sum of squares (SSTO) was 784.8.
-Use the empirical rule to find an interval that describes the left hand spans of approximately 95% of all individuals who have a right hand span of 26 cm.
A) (23.12, 25.66)
B) (24.57, 27.12)
C) (28.33, 30.87)
D) None of the above
فتح الحزمة
افتح القفل للوصول البطاقات البالغ عددها 115 في هذه المجموعة.
فتح الحزمة
k this deck
33
Use the following information for questions:
A representative sample of 190 students resulted in a regression equation between y = left hand spans (cm) and x = right hand spans (cm). The least squares regression equation is = 1.46 + 0.938 x. The error sum of squares (SSE) was 76.67, and total sum of squares (SSTO) was 784.8.
-What is the value of r2, the proportion of variation in left hand spans explained by the linear relationship with right hand spans.
A) 9.8%
B) 90.2%
C) 95.0%
D) None of the above
فتح الحزمة
افتح القفل للوصول البطاقات البالغ عددها 115 في هذه المجموعة.
فتح الحزمة
k this deck
34
Use the following information for questions:
The data from a representative sample of 43 male college students was used to determine a regression equation for y = weight (lbs) and x = height (inches). The least squares regression equation was = -318 + 7.00 x. The error sum of squares (SSE) was 23617; the total sum of squares (SSTO) = 34894.
-What is the estimated standard deviation for the regression, s?
A) 24.0
B) 23.7
C) 23.4
D) None of the above
فتح الحزمة
افتح القفل للوصول البطاقات البالغ عددها 115 في هذه المجموعة.
فتح الحزمة
k this deck
35
Use the following information for questions:
The data from a representative sample of 43 male college students was used to determine a regression equation for y = weight (lbs) and x = height (inches). The least squares regression equation was = -318 + 7.00 x. The error sum of squares (SSE) was 23617; the total sum of squares (SSTO) = 34894.
-For a male student with a height of 70 inches, what is the estimated weight?
A) 165
B) 170
C) 172
D) None of the above
فتح الحزمة
افتح القفل للوصول البطاقات البالغ عددها 115 في هذه المجموعة.
فتح الحزمة
k this deck
36
Use the following information for questions:
The data from a representative sample of 43 male college students was used to determine a regression equation for y = weight (lbs) and x = height (inches). The least squares regression equation was = -318 + 7.00 x. The error sum of squares (SSE) was 23617; the total sum of squares (SSTO) = 34894.
-For a male student with a height of 70 inches and a weight of 200 lbs, what is the value of the residual?
A) -28
B) 28
C) 172
D) 200
فتح الحزمة
افتح القفل للوصول البطاقات البالغ عددها 115 في هذه المجموعة.
فتح الحزمة
k this deck
37
Use the following information for questions:
The data from a representative sample of 43 male college students was used to determine a regression equation for y = weight (lbs) and x = height (inches). The least squares regression equation was = -318 + 7.00 x. The error sum of squares (SSE) was 23617; the total sum of squares (SSTO) = 34894.
-Use the empirical rule to find an interval that describes the weights of approximately 95% of male college students who are 70 inches tall.
A) (122.6, 217.4)
B) (118.2, 211.8)
C) (124, 220)
D) None of the above
فتح الحزمة
افتح القفل للوصول البطاقات البالغ عددها 115 في هذه المجموعة.
فتح الحزمة
k this deck
38
Use the following information for questions:
The data from a representative sample of 43 male college students was used to determine a regression equation for y = weight (lbs) and x = height (inches). The least squares regression equation was = -318 + 7.00 x. The error sum of squares (SSE) was 23617; the total sum of squares (SSTO) = 34894.
-What is the proportion of variation in weight that is explained by the linear relationship with height?
A) 32.3%
B) 56.9%
C) 67.7%
D) None of the above
فتح الحزمة
افتح القفل للوصول البطاقات البالغ عددها 115 في هذه المجموعة.
فتح الحزمة
k this deck
39
Use the following information for questions:
Data from a sample of 10 student is used to find a regression equation relating y = score on a 100-point exam to x = score on a 10-point quiz. The least squares regression equation is = 35 + 6 x. The standard error of the slope is 2. The following hypotheses are tested:
H0:
Ha:
-What is the value of the t-statistic for testing the hypotheses?
A) -2.0
B) 2.0
C) 3.0
D) 0
فتح الحزمة
افتح القفل للوصول البطاقات البالغ عددها 115 في هذه المجموعة.
فتح الحزمة
k this deck
40
Use the following information for questions:
Data from a sample of 10 student is used to find a regression equation relating y = score on a 100-point exam to x = score on a 10-point quiz. The least squares regression equation is = 35 + 6 x. The standard error of the slope is 2. The following hypotheses are tested:
H0:
Ha:
-What is the p-value for the test? (Table A.3 or its equivalent needed.)
A) 0.009
B) 0.018
C) 0.080
D) None of the above
فتح الحزمة
افتح القفل للوصول البطاقات البالغ عددها 115 في هذه المجموعة.
فتح الحزمة
k this deck
41
Use the following information for questions:
Data from a sample of 10 student is used to find a regression equation relating y = score on a 100-point exam to x = score on a 10-point quiz. The least squares regression equation is = 35 + 6 x. The standard error of the slope is 2. The following hypotheses are tested:
H0:
Ha:
-What is a 95% confidence interval for 1 ? (Table A.2 or its equivalent needed.)
A) (1.38, 10.62)
B) (1.48, 10.52)
C) (1.54, 10.46)
D) None of the above
فتح الحزمة
افتح القفل للوصول البطاقات البالغ عددها 115 في هذه المجموعة.
فتح الحزمة
k this deck
42
Use the following information for questions:
Data from a sample of 10 student is used to find a regression equation relating y = score on a 100-point exam to x = score on a 10-point quiz. The least squares regression equation is = 35 + 6 x. The standard error of the slope is 2. The following hypotheses are tested:
H0:
Ha:
-What is a 90% confidence interval for 1? (Table A.2 or its equivalent needed.)
A) (2.08, 9.92)
B) (2.28, 9.72)
C) (2.34, 9.66)
D) None of the above
فتح الحزمة
افتح القفل للوصول البطاقات البالغ عددها 115 في هذه المجموعة.
فتح الحزمة
k this deck
43
Use the following information for questions:
A representative sample of n = 12 male college students is used to find a regression equation for y = weight (lbs) and x = height (inches). The least squares regression equation is = 30 + 2 x. The standard error of the estimated slope is 1. The following hypotheses will be tested:
H0:
Ha:
-What is the value of the t-statistic for testing these hypotheses?
A) 1.0
B) 1.5
C) 2.0
D) 30
فتح الحزمة
افتح القفل للوصول البطاقات البالغ عددها 115 في هذه المجموعة.
فتح الحزمة
k this deck
44
Use the following information for questions:
A representative sample of n = 12 male college students is used to find a regression equation for y = weight (lbs) and x = height (inches). The least squares regression equation is = 30 + 2 x. The standard error of the estimated slope is 1. The following hypotheses will be tested:
H0:
Ha:
-What is the p-value for the test? (Table A.3 or its equivalent needed.)
A) 0.074
B) 0.162
C) 0.226
D) None of the above
فتح الحزمة
افتح القفل للوصول البطاقات البالغ عددها 115 في هذه المجموعة.
فتح الحزمة
k this deck
45
Use the following information for questions:
A representative sample of n = 12 male college students is used to find a regression equation for y = weight (lbs) and x = height (inches). The least squares regression equation is = 30 + 2 x. The standard error of the estimated slope is 1. The following hypotheses will be tested:
H0:
Ha:
-What is a 90% confidence interval for 1? (Table A.2 or its equivalent needed.)
A) (0.35, 6.65)
B) (-1.32, 5.32)
C) (0.19, 3.81)
D) (0.00, 4.00)
فتح الحزمة
افتح القفل للوصول البطاقات البالغ عددها 115 في هذه المجموعة.
فتح الحزمة
k this deck
46
Use the following information for questions:
A representative sample of n = 12 male college students is used to find a regression equation for y = weight (lbs) and x = height (inches). The least squares regression equation is = 30 + 2 x. The standard error of the estimated slope is 1. The following hypotheses will be tested:
H0:
Ha:
-What is the p-value for testing the following hypothesis about the correlation coefficient
A) 0.074
B) 0.162
C) 0.226
D) None of the above
فتح الحزمة
افتح القفل للوصول البطاقات البالغ عددها 115 في هذه المجموعة.
فتح الحزمة
k this deck
47
Use the following information for questions:
Grades for a random sample of students who have taken statistics from a certain professor over the past 20 year were used to estimate the relationship between y = grade on the final exam and x = average exam score (for the three exams given during the term).
-The results for a test of H0: 1 = 0 versus Ha 1 0 show that
A) the null hypothesis can be rejected because t = 3.91 and the p-value = 0.000.
B) the null hypothesis can be rejected because t = 14.01 and the p-value = 0.000.
C) the null hypothesis cannot be rejected because t = 3.91 and the p-value = 0.000.
D) the null hypothesis cannot be rejected because t = 14.01 and the p-value = 0.000.
فتح الحزمة
افتح القفل للوصول البطاقات البالغ عددها 115 في هذه المجموعة.
فتح الحزمة
k this deck
48
Use the following information for questions:
Grades for a random sample of students who have taken statistics from a certain professor over the past 20 year were used to estimate the relationship between y = grade on the final exam and x = average exam score (for the three exams given during the term).
-The estimate of the population standard deviation is given by
A) SSE = 17097
B) MSE = 96
C) StDev = 4.246
D) S = 9.801
فتح الحزمة
افتح القفل للوصول البطاقات البالغ عددها 115 في هذه المجموعة.
فتح الحزمة
k this deck
49
Use the following information for questions:
Grades for a random sample of students who have taken statistics from a certain professor over the past 20 year were used to estimate the relationship between y = grade on the final exam and x = average exam score (for the three exams given during the term).
-The "Fit"information shown at the end of the output is for ExamAvg = 75. From this, we can conclude that
A) the probability is about 0.95 that a randomly selected student with an exam average of 75 will score between 74 and 77 on the final exam.
B) the final exam score for a randomly selected student with an exam average of 75 is likely to be between 56 and 95.
C) about 95% of the students with an exam average of 75 will score between 74 and 77 on the final exam.
D) the average final exam score for students with an exam average of 75 is likely to be between 56 and 95.
فتح الحزمة
افتح القفل للوصول البطاقات البالغ عددها 115 في هذه المجموعة.
فتح الحزمة
k this deck
50
Use the following information for questions:
Grades for a random sample of students who have taken statistics from a certain professor over the past 20 year were used to estimate the relationship between y = grade on the final exam and x = average exam score (for the three exams given during the term).
-The two values used to determine r2 are
A) 17097 and 35952
B) 96 and 17097
C) 1 and 178
D) 178 and 179
فتح الحزمة
افتح القفل للوصول البطاقات البالغ عددها 115 في هذه المجموعة.
فتح الحزمة
k this deck
51
For the regression line = b0 + b1 x, explain what the values b0 and b1 represent.
فتح الحزمة
افتح القفل للوصول البطاقات البالغ عددها 115 في هذه المجموعة.
فتح الحزمة
k this deck
52
Use the following information for questions:
A regression line relating y =student's height (inches) to x = father's height (inches) for n = 70 college males is = 15 + 0.8 x.
-What is the estimated height of a son whose father's height is 70 inches?
A regression line relating y =student's height (inches) to x = father's height (inches) for n = 70 college males is = 15 + 0.8 x.
-What is the estimated height of a son whose father's height is 70 inches?
فتح الحزمة
افتح القفل للوصول البطاقات البالغ عددها 115 في هذه المجموعة.
فتح الحزمة
k this deck
53
Use the following information for questions:
A regression line relating y =student's height (inches) to x = father's height (inches) for n = 70 college males is = 15 + 0.8 x.
-If the son's actual height is 68 inches, what is the value of the residual?
A regression line relating y =student's height (inches) to x = father's height (inches) for n = 70 college males is = 15 + 0.8 x.
-If the son's actual height is 68 inches, what is the value of the residual?
فتح الحزمة
افتح القفل للوصول البطاقات البالغ عددها 115 في هذه المجموعة.
فتح الحزمة
k this deck
54
Use the following information for questions:
A linear regression analysis of the relationship between y = daily hours of TV watched andx = age is done using data from n = 50 adults. The error sum of squares is SSE = 1,000. The total sum of squares is SSTO = 5,000.
-What is the estimated standard deviation of the regression, s?
A linear regression analysis of the relationship between y = daily hours of TV watched andx = age is done using data from n = 50 adults. The error sum of squares is SSE = 1,000. The total sum of squares is SSTO = 5,000.
-What is the estimated standard deviation of the regression, s?
فتح الحزمة
افتح القفل للوصول البطاقات البالغ عددها 115 في هذه المجموعة.
فتح الحزمة
k this deck
55
Use the following information for questions:
A linear regression analysis of the relationship between y = daily hours of TV watched andx = age is done using data from n = 50 adults. The error sum of squares is SSE = 1,000. The total sum of squares is SSTO = 5,000.
-What is the value of r2, the proportion of variation in daily hours of TV watching explained by the linear relationship with x = age?
فتح الحزمة
افتح القفل للوصول البطاقات البالغ عددها 115 في هذه المجموعة.
فتح الحزمة
k this deck
56
Use the following information for questions:
A linear regression analysis of the relationship between y = grade point average and x = hours studied per week is done using data from n = 10 students. The error sum of squares is SSE = 100 and the total sum of squares is SSTO = 900.
-What is the value of s = estimated standard deviation for the regression?
فتح الحزمة
افتح القفل للوصول البطاقات البالغ عددها 115 في هذه المجموعة.
فتح الحزمة
k this deck
57
Use the following information for questions:
A linear regression analysis of the relationship between y = grade point average and x = hours studied per week is done using data from n = 10 students. The error sum of squares is SSE = 100 and the total sum of squares is SSTO = 900.
-What is the value of r2, the proportion of variation in grade point average explained by the linear relationship with x = hours studied per week?
فتح الحزمة
افتح القفل للوصول البطاقات البالغ عددها 115 في هذه المجموعة.
فتح الحزمة
k this deck
58
Use the following information for questions:
A regression line relating y = hours of sleep the previous day to x =hours studied the previous day is estimated using data from n = 10 students. The estimated slope b1 = -0.30. The standard error of the slope is s.e.(b1) = 0.20.
-What is the value of the test statistic for the following hypothesis test about , the population slope?
H0:
Ha:
فتح الحزمة
افتح القفل للوصول البطاقات البالغ عددها 115 في هذه المجموعة.
فتح الحزمة
k this deck
59
Use the following information for questions:
A regression line relating y = hours of sleep the previous day to x =hours studied the previous day is estimated using data from n = 10 students. The estimated slope b1 = -0.30. The standard error of the slope is s.e.(b1) = 0.20.
-What is the value of the p-value for the test in question 59?
A regression line relating y = hours of sleep the previous day to x =hours studied the previous day is estimated using data from n = 10 students. The estimated slope b1 = -0.30. The standard error of the slope is s.e.(b1) = 0.20.
-What is the value of the p-value for the test in question 59?
فتح الحزمة
افتح القفل للوصول البطاقات البالغ عددها 115 في هذه المجموعة.
فتح الحزمة
k this deck
60
Use the following information for questions:
A regression line relating y = hours of sleep the previous day to x =hours studied the previous day is estimated using data from n = 10 students. The estimated slope b1 = -0.30. The standard error of the slope is s.e.(b1) = 0.20.
-What is a 90% confidence interval for 1 , the population slope?
A regression line relating y = hours of sleep the previous day to x =hours studied the previous day is estimated using data from n = 10 students. The estimated slope b1 = -0.30. The standard error of the slope is s.e.(b1) = 0.20.
-What is a 90% confidence interval for 1 , the population slope?
فتح الحزمة
افتح القفل للوصول البطاقات البالغ عددها 115 في هذه المجموعة.
فتح الحزمة
k this deck
61
Use the following information for questions:
A regression line relating y =grade point average to x = hours studied per week is estimated using data for n = 5 students. The estimated slope is b1 = 0.02. The standard error of the slope is s.e.(b1) = 0.01.
-What is the value of the test statistic for the following hypothesis test about , the population slope?
H0:
Ha:
فتح الحزمة
افتح القفل للوصول البطاقات البالغ عددها 115 في هذه المجموعة.
فتح الحزمة
k this deck
62
Use the following information for questions:
A regression line relating y =grade point average to x = hours studied per week is estimated using data for n = 5 students. The estimated slope is b1 = 0.02. The standard error of the slope is s.e.(b1) = 0.01.
-What is the value of the p-value for the test in question 62?
A regression line relating y =grade point average to x = hours studied per week is estimated using data for n = 5 students. The estimated slope is b1 = 0.02. The standard error of the slope is s.e.(b1) = 0.01.
-What is the value of the p-value for the test in question 62?
فتح الحزمة
افتح القفل للوصول البطاقات البالغ عددها 115 في هذه المجموعة.
فتح الحزمة
k this deck
63
Use the following information for questions:
A regression line relating y =grade point average to x = hours studied per week is estimated using data for n = 5 students. The estimated slope is b1 = 0.02. The standard error of the slope is s.e.(b1) = 0.01.
-What is a 95% confidence interval for 1 , the population slope ?
A regression line relating y =grade point average to x = hours studied per week is estimated using data for n = 5 students. The estimated slope is b1 = 0.02. The standard error of the slope is s.e.(b1) = 0.01.
-What is a 95% confidence interval for 1 , the population slope ?
فتح الحزمة
افتح القفل للوصول البطاقات البالغ عددها 115 في هذه المجموعة.
فتح الحزمة
k this deck
64
Use the following information for questions:
Data has been obtained on the house size (in square feet) and the selling price (in dollars) for a sample of 100 homes in your town. Your friend is saving to buy a house and she asks you to investigate the relationship between house size and selling price and to develop a model to predict the price from size.
-Identify the response and the explanatory variable.
فتح الحزمة
افتح القفل للوصول البطاقات البالغ عددها 115 في هذه المجموعة.
فتح الحزمة
k this deck
65
Use the following information for questions:
Data has been obtained on the house size (in square feet) and the selling price (in dollars) for a sample of 100 homes in your town. Your friend is saving to buy a house and she asks you to investigate the relationship between house size and selling price and to develop a model to predict the price from size.
-Consider the scatterplot below.
Does a linear relationship between price and size seem reasonable? If so, what appears to be the direction of the relationship?
Data has been obtained on the house size (in square feet) and the selling price (in dollars) for a sample of 100 homes in your town. Your friend is saving to buy a house and she asks you to investigate the relationship between house size and selling price and to develop a model to predict the price from size.
-Consider the scatterplot below.
Does a linear relationship between price and size seem reasonable? If so, what appears to be the direction of the relationship? فتح الحزمة
افتح القفل للوصول البطاقات البالغ عددها 115 في هذه المجموعة.
فتح الحزمة
k this deck
66
Use the following information for questions:
Data has been obtained on the house size (in square feet) and the selling price (in dollars) for a sample of 100 homes in your town. Your friend is saving to buy a house and she asks you to investigate the relationship between house size and selling price and to develop a model to predict the price from size.
-Some of the regression output is provided below.
Give the value of and interpret it in the context of the problem.
فتح الحزمة
افتح القفل للوصول البطاقات البالغ عددها 115 في هذه المجموعة.
فتح الحزمة
k this deck
67
Use the following information for questions:
Data has been obtained on the house size (in square feet) and the selling price (in dollars) for a sample of 100 homes in your town. Your friend is saving to buy a house and she asks you to investigate the relationship between house size and selling price and to develop a model to predict the price from size.
-Give the least square regression equation for predicting price from house size.
فتح الحزمة
افتح القفل للوصول البطاقات البالغ عددها 115 في هذه المجموعة.
فتح الحزمة
k this deck
68
Use the following information for questions:
Data has been obtained on the house size (in square feet) and the selling price (in dollars) for a sample of 100 homes in your town. Your friend is saving to buy a house and she asks you to investigate the relationship between house size and selling price and to develop a model to predict the price from size.
-What is the estimated change in the average selling price of a house for an increase in house size of 100 square feet?
فتح الحزمة
افتح القفل للوصول البطاقات البالغ عددها 115 في هذه المجموعة.
فتح الحزمة
k this deck
69
Use the following information for questions:
Data has been obtained on the house size (in square feet) and the selling price (in dollars) for a sample of 100 homes in your town. Your friend is saving to buy a house and she asks you to investigate the relationship between house size and selling price and to develop a model to predict the price from size.
-Predict the price for the 60th observed house, which had a home size of 2430 square feet.
فتح الحزمة
افتح القفل للوصول البطاقات البالغ عددها 115 في هذه المجموعة.
فتح الحزمة
k this deck
70
Use the following information for questions:
Data has been obtained on the house size (in square feet) and the selling price (in dollars) for a sample of 100 homes in your town. Your friend is saving to buy a house and she asks you to investigate the relationship between house size and selling price and to develop a model to predict the price from size.
-The observed selling price for that house was $200,000. Compute the residual value.
فتح الحزمة
افتح القفل للوصول البطاقات البالغ عددها 115 في هذه المجموعة.
فتح الحزمة
k this deck
71
Use the following information for questions:
Data has been obtained on the house size (in square feet) and the selling price (in dollars) for a sample of 100 homes in your town. Your friend is saving to buy a house and she asks you to investigate the relationship between house size and selling price and to develop a model to predict the price from size.
-Write the null and alternative hypotheses for assessing if there is a significant positive linear relationship between price and size for the population of all houses in your town.
فتح الحزمة
افتح القفل للوصول البطاقات البالغ عددها 115 في هذه المجموعة.
فتح الحزمة
k this deck
72
Use the following information for questions:
Data has been obtained on the house size (in square feet) and the selling price (in dollars) for a sample of 100 homes in your town. Your friend is saving to buy a house and she asks you to investigate the relationship between house size and selling price and to develop a model to predict the price from size.
-Report the corresponding p-value and state the conclusion in context of this problem.
فتح الحزمة
افتح القفل للوصول البطاقات البالغ عددها 115 في هذه المجموعة.
فتح الحزمة
k this deck
73
What is the main distinction between a confidence interval and a prediction interval?
A) A confidence interval estimates the mean value of y at a particular value of x, while a prediction interval estimates the range of y values at a particular value of x.
B) A prediction interval estimates the mean value of y at a particular value of x, while a confidence interval estimates the range of y values at a particular value of x.
C) A confidence interval and a prediction interval are the same thing; they both estimate the mean value of y at a particular value of x.
D) A confidence interval and a prediction interval are the same thing; they both estimate the range of y values at a particular value of x.
فتح الحزمة
افتح القفل للوصول البطاقات البالغ عددها 115 في هذه المجموعة.
فتح الحزمة
k this deck
74
Use the following information for questions:
A sample of 19 female bears was measured for chest girth (y) and neck girth (x), both in inches. The least squares regression equation relating the two variables is = 5.32 + 1.53 x. The standard deviation of the regression is s = 3.692.
-What is a 95% confidence interval for the average (or mean) chest girth for bears with a neck girth of 20 inches? The standard error of the fit is s.e.(fit) = 0.880
A) (27.9, 43.9)
B) (28.1, 43.7)
C) (34.1, 37.8)
D) None of the above
فتح الحزمة
افتح القفل للوصول البطاقات البالغ عددها 115 في هذه المجموعة.
فتح الحزمة
k this deck
75
Use the following information for questions:
A sample of 19 female bears was measured for chest girth (y) and neck girth (x), both in inches. The least squares regression equation relating the two variables is = 5.32 + 1.53 x. The standard deviation of the regression is s = 3.692.
-What is a 95% prediction interval for the chest girth of a bear with a neck girth of 20 inches? The standard error of the fit, s.e.(fit), = 0.880
A) (27.9, 43.9)
B) (28.1, 43.7)
C) (34.1, 37.8)
D) None of the above
فتح الحزمة
افتح القفل للوصول البطاقات البالغ عددها 115 في هذه المجموعة.
فتح الحزمة
k this deck
76
Use the following information for questions:
A sample of 19 female bears was measured for chest girth (y) and neck girth (x), both in inches. The least squares regression equation relating the two variables is = 5.32 + 1.53 x. The standard deviation of the regression is s = 3.692.
-What is a 95% confidence interval for the average (or mean) chest girth for bears with a neck girth of 18 inches? The standard error of the fit, s.e.(fit), = 0.860.
A) (24.9, 40.9)
B) (28.1, 43.7)
C) (31.0, 34.7)
D) None of the above
فتح الحزمة
افتح القفل للوصول البطاقات البالغ عددها 115 في هذه المجموعة.
فتح الحزمة
k this deck
77
Use the following information for questions:
A sample of 19 female bears was measured for chest girth (y) and neck girth (x), both in inches. The least squares regression equation relating the two variables is = 5.32 + 1.53 x. The standard deviation of the regression is s = 3.692.
-What is a 95% prediction interval for the chest girth of a bear with a neck girth of 18 inches? The standard error of the fit, s.e.(fit), = 0.860
A) (24.9, 40.9)
B) (28.1, 43.7)
C) (31.0, 34.7)
D) None of the above
فتح الحزمة
افتح القفل للوصول البطاقات البالغ عددها 115 في هذه المجموعة.
فتح الحزمة
k this deck
78
Use the following information for questions:
A regression line that relates y = hand span (cm) and x = height (inches) is = -1 + 0.3 x. The sample size was n = 5 adults. The standard deviation of the regression is s = 1 cm. For height = 60 inches, the standard error of the fit is s.e.(fit) = 1 cm.
-What is a 90% prediction interval for the hand span of a person whose height is 60 inches?
فتح الحزمة
افتح القفل للوصول البطاقات البالغ عددها 115 في هذه المجموعة.
فتح الحزمة
k this deck
79
Use the following information for questions:
A regression line that relates y = hand span (cm) and x = height (inches) is = -1 + 0.3 x. The sample size was n = 5 adults. The standard deviation of the regression is s = 1 cm. For height = 60 inches, the standard error of the fit is s.e.(fit) = 1 cm.
-What is a 90% confidence interval for the mean hand span of people who are 60 inches tall?
فتح الحزمة
افتح القفل للوصول البطاقات البالغ عددها 115 في هذه المجموعة.
فتح الحزمة
k this deck
80
Use the following information for questions:
A car salesman is curious if he can predict the fuel efficiency of a car (in MPG) if he knows the fuel capacity of the car (in gallons). He collects data on a variety of makes and models of cars. The scatterplot shows that a linear model is appropriate. SPSS output is provided below.
-How many cars were included in the study?
فتح الحزمة
افتح القفل للوصول البطاقات البالغ عددها 115 في هذه المجموعة.
فتح الحزمة
k this deck
فتح الحزمة
افتح القفل للوصول البطاقات البالغ عددها 115 في هذه المجموعة.


