Deck 15: More About Inference for Categorical Variables
ملء الشاشة (f)
سؤال
سؤال
سؤال
سؤال
سؤال
سؤال
سؤال
سؤال
سؤال
سؤال
سؤال
سؤال
سؤال
Which of the following gives statistically significant results at the 0.05 level of significance?
A) = 7, df = 3
B) 11ef1ddf_26b0_ad5e_96e7_b538563cf6bb_TB10510_11= 20, df = 11
C) 11ef1ddf_26b0_ad5e_96e7_b538563cf6bb_TB10510_11 = 24, df = 15
D) 11ef1ddf_26b0_ad5e_96e7_b538563cf6bb_TB10510_11 = 10, df = 5
A)
= 7, df = 3B) 11ef1ddf_26b0_ad5e_96e7_b538563cf6bb_TB10510_11= 20, df = 11
C) 11ef1ddf_26b0_ad5e_96e7_b538563cf6bb_TB10510_11 = 24, df = 15
D) 11ef1ddf_26b0_ad5e_96e7_b538563cf6bb_TB10510_11 = 10, df = 5
سؤال
Which of the following gives statistically significant results at the 0.01 level of significance?
A)= 9.1, df = 2
B) 11ef1ddf_26b0_ad5e_96e7_b538563cf6bb_TB10510_11= 5.3, df = 1
C) 11ef1ddf_26b0_ad5e_96e7_b538563cf6bb_TB10510_11 = 13.8, df = 4
D)11ef1ddf_26b0_ad5e_96e7_b538563cf6bb_TB10510_11= 14.1, df = 5
A)
= 9.1, df = 2B) 11ef1ddf_26b0_ad5e_96e7_b538563cf6bb_TB10510_11= 5.3, df = 1
C) 11ef1ddf_26b0_ad5e_96e7_b538563cf6bb_TB10510_11 = 13.8, df = 4
D)11ef1ddf_26b0_ad5e_96e7_b538563cf6bb_TB10510_11= 14.1, df = 5
سؤال
Which of the following gives statistically significant results?
A)= 10.23, df = 5, = 0.05
B) 11ef1ddf_26b0_ad5e_96e7_b538563cf6bb_TB10510_11 = 10.23, df = 4, = 0.01
C) 11ef1ddf_26b0_ad5e_96e7_b538563cf6bb_TB10510_11 = 10.23, df = 7, = 0.10
D) 11ef1ddf_26b0_ad5e_96e7_b538563cf6bb_TB10510_11= 10.23, df = 3, = 0.025
A)
= 10.23, df = 5, = 0.05B) 11ef1ddf_26b0_ad5e_96e7_b538563cf6bb_TB10510_11 = 10.23, df = 4, = 0.01
C) 11ef1ddf_26b0_ad5e_96e7_b538563cf6bb_TB10510_11 = 10.23, df = 7, = 0.10
D) 11ef1ddf_26b0_ad5e_96e7_b538563cf6bb_TB10510_11= 10.23, df = 3, = 0.025
سؤال
سؤال
سؤال
سؤال
Use the following information for questions:
In the General Social Survey, respondents were asked what they thought was most important to get ahead: hard work, lucky breaks, or both. Minitab output for 1026 respondents, by gender, is shown below: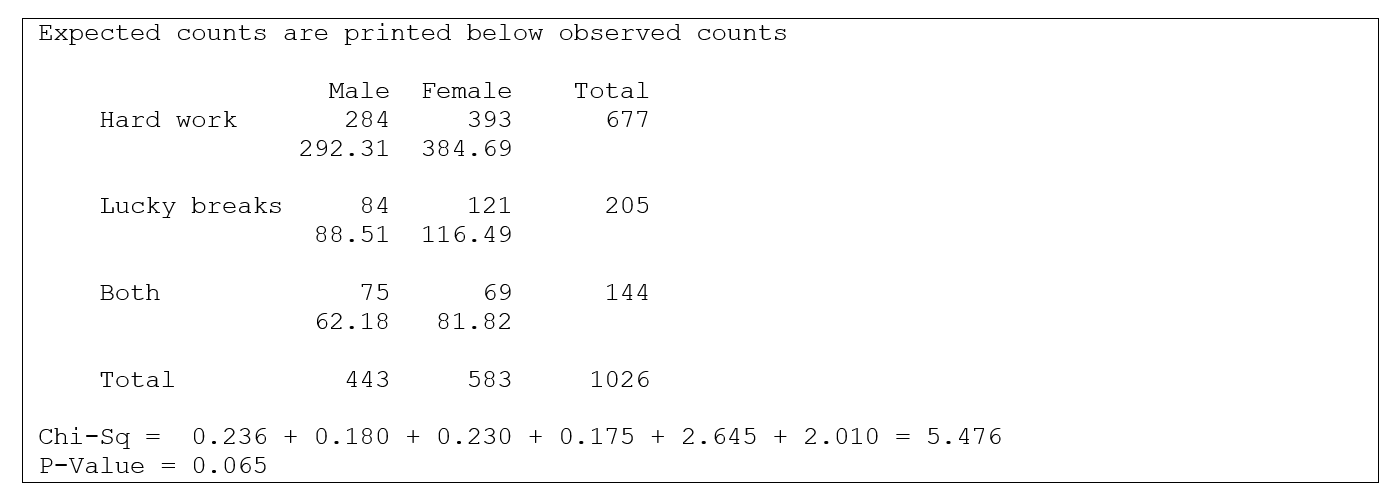
-What is the null hypothesis for this situation?
A) There is a relationship between gender and opinion on what is important to get ahead in the sample.
B) There is no relationship between gender and opinion on what is important to get ahead in the sample.
C) There is a relationship between gender and opinion on what is important to get ahead in the population.
D) There is no relationship between gender and opinion on what is important to get ahead in the population.
سؤال
Use the following information for questions:
In the General Social Survey, respondents were asked what they thought was most important to get ahead: hard work, lucky breaks, or both. Minitab output for 1026 respondents, by gender, is shown below:
-What is the alternative hypothesis for this situation?
A) There is a relationship between gender and opinion on what is important to get ahead in the sample.
B) There is no relationship between gender and opinion on what is important to get ahead in the sample.
C) There is a relationship between gender and opinion on what is important to get ahead in the population.
D) There is no relationship between gender and opinion on what is important to get ahead in the population.
سؤال
Use the following information for questions:
In the General Social Survey, respondents were asked what they thought was most important to get ahead: hard work, lucky breaks, or both. Minitab output for 1026 respondents, by gender, is shown below:
-What is the value of the test statistic?
A) 443
B) 583
C) 5.476
D) None of the above
In the General Social Survey, respondents were asked what they thought was most important to get ahead: hard work, lucky breaks, or both. Minitab output for 1026 respondents, by gender, is shown below:
-What is the value of the test statistic?
A) 443
B) 583
C) 5.476
D) None of the above
سؤال
Use the following information for questions:
In the General Social Survey, respondents were asked what they thought was most important to get ahead: hard work, lucky breaks, or both. Minitab output for 1026 respondents, by gender, is shown below:
-What are the degrees of freedom for the test statistic?
A) 2
B) 3
C) 4
D) None of the above
In the General Social Survey, respondents were asked what they thought was most important to get ahead: hard work, lucky breaks, or both. Minitab output for 1026 respondents, by gender, is shown below:
-What are the degrees of freedom for the test statistic?
A) 2
B) 3
C) 4
D) None of the above
سؤال
Use the following information for questions:
In the General Social Survey, respondents were asked what they thought was most important to get ahead: hard work, lucky breaks, or both. Minitab output for 1026 respondents, by gender, is shown below:
-At a significance level of 0.05, what is the conclusion?
A) Reject the null hypothesis and conclude there is no relationship between the variables.
B) Reject the null hypothesis and conclude there is a relationship between the variables.
C) Do not reject the null hypothesis and conclude the evidence is not strong enough to show a relationship between the two variables.
D) Do not reject the null hypothesis and conclude there is a relationship between the variables.
سؤال
Use the following information for questions:
In the General Social Survey, respondents were asked "If your party nominated a woman for President, would you vote for her if she were qualified for the job?" Minitab output for 953 respondents, by race, is shown below: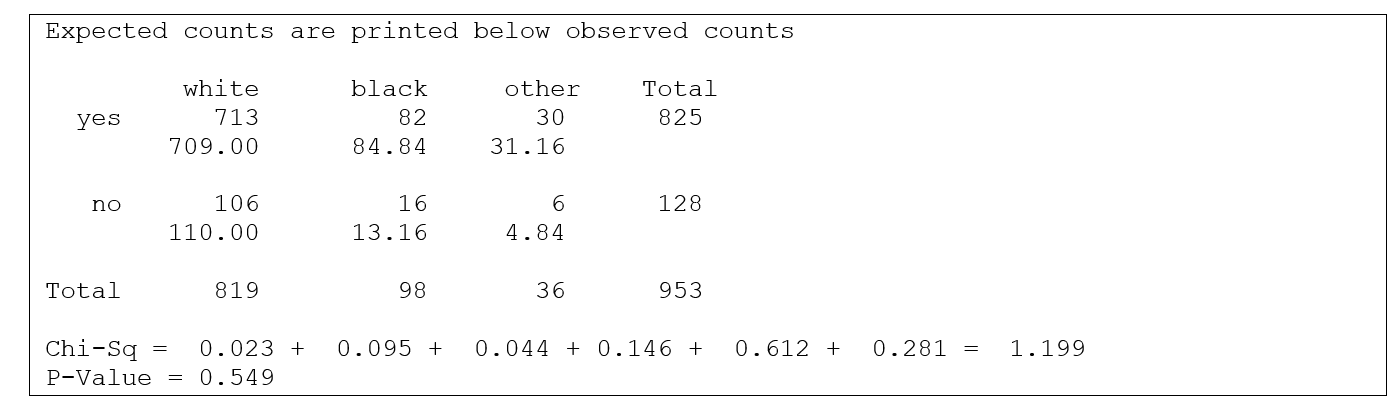
-What is the null hypothesis for this situation?
A) There is a relationship between race and opinion on voting for a female president in the sample.
B) There is no relationship between race and opinion on voting for a female president in the sample.
C) There is a relationship between race and opinion on voting for a female president in the population.
D) There is no relationship between race and opinion on voting for a female president in the population.
سؤال
Use the following information for questions:
In the General Social Survey, respondents were asked "If your party nominated a woman for President, would you vote for her if she were qualified for the job?" Minitab output for 953 respondents, by race, is shown below:
-What is the alternative hypothesis for this situation?
A) There is a relationship between race and opinion on voting for a female president in the sample.
B) There is no relationship between race and opinion on voting for a female president in the sample.
C) There is a relationship between race and opinion on voting for a female president in the population.
D) There is no relationship between race and opinion on voting for a female president in the population.
سؤال
Use the following information for questions:
In the General Social Survey, respondents were asked "If your party nominated a woman for President, would you vote for her if she were qualified for the job?" Minitab output for 953 respondents, by race, is shown below:
-What is the value of the test statistic?
A) 953
B) 1.199
C) 0.549
D) None of the above
سؤال
Use the following information for questions:
In the General Social Survey, respondents were asked "If your party nominated a woman for President, would you vote for her if she were qualified for the job?" Minitab output for 953 respondents, by race, is shown below:
-What are the degrees of freedom for the test statistic?
A) 2
B) 3
C) 4
D) None of the above
سؤال
Use the following information for questions:
In the General Social Survey, respondents were asked "If your party nominated a woman for President, would you vote for her if she were qualified for the job?" Minitab output for 953 respondents, by race, is shown below:
-At a significance level of 0.05, what is the conclusion?
A) Reject the null hypothesis and conclude there is no relationship between the variables.
B) Reject the null hypothesis and conclude there is a relationship between the variables.
C) Do not reject the null hypothesis and conclude the evidence is not strong enough to show a relationship between the two variables.
D) Do not reject the null hypothesis and conclude there is a relationship between the variables.
سؤال
سؤال
Use the following information for questions:
A researcher conducted a study on college students to see if there was a link between gender and how often they have cheated on an exam. She asked two questions on a survey:
(1) What is your gender? Male ___ Female ___
(2) How many times have you cheated on an exam while in college?
Never __ 1 or 2 times ___ 3 or more times ___
A two-way table of observed counts follows:
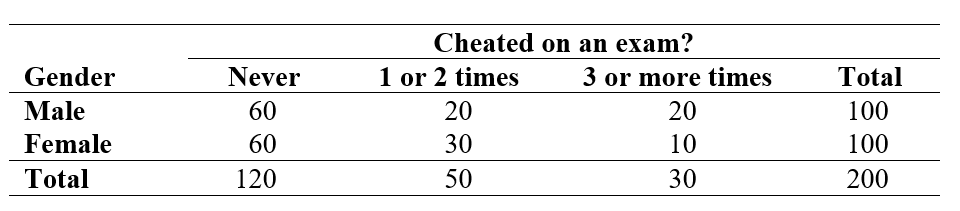
-Considering the researcher's objectives, what is the appropriate null hypothesis to test?
A) p = 0.50 where p = probability of answering "Never" to question (2) on the survey.
B) There is a difference between males and females with regard to the distribution of responses.
C) There is no relationship between the two variables.
D) There is a relationship between the two variables.
A researcher conducted a study on college students to see if there was a link between gender and how often they have cheated on an exam. She asked two questions on a survey:
(1) What is your gender? Male ___ Female ___
(2) How many times have you cheated on an exam while in college?
Never __ 1 or 2 times ___ 3 or more times ___
A two-way table of observed counts follows:
-Considering the researcher's objectives, what is the appropriate null hypothesis to test?
A) p = 0.50 where p = probability of answering "Never" to question (2) on the survey.
B) There is a difference between males and females with regard to the distribution of responses.
C) There is no relationship between the two variables.
D) There is a relationship between the two variables.
سؤال
Use the following information for questions:
A researcher conducted a study on college students to see if there was a link between gender and how often they have cheated on an exam. She asked two questions on a survey:
(1) What is your gender? Male ___ Female ___
(2) How many times have you cheated on an exam while in college?
Never __ 1 or 2 times ___ 3 or more times ___
A two-way table of observed counts follows:
-What are the degrees of freedom for the test statistic?
A) 6
B) 5
C) 3
D) 2
سؤال
Use the following information for questions:
A researcher conducted a study on college students to see if there was a link between gender and how often they have cheated on an exam. She asked two questions on a survey:
(1) What is your gender? Male ___ Female ___
(2) How many times have you cheated on an exam while in college?
Never __ 1 or 2 times ___ 3 or more times ___
A two-way table of observed counts follows:
-How many female students would you expect to have cheated once or twice if the null hypothesis were true?
A) 20
B) 25
C) 30
D) 50
سؤال
Use the following information for questions:
A researcher conducted a study on college students to see if there was a link between gender and how often they have cheated on an exam. She asked two questions on a survey:
(1) What is your gender? Male ___ Female ___
(2) How many times have you cheated on an exam while in college?
Never __ 1 or 2 times ___ 3 or more times ___
A two-way table of observed counts follows:
-The value of the -test statistic is 5.33. Are the results statistically significant at the 5% significance level?
A) Yes, because 5.33 is greater than the critical value of 3.84.
B) Yes, because 5.33 is greater than the critical value of 4.01.
C) No, because 5.33 is smaller than the critical value of 5.99.
D) No, because 5.33 is smaller than the critical value of 11.07.
A researcher conducted a study on college students to see if there was a link between gender and how often they have cheated on an exam. She asked two questions on a survey:
(1) What is your gender? Male ___ Female ___
(2) How many times have you cheated on an exam while in college?
Never __ 1 or 2 times ___ 3 or more times ___
A two-way table of observed counts follows:
-The value of the
-test statistic is 5.33. Are the results statistically significant at the 5% significance level?A) Yes, because 5.33 is greater than the critical value of 3.84.
B) Yes, because 5.33 is greater than the critical value of 4.01.
C) No, because 5.33 is smaller than the critical value of 5.99.
D) No, because 5.33 is smaller than the critical value of 11.07.
سؤال
Use the following information for questions:
Is there a relationship between the color of one's eyes and the comparative lengths of one's index and ring fingers? Students were asked "which finger is longer: your index finger or your ring finger? Or are they the same?" They also reported the color of their eyes (blue, brown, green, or hazel). The analysis of the results is given below.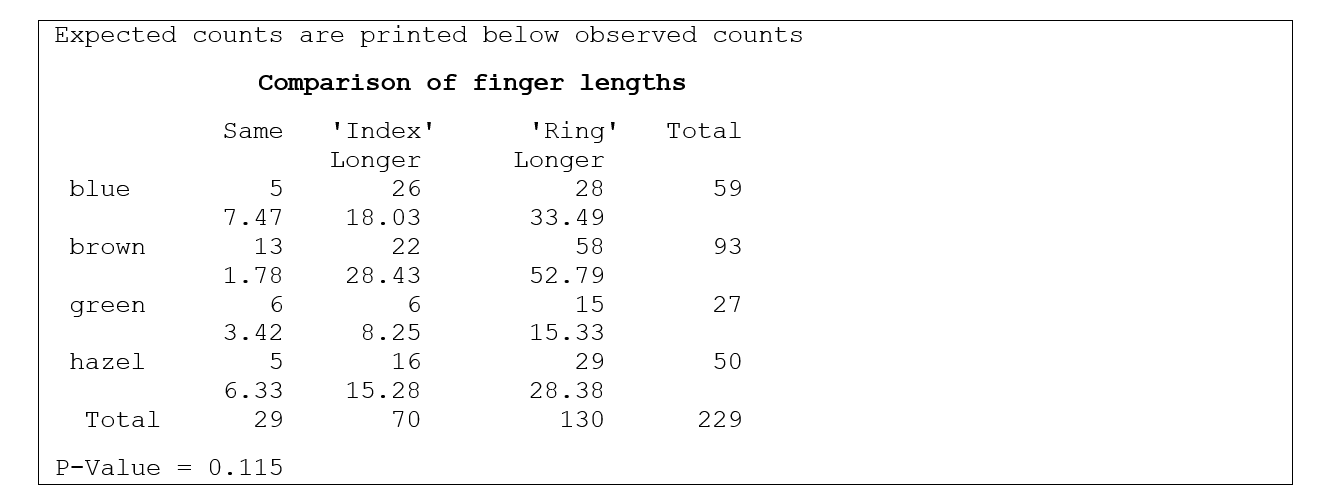
-What is the appropriate statistical technique to analyze the data?
A) A chi-square test for association.
B) A chi-square goodness-of-fit test.
C) A two-sample t-test.
D) Analysis of variance.
سؤال
Use the following information for questions:
Is there a relationship between the color of one's eyes and the comparative lengths of one's index and ring fingers? Students were asked "which finger is longer: your index finger or your ring finger? Or are they the same?" They also reported the color of their eyes (blue, brown, green, or hazel). The analysis of the results is given below.
-From the analysis shown, what can we conclude at the 10%significance level?
A) There is a statistically significant relationship between eye color and the comparative length of the index and ring fingers.
B) There is no statistically significant relationship between eye color and the comparative length of the index and ring fingers.
C) There is insufficient information given because the degrees of freedom of the test statistic are not specified.
D) There is a statistically significant relationship between eye color and the comparative length of the index and ring fingers for some eye colors but not for others.
سؤال
Use the following information for questions:
Is there a relationship between the color of one's eyes and the comparative lengths of one's index and ring fingers? Students were asked "which finger is longer: your index finger or your ring finger? Or are they the same?" They also reported the color of their eyes (blue, brown, green, or hazel). The analysis of the results is given below.
-What are the degrees of freedom for this test?
A) 2
B) 3
C) 6
D) 12
سؤال
Use the following information for questions:
Is there a relationship between the color of one's eyes and the comparative lengths of one's index and ring fingers? Students were asked "which finger is longer: your index finger or your ring finger? Or are they the same?" They also reported the color of their eyes (blue, brown, green, or hazel). The analysis of the results is given below.
-What is the expected count for "blue eyes"and "same"?
A) 59/3
B) 29/4
C) 229/12
D) (59)(29)/229
سؤال
Use the following information for questions:
In the 1994 General Social Survey, a nationwide survey done every other year in the United States, the 1,185 respondents who had ever been married were asked the age at which they first wed and whether they had ever been divorced. The two-way table below summarizes the observed counts for the relationship between "age first wed" (categorized into four age groups) and "ever divorce" (no or yes). A chi-square value and p-value are given below the table.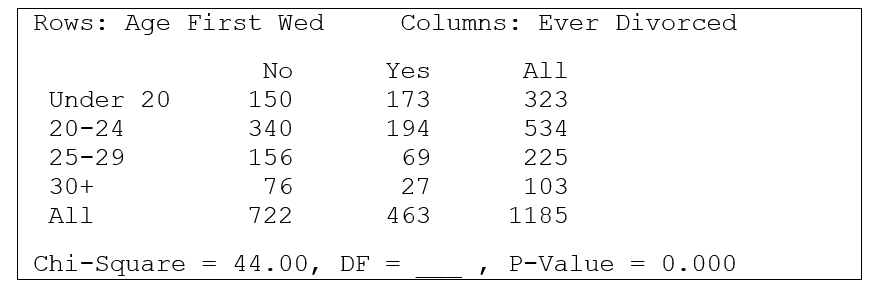
-What is the appropriate null hypothesis for this table?
A) In the sample, there is a relationship between "age first wed' and "ever divorced".
B) In the population represented by the sample, there is a relationship between "age first wed' and "ever divorced".
C) In the sample, there is no relationship between "age first wed' and "ever divorced".
D) In the population represented by the sample, there is no relationship between "age first wed' and "ever divorced".
سؤال
Use the following information for questions:
In the 1994 General Social Survey, a nationwide survey done every other year in the United States, the 1,185 respondents who had ever been married were asked the age at which they first wed and whether they had ever been divorced. The two-way table below summarizes the observed counts for the relationship between "age first wed" (categorized into four age groups) and "ever divorce" (no or yes). A chi-square value and p-value are given below the table.
-The p-value is given as 0.000. This value was calculated as
A) the area to the right of 44.00 under a chi-square distribution with df = 3.
B) the area to the right of 44.00 under a chi-square distribution with df = 8.
C) the area to the left of 44.00 under a chi-square distribution with df = 3.
D) the area to the left of 44.00 under a chi-square distribution with df = 8.
سؤال
Use the following information for questions:
In the 1994 General Social Survey, a nationwide survey done every other year in the United States, the 1,185 respondents who had ever been married were asked the age at which they first wed and whether they had ever been divorced. The two-way table below summarizes the observed counts for the relationship between "age first wed" (categorized into four age groups) and "ever divorce" (no or yes). A chi-square value and p-value are given below the table.
-What is the expected count for the "Under 20" and "No" cell?
A) (323)(1/3)
B) 150
C) (323)(722)/1185
D) (1185)(1/8)
سؤال
Use the following information for questions:
In the 1994 General Social Survey, a nationwide survey done every other year in the United States, the 1,185 respondents who had ever been married were asked the age at which they first wed and whether they had ever been divorced. The two-way table below summarizes the observed counts for the relationship between "age first wed" (categorized into four age groups) and "ever divorce" (no or yes). A chi-square value and p-value are given below the table.
-Among those first wed under the age of 20, what proportion has ever been divorced?
A) 173/1185
B) 173/463
C) 173/150
D) 173/323
سؤال
Use the following information for questions:
Students in a statistics class were asked, "With whom do you find it easier to make friends: person of the same sex, person of opposite sex, or no preference?" A table summarizing the responses by gender is given below. Minitab results for a chi-square test for these data were "Chi-Sq = 7.15 p-value = 0.028.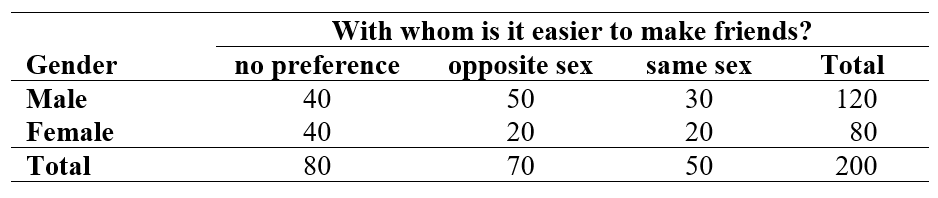
-What is the null hypothesis for this situation?
A) The variables "gender" and "with whom is it easier to make friends?" are dependent in the population.
B) There is a relationship between gender and whom it is easier to make friends with in the population.
C) The distribution of the answers to the question "with whom is it easier to make friends?" for male students differ from that of the female students.
D) There is no relationship between gender and whom it is easier to make friends with in the population.
سؤال
Use the following information for questions:
Students in a statistics class were asked, "With whom do you find it easier to make friends: person of the same sex, person of opposite sex, or no preference?" A table summarizing the responses by gender is given below. Minitab results for a chi-square test for these data were "Chi-Sq = 7.15 p-value = 0.028.
-What percentage of female students think it is easier to make friends with a girl?
A) 15%
B) 25%
C) 30%
D) 60%
سؤال
Use the following information for questions:
Students in a statistics class were asked, "With whom do you find it easier to make friends: person of the same sex, person of opposite sex, or no preference?" A table summarizing the responses by gender is given below. Minitab results for a chi-square test for these data were "Chi-Sq = 7.15 p-value = 0.028.
-What is the expected number of female students who think it is easier to make friends with a girl, if the null hypothesis were true?
A) 20
B) 25
C) 30
D) 32
سؤال
Use the following information for questions:
Students in a statistics class were asked, "With whom do you find it easier to make friends: person of the same sex, person of opposite sex, or no preference?" A table summarizing the responses by gender is given below. Minitab results for a chi-square test for these data were "Chi-Sq = 7.15 p-value = 0.028.
-What are the degrees of freedom for this situation?
A) 2
B) 3
C) 4
D) 5
سؤال
Use the following information for questions:
In the General Social Survey, respondents were asked if they agreed with the following statement: "In spite of what some people say, the lot (situation/condition) of the average man is getting worse, not better." Minitab output, summarizing the results for 989 respondents by race, is shown below: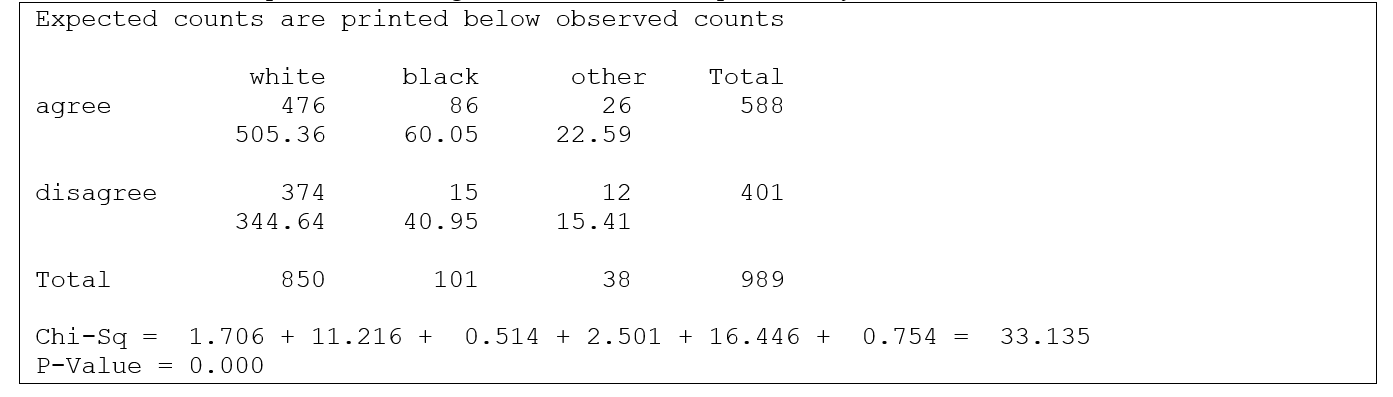
-State the null hypothesis and alternative hypotheses.
سؤال
Use the following information for questions:
In the General Social Survey, respondents were asked if they agreed with the following statement: "In spite of what some people say, the lot (situation/condition) of the average man is getting worse, not better." Minitab output, summarizing the results for 989 respondents by race, is shown below:
-What is the percentage of white respondents who agree that the human lot is getting worse?
سؤال
Use the following information for questions:
In the General Social Survey, respondents were asked if they agreed with the following statement: "In spite of what some people say, the lot (situation/condition) of the average man is getting worse, not better." Minitab output, summarizing the results for 989 respondents by race, is shown below:
-What is the percentage of black respondents who agree that the human lot is getting worse?
سؤال
Use the following information for questions:
In the General Social Survey, respondents were asked if they agreed with the following statement: "In spite of what some people say, the lot (situation/condition) of the average man is getting worse, not better." Minitab output, summarizing the results for 989 respondents by race, is shown below:
-What are the degrees of freedom?
سؤال
Use the following information for questions:
In the General Social Survey, respondents were asked if they agreed with the following statement: "In spite of what some people say, the lot (situation/condition) of the average man is getting worse, not better." Minitab output, summarizing the results for 989 respondents by race, is shown below:
-What is the p-value or p-value range?
سؤال
Use the following information for questions:
In the General Social Survey, respondents were asked if they agreed with the following statement: "In spite of what some people say, the lot (situation/condition) of the average man is getting worse, not better." Minitab output, summarizing the results for 989 respondents by race, is shown below:
-At a significance level of 0.05, what is the conclusion?
سؤال
Use the following information for questions:
A randomly selected group 78 seniors is asked about their plans after graduation. Is there a relationship between the gender of the students and what they plan to do when they graduate from college? SPSS was used to analyze the data. Part of the output is shown below: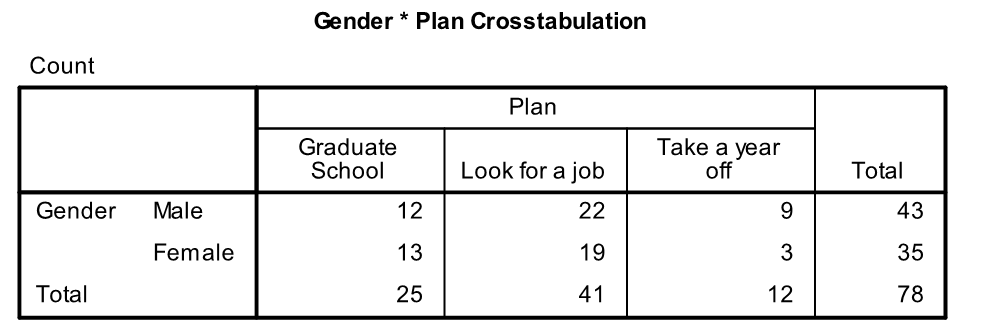
-State the null hypothesis and alternative hypotheses.
سؤال
Use the following information for questions:
A randomly selected group 78 seniors is asked about their plans after graduation. Is there a relationship between the gender of the students and what they plan to do when they graduate from college? SPSS was used to analyze the data. Part of the output is shown below:
-What percentage of male students plan to take a year off?
سؤال
Use the following information for questions:
A randomly selected group 78 seniors is asked about their plans after graduation. Is there a relationship between the gender of the students and what they plan to do when they graduate from college? SPSS was used to analyze the data. Part of the output is shown below:
-What percentage of female students are planning to go to graduate school?
سؤال
Use the following information for questions:
A randomly selected group 78 seniors is asked about their plans after graduation. Is there a relationship between the gender of the students and what they plan to do when they graduate from college? SPSS was used to analyze the data. Part of the output is shown below:
-What is the expected number of female students going to graduate school under the null hypothesis?
سؤال
Use the following information for questions:
A randomly selected group 78 seniors is asked about their plans after graduation. Is there a relationship between the gender of the students and what they plan to do when they graduate from college? SPSS was used to analyze the data. Part of the output is shown below:
-What are the degrees of freedom for this test?
سؤال
Use the following information for questions:
A randomly selected group 78 seniors is asked about their plans after graduation. Is there a relationship between the gender of the students and what they plan to do when they graduate from college? SPSS was used to analyze the data. Part of the output is shown below:
-Another part of the output is shown below:
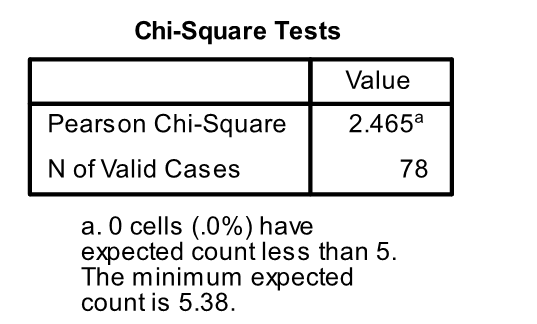
What is the p-value or p-value range?
A randomly selected group 78 seniors is asked about their plans after graduation. Is there a relationship between the gender of the students and what they plan to do when they graduate from college? SPSS was used to analyze the data. Part of the output is shown below:
-Another part of the output is shown below:
What is the p-value or p-value range?
سؤال
Use the following information for questions:
A randomly selected group 78 seniors is asked about their plans after graduation. Is there a relationship between the gender of the students and what they plan to do when they graduate from college? SPSS was used to analyze the data. Part of the output is shown below:
-At a significance level of 0.10, what is the conclusion?
سؤال
Use the following information for questions:
The table below shows the counts by gender and highest degree attained for 498 respondents in the General Social Survey.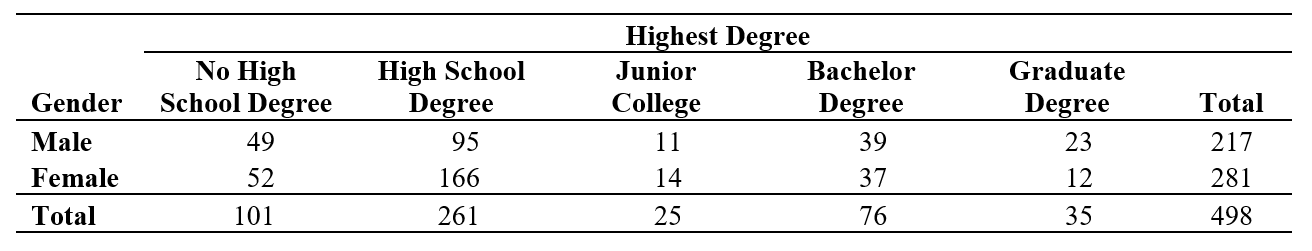
-State the null hypothesis and alternative hypotheses.
The table below shows the counts by gender and highest degree attained for 498 respondents in the General Social Survey.
-State the null hypothesis and alternative hypotheses.
سؤال
Use the following information for questions:
The table below shows the counts by gender and highest degree attained for 498 respondents in the General Social Survey.
-What percentage of male respondents has more than just a high school degree?
The table below shows the counts by gender and highest degree attained for 498 respondents in the General Social Survey.
-What percentage of male respondents has more than just a high school degree?
سؤال
Use the following information for questions:
The table below shows the counts by gender and highest degree attained for 498 respondents in the General Social Survey.
-What percentage of female respondents has a graduate degree?
The table below shows the counts by gender and highest degree attained for 498 respondents in the General Social Survey.
-What percentage of female respondents has a graduate degree?
سؤال
Use the following information for questions:
The table below shows the counts by gender and highest degree attained for 498 respondents in the General Social Survey.
-What is the expected number of female respondents with a graduate degree under the null hypothesis?
The table below shows the counts by gender and highest degree attained for 498 respondents in the General Social Survey.
-What is the expected number of female respondents with a graduate degree under the null hypothesis?
سؤال
Use the following information for questions:
The table below shows the counts by gender and highest degree attained for 498 respondents in the General Social Survey.
-What is the contribution to the chi-square statistic of the cell "female respondents with a graduate degree"?
The table below shows the counts by gender and highest degree attained for 498 respondents in the General Social Survey.
-What is the contribution to the chi-square statistic of the cell "female respondents with a graduate degree"?
سؤال
Use the following information for questions:
The table below shows the counts by gender and highest degree attained for 498 respondents in the General Social Survey.
-What are the degrees of freedom for this test?
The table below shows the counts by gender and highest degree attained for 498 respondents in the General Social Survey.
-What are the degrees of freedom for this test?
سؤال
Use the following information for questions:
The table below shows the counts by gender and highest degree attained for 498 respondents in the General Social Survey.
-Contributions to the chi-square test statistic of 4 cells are greater than 3. With this information, what do you already know about the p-value?
The table below shows the counts by gender and highest degree attained for 498 respondents in the General Social Survey.
-Contributions to the chi-square test statistic of 4 cells are greater than 3. With this information, what do you already know about the p-value?
سؤال
Use the following information for questions:
In the General Social Survey, respondents were asked "If your party nominated a woman for President, would you vote for her if she were qualified for the job?" A two-way table summarizing the results for 953 respondents, by gender, is shown below: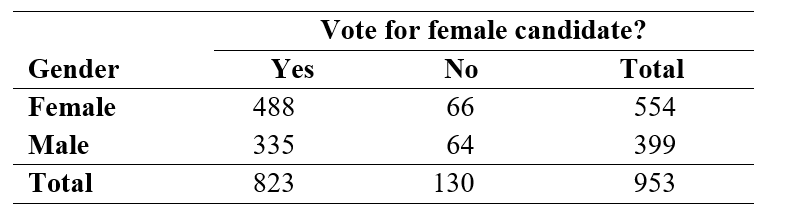
-If the null hypothesis of equal proportions of "Yes" votes for males and females were true, what is the expected number of females in the sample who would give a "Yes" response to having a female president?
A) 488.0
B) 478.4
C) 344.6
D) None of the above
سؤال
Use the following information for questions:
In the General Social Survey, respondents were asked "If your party nominated a woman for President, would you vote for her if she were qualified for the job?" A two-way table summarizing the results for 953 respondents, by gender, is shown below:
-If the null hypothesis were true, what is the expected number of females in the sample who would give a "No" response to having a female president?
A) 54.4
B) 66.0
C) 75.6
D) None of the above
سؤال
Use the following information for questions:
In the General Social Survey, respondents were asked "If your party nominated a woman for President, would you vote for her if she were qualified for the job?" A two-way table summarizing the results for 953 respondents, by gender, is shown below:
-The chi-square test statistic = 3.35. What is the p-value or p-value range?
A) 0.01 < p-value < 0.025
B) 0.015 < p-value < 0.05
C) 0.05 < p-value < 0.075
D) None of the above
سؤال
Use the following information for questions:
In the General Social Survey, respondents were asked "If your party nominated a woman for President, would you vote for her if she were qualified for the job?" A two-way table summarizing the results for 953 respondents, by gender, is shown below:
-At a significance level of 0.05, what is your conclusion?
A) The null hypothesis is rejected: the relationship between gender and support for a female president is statistically significant.
B) The null hypothesis is rejected: the relationship between gender and support for a female president is not statistically significant.
C) The null hypothesis is not rejected: the relationship between gender and support for a female president is statistically significant.
D) The null hypothesis is not rejected: the relationship between gender and support for a female president is not statistically significant.
سؤال
Use the following information for questions:
In the General Social Survey, respondents were asked "Do you favor or oppose the death penalty for persons convicted of murder?" A two-way table summarizing the results for 1447 respondents, by gender, is shown below: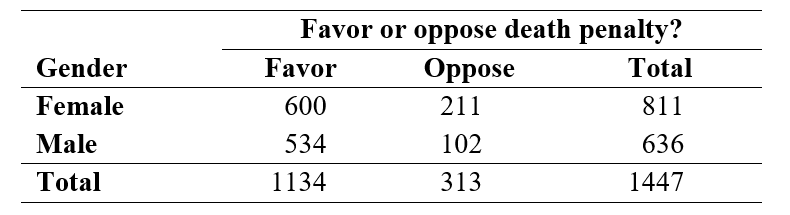
-If the null hypothesis of equal proportions of "Favor" responses for males and females were true, what is the expected number of females in the sample who would favor the death penalty?
A) 498.4
B) 600.0
C) 635.6
D) None of the above
سؤال
Use the following information for questions:
In the General Social Survey, respondents were asked "Do you favor or oppose the death penalty for persons convicted of murder?" A two-way table summarizing the results for 1447 respondents, by gender, is shown below:
-If the null hypothesis were true, what is the expected number of males in the sample who would favor the death penalty?
A) 137.6
B) 498.4
C) 534.0
D) None of the above
سؤال
Use the following information for questions:
In the General Social Survey, respondents were asked "Do you favor or oppose the death penalty for persons convicted of murder?" A two-way table summarizing the results for 1447 respondents, by gender, is shown below:
-The chi-square test statistic = 20.9. What is the p-value or p-value range?
A) p-value < 0.001
B) 0.001 < p-value < 0.005
C) 0.05 < p-value < 0.075
D) None of the above
سؤال
Use the following information for questions:
In the General Social Survey, respondents were asked "Do you favor or oppose the death penalty for persons convicted of murder?" A two-way table summarizing the results for 1447 respondents, by gender, is shown below:
-At a significance level of 0.05, what is your conclusion?
A) The null hypothesis is rejected: the relationship between gender and support for death penalty is statistically significant.
B) The null hypothesis is rejected: the relationship between gender and support for death penalty is not statistically significant.
C) The null hypothesis is not rejected: the relationship between gender and support for death penalty is statistically significant.
D) The null hypothesis is not rejected: the relationship between gender and support for death penalty is not statistically significant.
سؤال
Use the following information for questions:
In the General Social Survey, respondents were asked "Would you approve of an adult male punching a stranger if the stranger was drunk and bumped into the man and his wife on the street?" A two-way table summarizing the results for 1006 respondents, by gender, is shown below: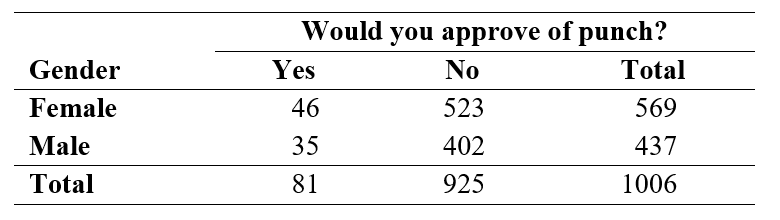
-If the null hypothesis of equal proportions of "Yes" votes for males and females were true, what is the expected number of females in the sample who think it would be all right to punch a drunken stranger?
A) 35.19
B) 45.81
C) 401.81
D) None of the above
سؤال
Use the following information for questions:
In the General Social Survey, respondents were asked "Would you approve of an adult male punching a stranger if the stranger was drunk and bumped into the man and his wife on the street?" A two-way table summarizing the results for 1006 respondents, by gender, is shown below:
-If the null hypothesis were true, what is the expected number of males in the sample who think it would be all right to punch a drunken stranger?
A) 35.19
B) 45.81
C) 401.81
D) None of the above
سؤال
Use the following information for questions:
In the General Social Survey, respondents were asked "Would you approve of an adult male punching a stranger if the stranger was drunk and bumped into the man and his wife on the street?" A two-way table summarizing the results for 1006 respondents, by gender, is shown below:
-The chi-square test statistic = 0.002. What is the p-value or p-value range?
A) p-value = 0.002
B) p-value < 0.001
C) p-value > 0.50
D) None of the above
سؤال
Use the following information for questions:
In the General Social Survey, respondents were asked "Would you approve of an adult male punching a stranger if the stranger was drunk and bumped into the man and his wife on the street?" A two-way table summarizing the results for 1006 respondents, by gender, is shown below:
-At a significance level of 0.05, what is your conclusion?
A) The null hypothesis is rejected: the relationship between gender and approval for punching is statistically significant.
B) The null hypothesis is rejected: the relationship between gender and approval for punching is not statistically significant.
C) The null hypothesis is not rejected: the relationship between gender and approval for punching is statistically significant.
D) The null hypothesis is not rejected: the relationship between gender and approval for punching is not statistically significant.
سؤال
Use the following information for questions:
In the General Social Survey, respondents were asked, "Do you agree with the following statement? "In spite of what some people say, the lot (situation/condition) of the average man is getting worse, not better." The results, for 989 respondents by gender, are shown below.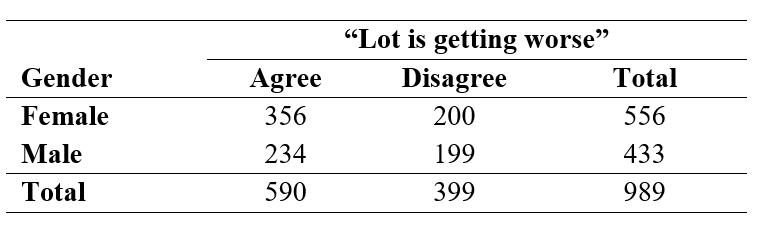
-What are the null and alternative hypotheses?
سؤال
Use the following information for questions:
In the General Social Survey, respondents were asked, "Do you agree with the following statement? "In spite of what some people say, the lot (situation/condition) of the average man is getting worse, not better." The results, for 989 respondents by gender, are shown below.
-If the null hypothesis were true, what is the expected number of women in the sample who agree that the lot of the average man is getting worse?
سؤال
Use the following information for questions:
In the General Social Survey, respondents were asked, "Do you agree with the following statement? "In spite of what some people say, the lot (situation/condition) of the average man is getting worse, not better." The results, for 989 respondents by gender, are shown below.
-If the null hypothesis were true, what is the expected number of men in the sample who agree that the lot of the average man is getting worse?

فتح الحزمة
قم بالتسجيل لفتح البطاقات في هذه المجموعة!
Unlock Deck
Unlock Deck
1/111
العب
ملء الشاشة (f)
Deck 15: More About Inference for Categorical Variables
1
A student survey was done to study the relationship between class standing (freshman, sophomore, junior, or senior) and major subject (English, Biology, French, Political Science, Undeclared, or Other). What are the degrees of freedom for the chi-square statistic?
A) 24
B) 20
C) 15
D) 5
A) 24
B) 20
C) 15
D) 5
15
2
A student survey was done to study the relationship between where students live (dormitory, apartment, house, co-op, or parent's home) and how they usually get to campus (walking, bus, bicycle, car, or subway). What are the degrees of freedom for the chi-square statistic?
A) 5
B) 16
C) 20
D) 25
A) 5
B) 16
C) 20
D) 25
16
3
A chi-square statistic was computed for a two-way table having 4 degrees of freedom. The value of the statistic was 9.49. What is the p-value?
A) 0.005
B) 0.001
C) 0.01
D) None of the above
A) 0.005
B) 0.001
C) 0.01
D) None of the above
None of the above
4
A chi-square statistic was computed for a two-way table having 20 degrees of freedom. The value of the statistic was 29.69. What is the p-value?
A) 0.025
B) 0.05
C) 0.075
D) None of the above
A) 0.025
B) 0.05
C) 0.075
D) None of the above
فتح الحزمة
افتح القفل للوصول البطاقات البالغ عددها 111 في هذه المجموعة.
فتح الحزمة
k this deck
5
A chi-square statistic was computed for a two-way table having 1 degree of freedom. The value of the statistic was 10.83. What is the p-value?
A) 0.001
B) 0.005
C) 0.01
D) None of the above
A) 0.001
B) 0.005
C) 0.01
D) None of the above
فتح الحزمة
افتح القفل للوصول البطاقات البالغ عددها 111 في هذه المجموعة.
فتح الحزمة
k this deck
6
A chi-square statistic was computed for a two-way table having 1 degree of freedom. The value of the statistic was 6.00. What is the p-value or p-value range?
A) p-value < 0.001
B) 0.01 < p-value < 0.025
C) 0.025 < p-value < 0.05
D) None of the above
A) p-value < 0.001
B) 0.01 < p-value < 0.025
C) 0.025 < p-value < 0.05
D) None of the above
فتح الحزمة
افتح القفل للوصول البطاقات البالغ عددها 111 في هذه المجموعة.
فتح الحزمة
k this deck
7
A chi-square statistic was computed for a two-way table having 20 degrees of freedom. The value of the statistic was 30.00. What is the p-value or p-value range?
A) p-value = 0.05
B) 0.05 < p-value < 0.075
C) 0.025 < p-value < 0.05
D) None of the above
A) p-value = 0.05
B) 0.05 < p-value < 0.075
C) 0.025 < p-value < 0.05
D) None of the above
فتح الحزمة
افتح القفل للوصول البطاقات البالغ عددها 111 في هذه المجموعة.
فتح الحزمة
k this deck
8
A student survey was done to study the relationship between class standing (freshman, sophomore, junior, or senior) and favorite type of take-out food (pizza, Chinese food, burgers, sandwich, or other). The chi-square test statistic was 25. What is the p-value or p-value range?
A) 0.01 < p-value < 0.025
B) 0.025 < p-value < 0.05
C) 0.05 < p-value < 0.075
D) None of the above
A) 0.01 < p-value < 0.025
B) 0.025 < p-value < 0.05
C) 0.05 < p-value < 0.075
D) None of the above
فتح الحزمة
افتح القفل للوصول البطاقات البالغ عددها 111 في هذه المجموعة.
فتح الحزمة
k this deck
9
A student survey was done to study the relationship between gender and favorite television program watched on Sunday mornings (sports, news, or other). The chi-square test statistic was 10. What is the p-value or p-value range?
A) 0.005 < p-value < 0.01
B) 0.01 < p-value < 0.025
C) 0.025 < p-value < 0.05
D) None of the above
A) 0.005 < p-value < 0.01
B) 0.01 < p-value < 0.025
C) 0.025 < p-value < 0.05
D) None of the above
فتح الحزمة
افتح القفل للوصول البطاقات البالغ عددها 111 في هذه المجموعة.
فتح الحزمة
k this deck
10
Suppose that the chi-square statistic equals 10.9 for a two-way table with 4 rows and 2 columns. In which range does the approximate p-value fall for this situation?
A) Less than 0.001
B) Between 0.01 and 0.025
C) Between 0.025 and 0.05
D) Between 0.10 and 0.25
A) Less than 0.001
B) Between 0.01 and 0.025
C) Between 0.025 and 0.05
D) Between 0.10 and 0.25
فتح الحزمة
افتح القفل للوصول البطاقات البالغ عددها 111 في هذه المجموعة.
فتح الحزمة
k this deck
11
Which one of the following is NOT true about the table of expected counts for a chi-square test?
A) The expected counts are computed assuming the null hypothesis is true.
B) The expected counts are computed assuming the alternative hypothesis is true.
C) The expected counts have the same row and column totals as the observed counts.
D) The pattern of row percents is identical for all rows of expected counts.
فتح الحزمة
افتح القفل للوصول البطاقات البالغ عددها 111 في هذه المجموعة.
فتح الحزمة
k this deck
12
A chi-square test involves a set of counts called "expected counts." What are the expected counts?
A) Hypothetical counts that would occur if the alternative hypothesis were true.
B) Hypothetical counts that would occur if the null hypothesis were true.
C) The actual counts that did occur in the observed data.
D) The long-run counts that would be expected if the observed counts are representative.
فتح الحزمة
افتح القفل للوصول البطاقات البالغ عددها 111 في هذه المجموعة.
فتح الحزمة
k this deck
13
Which of the following gives statistically significant results at the 0.05 level of significance?
A)= 7, df = 3
B) 11ef1ddf_26b0_ad5e_96e7_b538563cf6bb_TB10510_11= 20, df = 11
C) 11ef1ddf_26b0_ad5e_96e7_b538563cf6bb_TB10510_11 = 24, df = 15
D) 11ef1ddf_26b0_ad5e_96e7_b538563cf6bb_TB10510_11 = 10, df = 5
A)
= 7, df = 3B) 11ef1ddf_26b0_ad5e_96e7_b538563cf6bb_TB10510_11= 20, df = 11
C) 11ef1ddf_26b0_ad5e_96e7_b538563cf6bb_TB10510_11 = 24, df = 15
D) 11ef1ddf_26b0_ad5e_96e7_b538563cf6bb_TB10510_11 = 10, df = 5
فتح الحزمة
افتح القفل للوصول البطاقات البالغ عددها 111 في هذه المجموعة.
فتح الحزمة
k this deck
14
Which of the following gives statistically significant results at the 0.01 level of significance?
A)= 9.1, df = 2
B) 11ef1ddf_26b0_ad5e_96e7_b538563cf6bb_TB10510_11= 5.3, df = 1
C) 11ef1ddf_26b0_ad5e_96e7_b538563cf6bb_TB10510_11 = 13.8, df = 4
D)11ef1ddf_26b0_ad5e_96e7_b538563cf6bb_TB10510_11= 14.1, df = 5
A)
= 9.1, df = 2B) 11ef1ddf_26b0_ad5e_96e7_b538563cf6bb_TB10510_11= 5.3, df = 1
C) 11ef1ddf_26b0_ad5e_96e7_b538563cf6bb_TB10510_11 = 13.8, df = 4
D)11ef1ddf_26b0_ad5e_96e7_b538563cf6bb_TB10510_11= 14.1, df = 5
فتح الحزمة
افتح القفل للوصول البطاقات البالغ عددها 111 في هذه المجموعة.
فتح الحزمة
k this deck
15
Which of the following gives statistically significant results?
A)= 10.23, df = 5, = 0.05
B) 11ef1ddf_26b0_ad5e_96e7_b538563cf6bb_TB10510_11 = 10.23, df = 4, = 0.01
C) 11ef1ddf_26b0_ad5e_96e7_b538563cf6bb_TB10510_11 = 10.23, df = 7, = 0.10
D) 11ef1ddf_26b0_ad5e_96e7_b538563cf6bb_TB10510_11= 10.23, df = 3, = 0.025
A)
= 10.23, df = 5, = 0.05B) 11ef1ddf_26b0_ad5e_96e7_b538563cf6bb_TB10510_11 = 10.23, df = 4, = 0.01
C) 11ef1ddf_26b0_ad5e_96e7_b538563cf6bb_TB10510_11 = 10.23, df = 7, = 0.10
D) 11ef1ddf_26b0_ad5e_96e7_b538563cf6bb_TB10510_11= 10.23, df = 3, = 0.025
فتح الحزمة
افتح القفل للوصول البطاقات البالغ عددها 111 في هذه المجموعة.
فتح الحزمة
k this deck
16
Suppose that a two-way table displaying sample information about gender and opinion about the legalization of marijuana (yes or no) is examined using a chi-square test. The necessary conditions are met and the chi-square value is calculated to be 15. What conclusion can be made?
A) Gender and opinion have a statistically significant relationship
B) Gender and opinion do not have a statistically significant relationship
C) It is impossible to make a conclusion because we don't know the sample size.
D) It is impossible to make a conclusion because we don't know the degrees of freedom.
فتح الحزمة
افتح القفل للوصول البطاقات البالغ عددها 111 في هذه المجموعة.
فتح الحزمة
k this deck
17
Which of the following relationships could be analyzed using a chi-square test?
A) The relationship between height (inches) and weight (pounds).
B) The relationship between satisfaction with K-12 schools (satisfied or not) and political party affiliation.
C) The relationship between gender and amount willing to spend on a stereo system (in dollars).
D) The relationship between opinion on gun control and income earned last year (in thousands of dollars).
فتح الحزمة
افتح القفل للوصول البطاقات البالغ عددها 111 في هذه المجموعة.
فتح الحزمة
k this deck
18
For which of the following tests is the null hypothesis not of the form parameter = null value?
A) A test for the difference in two proportions.
B) A test for the mean of paired differences.
C) A test for the difference in means for independent samples.
D) A chi-square test of independence.
A) A test for the difference in two proportions.
B) A test for the mean of paired differences.
C) A test for the difference in means for independent samples.
D) A chi-square test of independence.
فتح الحزمة
افتح القفل للوصول البطاقات البالغ عددها 111 في هذه المجموعة.
فتح الحزمة
k this deck
19
Use the following information for questions:
In the General Social Survey, respondents were asked what they thought was most important to get ahead: hard work, lucky breaks, or both. Minitab output for 1026 respondents, by gender, is shown below:
-What is the null hypothesis for this situation?
A) There is a relationship between gender and opinion on what is important to get ahead in the sample.
B) There is no relationship between gender and opinion on what is important to get ahead in the sample.
C) There is a relationship between gender and opinion on what is important to get ahead in the population.
D) There is no relationship between gender and opinion on what is important to get ahead in the population.
فتح الحزمة
افتح القفل للوصول البطاقات البالغ عددها 111 في هذه المجموعة.
فتح الحزمة
k this deck
20
Use the following information for questions:
In the General Social Survey, respondents were asked what they thought was most important to get ahead: hard work, lucky breaks, or both. Minitab output for 1026 respondents, by gender, is shown below:
-What is the alternative hypothesis for this situation?
A) There is a relationship between gender and opinion on what is important to get ahead in the sample.
B) There is no relationship between gender and opinion on what is important to get ahead in the sample.
C) There is a relationship between gender and opinion on what is important to get ahead in the population.
D) There is no relationship between gender and opinion on what is important to get ahead in the population.
فتح الحزمة
افتح القفل للوصول البطاقات البالغ عددها 111 في هذه المجموعة.
فتح الحزمة
k this deck
21
Use the following information for questions:
In the General Social Survey, respondents were asked what they thought was most important to get ahead: hard work, lucky breaks, or both. Minitab output for 1026 respondents, by gender, is shown below:
-What is the value of the test statistic?
A) 443
B) 583
C) 5.476
D) None of the above
In the General Social Survey, respondents were asked what they thought was most important to get ahead: hard work, lucky breaks, or both. Minitab output for 1026 respondents, by gender, is shown below:
-What is the value of the test statistic?
A) 443
B) 583
C) 5.476
D) None of the above
فتح الحزمة
افتح القفل للوصول البطاقات البالغ عددها 111 في هذه المجموعة.
فتح الحزمة
k this deck
22
Use the following information for questions:
In the General Social Survey, respondents were asked what they thought was most important to get ahead: hard work, lucky breaks, or both. Minitab output for 1026 respondents, by gender, is shown below:
-What are the degrees of freedom for the test statistic?
A) 2
B) 3
C) 4
D) None of the above
In the General Social Survey, respondents were asked what they thought was most important to get ahead: hard work, lucky breaks, or both. Minitab output for 1026 respondents, by gender, is shown below:
-What are the degrees of freedom for the test statistic?
A) 2
B) 3
C) 4
D) None of the above
فتح الحزمة
افتح القفل للوصول البطاقات البالغ عددها 111 في هذه المجموعة.
فتح الحزمة
k this deck
23
Use the following information for questions:
In the General Social Survey, respondents were asked what they thought was most important to get ahead: hard work, lucky breaks, or both. Minitab output for 1026 respondents, by gender, is shown below:
-At a significance level of 0.05, what is the conclusion?
A) Reject the null hypothesis and conclude there is no relationship between the variables.
B) Reject the null hypothesis and conclude there is a relationship between the variables.
C) Do not reject the null hypothesis and conclude the evidence is not strong enough to show a relationship between the two variables.
D) Do not reject the null hypothesis and conclude there is a relationship between the variables.
فتح الحزمة
افتح القفل للوصول البطاقات البالغ عددها 111 في هذه المجموعة.
فتح الحزمة
k this deck
24
Use the following information for questions:
In the General Social Survey, respondents were asked "If your party nominated a woman for President, would you vote for her if she were qualified for the job?" Minitab output for 953 respondents, by race, is shown below:
-What is the null hypothesis for this situation?
A) There is a relationship between race and opinion on voting for a female president in the sample.
B) There is no relationship between race and opinion on voting for a female president in the sample.
C) There is a relationship between race and opinion on voting for a female president in the population.
D) There is no relationship between race and opinion on voting for a female president in the population.
فتح الحزمة
افتح القفل للوصول البطاقات البالغ عددها 111 في هذه المجموعة.
فتح الحزمة
k this deck
25
Use the following information for questions:
In the General Social Survey, respondents were asked "If your party nominated a woman for President, would you vote for her if she were qualified for the job?" Minitab output for 953 respondents, by race, is shown below:
-What is the alternative hypothesis for this situation?
A) There is a relationship between race and opinion on voting for a female president in the sample.
B) There is no relationship between race and opinion on voting for a female president in the sample.
C) There is a relationship between race and opinion on voting for a female president in the population.
D) There is no relationship between race and opinion on voting for a female president in the population.
فتح الحزمة
افتح القفل للوصول البطاقات البالغ عددها 111 في هذه المجموعة.
فتح الحزمة
k this deck
26
Use the following information for questions:
In the General Social Survey, respondents were asked "If your party nominated a woman for President, would you vote for her if she were qualified for the job?" Minitab output for 953 respondents, by race, is shown below:
-What is the value of the test statistic?
A) 953
B) 1.199
C) 0.549
D) None of the above
فتح الحزمة
افتح القفل للوصول البطاقات البالغ عددها 111 في هذه المجموعة.
فتح الحزمة
k this deck
27
Use the following information for questions:
In the General Social Survey, respondents were asked "If your party nominated a woman for President, would you vote for her if she were qualified for the job?" Minitab output for 953 respondents, by race, is shown below:
-What are the degrees of freedom for the test statistic?
A) 2
B) 3
C) 4
D) None of the above
فتح الحزمة
افتح القفل للوصول البطاقات البالغ عددها 111 في هذه المجموعة.
فتح الحزمة
k this deck
28
Use the following information for questions:
In the General Social Survey, respondents were asked "If your party nominated a woman for President, would you vote for her if she were qualified for the job?" Minitab output for 953 respondents, by race, is shown below:
-At a significance level of 0.05, what is the conclusion?
A) Reject the null hypothesis and conclude there is no relationship between the variables.
B) Reject the null hypothesis and conclude there is a relationship between the variables.
C) Do not reject the null hypothesis and conclude the evidence is not strong enough to show a relationship between the two variables.
D) Do not reject the null hypothesis and conclude there is a relationship between the variables.
فتح الحزمة
افتح القفل للوصول البطاقات البالغ عددها 111 في هذه المجموعة.
فتح الحزمة
k this deck
29
A sociologist uses a z-test to examine the difference between the proportions of men and women opposed to capital punishment. The value of the z-statistic is z = 4. Suppose the sociologist had instead used a chi-square test to analyze the data. What would be the value of the chi-square statistic?
A) 2
B) 4
C) 16
D) Not enough information is given to determine the value.
A) 2
B) 4
C) 16
D) Not enough information is given to determine the value.
فتح الحزمة
افتح القفل للوصول البطاقات البالغ عددها 111 في هذه المجموعة.
فتح الحزمة
k this deck
30
Use the following information for questions:
A researcher conducted a study on college students to see if there was a link between gender and how often they have cheated on an exam. She asked two questions on a survey:
(1) What is your gender? Male ___ Female ___
(2) How many times have you cheated on an exam while in college?
Never __ 1 or 2 times ___ 3 or more times ___
A two-way table of observed counts follows:
-Considering the researcher's objectives, what is the appropriate null hypothesis to test?
A) p = 0.50 where p = probability of answering "Never" to question (2) on the survey.
B) There is a difference between males and females with regard to the distribution of responses.
C) There is no relationship between the two variables.
D) There is a relationship between the two variables.
فتح الحزمة
افتح القفل للوصول البطاقات البالغ عددها 111 في هذه المجموعة.
فتح الحزمة
k this deck
31
Use the following information for questions:
A researcher conducted a study on college students to see if there was a link between gender and how often they have cheated on an exam. She asked two questions on a survey:
(1) What is your gender? Male ___ Female ___
(2) How many times have you cheated on an exam while in college?
Never __ 1 or 2 times ___ 3 or more times ___
A two-way table of observed counts follows:
-What are the degrees of freedom for the test statistic?
A) 6
B) 5
C) 3
D) 2
فتح الحزمة
افتح القفل للوصول البطاقات البالغ عددها 111 في هذه المجموعة.
فتح الحزمة
k this deck
32
Use the following information for questions:
A researcher conducted a study on college students to see if there was a link between gender and how often they have cheated on an exam. She asked two questions on a survey:
(1) What is your gender? Male ___ Female ___
(2) How many times have you cheated on an exam while in college?
Never __ 1 or 2 times ___ 3 or more times ___
A two-way table of observed counts follows:
-How many female students would you expect to have cheated once or twice if the null hypothesis were true?
A) 20
B) 25
C) 30
D) 50
فتح الحزمة
افتح القفل للوصول البطاقات البالغ عددها 111 في هذه المجموعة.
فتح الحزمة
k this deck
33
Use the following information for questions:
A researcher conducted a study on college students to see if there was a link between gender and how often they have cheated on an exam. She asked two questions on a survey:
(1) What is your gender? Male ___ Female ___
(2) How many times have you cheated on an exam while in college?
Never __ 1 or 2 times ___ 3 or more times ___
A two-way table of observed counts follows:
-The value of the-test statistic is 5.33. Are the results statistically significant at the 5% significance level?
A) Yes, because 5.33 is greater than the critical value of 3.84.
B) Yes, because 5.33 is greater than the critical value of 4.01.
C) No, because 5.33 is smaller than the critical value of 5.99.
D) No, because 5.33 is smaller than the critical value of 11.07.
A researcher conducted a study on college students to see if there was a link between gender and how often they have cheated on an exam. She asked two questions on a survey:
(1) What is your gender? Male ___ Female ___
(2) How many times have you cheated on an exam while in college?
Never __ 1 or 2 times ___ 3 or more times ___
A two-way table of observed counts follows:
-The value of the
-test statistic is 5.33. Are the results statistically significant at the 5% significance level?A) Yes, because 5.33 is greater than the critical value of 3.84.
B) Yes, because 5.33 is greater than the critical value of 4.01.
C) No, because 5.33 is smaller than the critical value of 5.99.
D) No, because 5.33 is smaller than the critical value of 11.07.
فتح الحزمة
افتح القفل للوصول البطاقات البالغ عددها 111 في هذه المجموعة.
فتح الحزمة
k this deck
34
Use the following information for questions:
Is there a relationship between the color of one's eyes and the comparative lengths of one's index and ring fingers? Students were asked "which finger is longer: your index finger or your ring finger? Or are they the same?" They also reported the color of their eyes (blue, brown, green, or hazel). The analysis of the results is given below.
-What is the appropriate statistical technique to analyze the data?
A) A chi-square test for association.
B) A chi-square goodness-of-fit test.
C) A two-sample t-test.
D) Analysis of variance.
فتح الحزمة
افتح القفل للوصول البطاقات البالغ عددها 111 في هذه المجموعة.
فتح الحزمة
k this deck
35
Use the following information for questions:
Is there a relationship between the color of one's eyes and the comparative lengths of one's index and ring fingers? Students were asked "which finger is longer: your index finger or your ring finger? Or are they the same?" They also reported the color of their eyes (blue, brown, green, or hazel). The analysis of the results is given below.
-From the analysis shown, what can we conclude at the 10%significance level?
A) There is a statistically significant relationship between eye color and the comparative length of the index and ring fingers.
B) There is no statistically significant relationship between eye color and the comparative length of the index and ring fingers.
C) There is insufficient information given because the degrees of freedom of the test statistic are not specified.
D) There is a statistically significant relationship between eye color and the comparative length of the index and ring fingers for some eye colors but not for others.
فتح الحزمة
افتح القفل للوصول البطاقات البالغ عددها 111 في هذه المجموعة.
فتح الحزمة
k this deck
36
Use the following information for questions:
Is there a relationship between the color of one's eyes and the comparative lengths of one's index and ring fingers? Students were asked "which finger is longer: your index finger or your ring finger? Or are they the same?" They also reported the color of their eyes (blue, brown, green, or hazel). The analysis of the results is given below.
-What are the degrees of freedom for this test?
A) 2
B) 3
C) 6
D) 12
فتح الحزمة
افتح القفل للوصول البطاقات البالغ عددها 111 في هذه المجموعة.
فتح الحزمة
k this deck
37
Use the following information for questions:
Is there a relationship between the color of one's eyes and the comparative lengths of one's index and ring fingers? Students were asked "which finger is longer: your index finger or your ring finger? Or are they the same?" They also reported the color of their eyes (blue, brown, green, or hazel). The analysis of the results is given below.
-What is the expected count for "blue eyes"and "same"?
A) 59/3
B) 29/4
C) 229/12
D) (59)(29)/229
فتح الحزمة
افتح القفل للوصول البطاقات البالغ عددها 111 في هذه المجموعة.
فتح الحزمة
k this deck
38
Use the following information for questions:
In the 1994 General Social Survey, a nationwide survey done every other year in the United States, the 1,185 respondents who had ever been married were asked the age at which they first wed and whether they had ever been divorced. The two-way table below summarizes the observed counts for the relationship between "age first wed" (categorized into four age groups) and "ever divorce" (no or yes). A chi-square value and p-value are given below the table.
-What is the appropriate null hypothesis for this table?
A) In the sample, there is a relationship between "age first wed' and "ever divorced".
B) In the population represented by the sample, there is a relationship between "age first wed' and "ever divorced".
C) In the sample, there is no relationship between "age first wed' and "ever divorced".
D) In the population represented by the sample, there is no relationship between "age first wed' and "ever divorced".
فتح الحزمة
افتح القفل للوصول البطاقات البالغ عددها 111 في هذه المجموعة.
فتح الحزمة
k this deck
39
Use the following information for questions:
In the 1994 General Social Survey, a nationwide survey done every other year in the United States, the 1,185 respondents who had ever been married were asked the age at which they first wed and whether they had ever been divorced. The two-way table below summarizes the observed counts for the relationship between "age first wed" (categorized into four age groups) and "ever divorce" (no or yes). A chi-square value and p-value are given below the table.
-The p-value is given as 0.000. This value was calculated as
A) the area to the right of 44.00 under a chi-square distribution with df = 3.
B) the area to the right of 44.00 under a chi-square distribution with df = 8.
C) the area to the left of 44.00 under a chi-square distribution with df = 3.
D) the area to the left of 44.00 under a chi-square distribution with df = 8.
فتح الحزمة
افتح القفل للوصول البطاقات البالغ عددها 111 في هذه المجموعة.
فتح الحزمة
k this deck
40
Use the following information for questions:
In the 1994 General Social Survey, a nationwide survey done every other year in the United States, the 1,185 respondents who had ever been married were asked the age at which they first wed and whether they had ever been divorced. The two-way table below summarizes the observed counts for the relationship between "age first wed" (categorized into four age groups) and "ever divorce" (no or yes). A chi-square value and p-value are given below the table.
-What is the expected count for the "Under 20" and "No" cell?
A) (323)(1/3)
B) 150
C) (323)(722)/1185
D) (1185)(1/8)
فتح الحزمة
افتح القفل للوصول البطاقات البالغ عددها 111 في هذه المجموعة.
فتح الحزمة
k this deck
41
Use the following information for questions:
In the 1994 General Social Survey, a nationwide survey done every other year in the United States, the 1,185 respondents who had ever been married were asked the age at which they first wed and whether they had ever been divorced. The two-way table below summarizes the observed counts for the relationship between "age first wed" (categorized into four age groups) and "ever divorce" (no or yes). A chi-square value and p-value are given below the table.
-Among those first wed under the age of 20, what proportion has ever been divorced?
A) 173/1185
B) 173/463
C) 173/150
D) 173/323
فتح الحزمة
افتح القفل للوصول البطاقات البالغ عددها 111 في هذه المجموعة.
فتح الحزمة
k this deck
42
Use the following information for questions:
Students in a statistics class were asked, "With whom do you find it easier to make friends: person of the same sex, person of opposite sex, or no preference?" A table summarizing the responses by gender is given below. Minitab results for a chi-square test for these data were "Chi-Sq = 7.15 p-value = 0.028.
-What is the null hypothesis for this situation?
A) The variables "gender" and "with whom is it easier to make friends?" are dependent in the population.
B) There is a relationship between gender and whom it is easier to make friends with in the population.
C) The distribution of the answers to the question "with whom is it easier to make friends?" for male students differ from that of the female students.
D) There is no relationship between gender and whom it is easier to make friends with in the population.
فتح الحزمة
افتح القفل للوصول البطاقات البالغ عددها 111 في هذه المجموعة.
فتح الحزمة
k this deck
43
Use the following information for questions:
Students in a statistics class were asked, "With whom do you find it easier to make friends: person of the same sex, person of opposite sex, or no preference?" A table summarizing the responses by gender is given below. Minitab results for a chi-square test for these data were "Chi-Sq = 7.15 p-value = 0.028.
-What percentage of female students think it is easier to make friends with a girl?
A) 15%
B) 25%
C) 30%
D) 60%
فتح الحزمة
افتح القفل للوصول البطاقات البالغ عددها 111 في هذه المجموعة.
فتح الحزمة
k this deck
44
Use the following information for questions:
Students in a statistics class were asked, "With whom do you find it easier to make friends: person of the same sex, person of opposite sex, or no preference?" A table summarizing the responses by gender is given below. Minitab results for a chi-square test for these data were "Chi-Sq = 7.15 p-value = 0.028.
-What is the expected number of female students who think it is easier to make friends with a girl, if the null hypothesis were true?
A) 20
B) 25
C) 30
D) 32
فتح الحزمة
افتح القفل للوصول البطاقات البالغ عددها 111 في هذه المجموعة.
فتح الحزمة
k this deck
45
Use the following information for questions:
Students in a statistics class were asked, "With whom do you find it easier to make friends: person of the same sex, person of opposite sex, or no preference?" A table summarizing the responses by gender is given below. Minitab results for a chi-square test for these data were "Chi-Sq = 7.15 p-value = 0.028.
-What are the degrees of freedom for this situation?
A) 2
B) 3
C) 4
D) 5
فتح الحزمة
افتح القفل للوصول البطاقات البالغ عددها 111 في هذه المجموعة.
فتح الحزمة
k this deck
46
Use the following information for questions:
In the General Social Survey, respondents were asked if they agreed with the following statement: "In spite of what some people say, the lot (situation/condition) of the average man is getting worse, not better." Minitab output, summarizing the results for 989 respondents by race, is shown below:
-State the null hypothesis and alternative hypotheses.
فتح الحزمة
افتح القفل للوصول البطاقات البالغ عددها 111 في هذه المجموعة.
فتح الحزمة
k this deck
47
Use the following information for questions:
In the General Social Survey, respondents were asked if they agreed with the following statement: "In spite of what some people say, the lot (situation/condition) of the average man is getting worse, not better." Minitab output, summarizing the results for 989 respondents by race, is shown below:
-What is the percentage of white respondents who agree that the human lot is getting worse?
فتح الحزمة
افتح القفل للوصول البطاقات البالغ عددها 111 في هذه المجموعة.
فتح الحزمة
k this deck
48
Use the following information for questions:
In the General Social Survey, respondents were asked if they agreed with the following statement: "In spite of what some people say, the lot (situation/condition) of the average man is getting worse, not better." Minitab output, summarizing the results for 989 respondents by race, is shown below:
-What is the percentage of black respondents who agree that the human lot is getting worse?
فتح الحزمة
افتح القفل للوصول البطاقات البالغ عددها 111 في هذه المجموعة.
فتح الحزمة
k this deck
49
Use the following information for questions:
In the General Social Survey, respondents were asked if they agreed with the following statement: "In spite of what some people say, the lot (situation/condition) of the average man is getting worse, not better." Minitab output, summarizing the results for 989 respondents by race, is shown below:
-What are the degrees of freedom?
فتح الحزمة
افتح القفل للوصول البطاقات البالغ عددها 111 في هذه المجموعة.
فتح الحزمة
k this deck
50
Use the following information for questions:
In the General Social Survey, respondents were asked if they agreed with the following statement: "In spite of what some people say, the lot (situation/condition) of the average man is getting worse, not better." Minitab output, summarizing the results for 989 respondents by race, is shown below:
-What is the p-value or p-value range?
فتح الحزمة
افتح القفل للوصول البطاقات البالغ عددها 111 في هذه المجموعة.
فتح الحزمة
k this deck
51
Use the following information for questions:
In the General Social Survey, respondents were asked if they agreed with the following statement: "In spite of what some people say, the lot (situation/condition) of the average man is getting worse, not better." Minitab output, summarizing the results for 989 respondents by race, is shown below:
-At a significance level of 0.05, what is the conclusion?
فتح الحزمة
افتح القفل للوصول البطاقات البالغ عددها 111 في هذه المجموعة.
فتح الحزمة
k this deck
52
Use the following information for questions:
A randomly selected group 78 seniors is asked about their plans after graduation. Is there a relationship between the gender of the students and what they plan to do when they graduate from college? SPSS was used to analyze the data. Part of the output is shown below:
-State the null hypothesis and alternative hypotheses.
فتح الحزمة
افتح القفل للوصول البطاقات البالغ عددها 111 في هذه المجموعة.
فتح الحزمة
k this deck
53
Use the following information for questions:
A randomly selected group 78 seniors is asked about their plans after graduation. Is there a relationship between the gender of the students and what they plan to do when they graduate from college? SPSS was used to analyze the data. Part of the output is shown below:
-What percentage of male students plan to take a year off?
فتح الحزمة
افتح القفل للوصول البطاقات البالغ عددها 111 في هذه المجموعة.
فتح الحزمة
k this deck
54
Use the following information for questions:
A randomly selected group 78 seniors is asked about their plans after graduation. Is there a relationship between the gender of the students and what they plan to do when they graduate from college? SPSS was used to analyze the data. Part of the output is shown below:
-What percentage of female students are planning to go to graduate school?
فتح الحزمة
افتح القفل للوصول البطاقات البالغ عددها 111 في هذه المجموعة.
فتح الحزمة
k this deck
55
Use the following information for questions:
A randomly selected group 78 seniors is asked about their plans after graduation. Is there a relationship between the gender of the students and what they plan to do when they graduate from college? SPSS was used to analyze the data. Part of the output is shown below:
-What is the expected number of female students going to graduate school under the null hypothesis?
فتح الحزمة
افتح القفل للوصول البطاقات البالغ عددها 111 في هذه المجموعة.
فتح الحزمة
k this deck
56
Use the following information for questions:
A randomly selected group 78 seniors is asked about their plans after graduation. Is there a relationship between the gender of the students and what they plan to do when they graduate from college? SPSS was used to analyze the data. Part of the output is shown below:
-What are the degrees of freedom for this test?
فتح الحزمة
افتح القفل للوصول البطاقات البالغ عددها 111 في هذه المجموعة.
فتح الحزمة
k this deck
57
Use the following information for questions:
A randomly selected group 78 seniors is asked about their plans after graduation. Is there a relationship between the gender of the students and what they plan to do when they graduate from college? SPSS was used to analyze the data. Part of the output is shown below:
-Another part of the output is shown below:
What is the p-value or p-value range?
فتح الحزمة
افتح القفل للوصول البطاقات البالغ عددها 111 في هذه المجموعة.
فتح الحزمة
k this deck
58
Use the following information for questions:
A randomly selected group 78 seniors is asked about their plans after graduation. Is there a relationship between the gender of the students and what they plan to do when they graduate from college? SPSS was used to analyze the data. Part of the output is shown below:
-At a significance level of 0.10, what is the conclusion?
فتح الحزمة
افتح القفل للوصول البطاقات البالغ عددها 111 في هذه المجموعة.
فتح الحزمة
k this deck
59
Use the following information for questions:
The table below shows the counts by gender and highest degree attained for 498 respondents in the General Social Survey.
-State the null hypothesis and alternative hypotheses.
The table below shows the counts by gender and highest degree attained for 498 respondents in the General Social Survey.
-State the null hypothesis and alternative hypotheses.
فتح الحزمة
افتح القفل للوصول البطاقات البالغ عددها 111 في هذه المجموعة.
فتح الحزمة
k this deck
60
Use the following information for questions:
The table below shows the counts by gender and highest degree attained for 498 respondents in the General Social Survey.
-What percentage of male respondents has more than just a high school degree?
The table below shows the counts by gender and highest degree attained for 498 respondents in the General Social Survey.
-What percentage of male respondents has more than just a high school degree?
فتح الحزمة
افتح القفل للوصول البطاقات البالغ عددها 111 في هذه المجموعة.
فتح الحزمة
k this deck
61
Use the following information for questions:
The table below shows the counts by gender and highest degree attained for 498 respondents in the General Social Survey.
-What percentage of female respondents has a graduate degree?
The table below shows the counts by gender and highest degree attained for 498 respondents in the General Social Survey.
-What percentage of female respondents has a graduate degree?
فتح الحزمة
افتح القفل للوصول البطاقات البالغ عددها 111 في هذه المجموعة.
فتح الحزمة
k this deck
62
Use the following information for questions:
The table below shows the counts by gender and highest degree attained for 498 respondents in the General Social Survey.
-What is the expected number of female respondents with a graduate degree under the null hypothesis?
The table below shows the counts by gender and highest degree attained for 498 respondents in the General Social Survey.
-What is the expected number of female respondents with a graduate degree under the null hypothesis?
فتح الحزمة
افتح القفل للوصول البطاقات البالغ عددها 111 في هذه المجموعة.
فتح الحزمة
k this deck
63
Use the following information for questions:
The table below shows the counts by gender and highest degree attained for 498 respondents in the General Social Survey.
-What is the contribution to the chi-square statistic of the cell "female respondents with a graduate degree"?
The table below shows the counts by gender and highest degree attained for 498 respondents in the General Social Survey.
-What is the contribution to the chi-square statistic of the cell "female respondents with a graduate degree"?
فتح الحزمة
افتح القفل للوصول البطاقات البالغ عددها 111 في هذه المجموعة.
فتح الحزمة
k this deck
64
Use the following information for questions:
The table below shows the counts by gender and highest degree attained for 498 respondents in the General Social Survey.
-What are the degrees of freedom for this test?
The table below shows the counts by gender and highest degree attained for 498 respondents in the General Social Survey.
-What are the degrees of freedom for this test?
فتح الحزمة
افتح القفل للوصول البطاقات البالغ عددها 111 في هذه المجموعة.
فتح الحزمة
k this deck
65
Use the following information for questions:
The table below shows the counts by gender and highest degree attained for 498 respondents in the General Social Survey.
-Contributions to the chi-square test statistic of 4 cells are greater than 3. With this information, what do you already know about the p-value?
The table below shows the counts by gender and highest degree attained for 498 respondents in the General Social Survey.
-Contributions to the chi-square test statistic of 4 cells are greater than 3. With this information, what do you already know about the p-value?
فتح الحزمة
افتح القفل للوصول البطاقات البالغ عددها 111 في هذه المجموعة.
فتح الحزمة
k this deck
66
Use the following information for questions:
In the General Social Survey, respondents were asked "If your party nominated a woman for President, would you vote for her if she were qualified for the job?" A two-way table summarizing the results for 953 respondents, by gender, is shown below:
-If the null hypothesis of equal proportions of "Yes" votes for males and females were true, what is the expected number of females in the sample who would give a "Yes" response to having a female president?
A) 488.0
B) 478.4
C) 344.6
D) None of the above
فتح الحزمة
افتح القفل للوصول البطاقات البالغ عددها 111 في هذه المجموعة.
فتح الحزمة
k this deck
67
Use the following information for questions:
In the General Social Survey, respondents were asked "If your party nominated a woman for President, would you vote for her if she were qualified for the job?" A two-way table summarizing the results for 953 respondents, by gender, is shown below:
-If the null hypothesis were true, what is the expected number of females in the sample who would give a "No" response to having a female president?
A) 54.4
B) 66.0
C) 75.6
D) None of the above
فتح الحزمة
افتح القفل للوصول البطاقات البالغ عددها 111 في هذه المجموعة.
فتح الحزمة
k this deck
68
Use the following information for questions:
In the General Social Survey, respondents were asked "If your party nominated a woman for President, would you vote for her if she were qualified for the job?" A two-way table summarizing the results for 953 respondents, by gender, is shown below:
-The chi-square test statistic = 3.35. What is the p-value or p-value range?
A) 0.01 < p-value < 0.025
B) 0.015 < p-value < 0.05
C) 0.05 < p-value < 0.075
D) None of the above
فتح الحزمة
افتح القفل للوصول البطاقات البالغ عددها 111 في هذه المجموعة.
فتح الحزمة
k this deck
69
Use the following information for questions:
In the General Social Survey, respondents were asked "If your party nominated a woman for President, would you vote for her if she were qualified for the job?" A two-way table summarizing the results for 953 respondents, by gender, is shown below:
-At a significance level of 0.05, what is your conclusion?
A) The null hypothesis is rejected: the relationship between gender and support for a female president is statistically significant.
B) The null hypothesis is rejected: the relationship between gender and support for a female president is not statistically significant.
C) The null hypothesis is not rejected: the relationship between gender and support for a female president is statistically significant.
D) The null hypothesis is not rejected: the relationship between gender and support for a female president is not statistically significant.
فتح الحزمة
افتح القفل للوصول البطاقات البالغ عددها 111 في هذه المجموعة.
فتح الحزمة
k this deck
70
Use the following information for questions:
In the General Social Survey, respondents were asked "Do you favor or oppose the death penalty for persons convicted of murder?" A two-way table summarizing the results for 1447 respondents, by gender, is shown below:
-If the null hypothesis of equal proportions of "Favor" responses for males and females were true, what is the expected number of females in the sample who would favor the death penalty?
A) 498.4
B) 600.0
C) 635.6
D) None of the above
فتح الحزمة
افتح القفل للوصول البطاقات البالغ عددها 111 في هذه المجموعة.
فتح الحزمة
k this deck
71
Use the following information for questions:
In the General Social Survey, respondents were asked "Do you favor or oppose the death penalty for persons convicted of murder?" A two-way table summarizing the results for 1447 respondents, by gender, is shown below:
-If the null hypothesis were true, what is the expected number of males in the sample who would favor the death penalty?
A) 137.6
B) 498.4
C) 534.0
D) None of the above
فتح الحزمة
افتح القفل للوصول البطاقات البالغ عددها 111 في هذه المجموعة.
فتح الحزمة
k this deck
72
Use the following information for questions:
In the General Social Survey, respondents were asked "Do you favor or oppose the death penalty for persons convicted of murder?" A two-way table summarizing the results for 1447 respondents, by gender, is shown below:
-The chi-square test statistic = 20.9. What is the p-value or p-value range?
A) p-value < 0.001
B) 0.001 < p-value < 0.005
C) 0.05 < p-value < 0.075
D) None of the above
فتح الحزمة
افتح القفل للوصول البطاقات البالغ عددها 111 في هذه المجموعة.
فتح الحزمة
k this deck
73
Use the following information for questions:
In the General Social Survey, respondents were asked "Do you favor or oppose the death penalty for persons convicted of murder?" A two-way table summarizing the results for 1447 respondents, by gender, is shown below:
-At a significance level of 0.05, what is your conclusion?
A) The null hypothesis is rejected: the relationship between gender and support for death penalty is statistically significant.
B) The null hypothesis is rejected: the relationship between gender and support for death penalty is not statistically significant.
C) The null hypothesis is not rejected: the relationship between gender and support for death penalty is statistically significant.
D) The null hypothesis is not rejected: the relationship between gender and support for death penalty is not statistically significant.
فتح الحزمة
افتح القفل للوصول البطاقات البالغ عددها 111 في هذه المجموعة.
فتح الحزمة
k this deck
74
Use the following information for questions:
In the General Social Survey, respondents were asked "Would you approve of an adult male punching a stranger if the stranger was drunk and bumped into the man and his wife on the street?" A two-way table summarizing the results for 1006 respondents, by gender, is shown below:
-If the null hypothesis of equal proportions of "Yes" votes for males and females were true, what is the expected number of females in the sample who think it would be all right to punch a drunken stranger?
A) 35.19
B) 45.81
C) 401.81
D) None of the above
فتح الحزمة
افتح القفل للوصول البطاقات البالغ عددها 111 في هذه المجموعة.
فتح الحزمة
k this deck
75
Use the following information for questions:
In the General Social Survey, respondents were asked "Would you approve of an adult male punching a stranger if the stranger was drunk and bumped into the man and his wife on the street?" A two-way table summarizing the results for 1006 respondents, by gender, is shown below:
-If the null hypothesis were true, what is the expected number of males in the sample who think it would be all right to punch a drunken stranger?
A) 35.19
B) 45.81
C) 401.81
D) None of the above
فتح الحزمة
افتح القفل للوصول البطاقات البالغ عددها 111 في هذه المجموعة.
فتح الحزمة
k this deck
76
Use the following information for questions:
In the General Social Survey, respondents were asked "Would you approve of an adult male punching a stranger if the stranger was drunk and bumped into the man and his wife on the street?" A two-way table summarizing the results for 1006 respondents, by gender, is shown below:
-The chi-square test statistic = 0.002. What is the p-value or p-value range?
A) p-value = 0.002
B) p-value < 0.001
C) p-value > 0.50
D) None of the above
فتح الحزمة
افتح القفل للوصول البطاقات البالغ عددها 111 في هذه المجموعة.
فتح الحزمة
k this deck
77
Use the following information for questions:
In the General Social Survey, respondents were asked "Would you approve of an adult male punching a stranger if the stranger was drunk and bumped into the man and his wife on the street?" A two-way table summarizing the results for 1006 respondents, by gender, is shown below:
-At a significance level of 0.05, what is your conclusion?
A) The null hypothesis is rejected: the relationship between gender and approval for punching is statistically significant.
B) The null hypothesis is rejected: the relationship between gender and approval for punching is not statistically significant.
C) The null hypothesis is not rejected: the relationship between gender and approval for punching is statistically significant.
D) The null hypothesis is not rejected: the relationship between gender and approval for punching is not statistically significant.
فتح الحزمة
افتح القفل للوصول البطاقات البالغ عددها 111 في هذه المجموعة.
فتح الحزمة
k this deck
78
Use the following information for questions:
In the General Social Survey, respondents were asked, "Do you agree with the following statement? "In spite of what some people say, the lot (situation/condition) of the average man is getting worse, not better." The results, for 989 respondents by gender, are shown below.
-What are the null and alternative hypotheses?
فتح الحزمة
افتح القفل للوصول البطاقات البالغ عددها 111 في هذه المجموعة.
فتح الحزمة
k this deck
79
Use the following information for questions:
In the General Social Survey, respondents were asked, "Do you agree with the following statement? "In spite of what some people say, the lot (situation/condition) of the average man is getting worse, not better." The results, for 989 respondents by gender, are shown below.
-If the null hypothesis were true, what is the expected number of women in the sample who agree that the lot of the average man is getting worse?
فتح الحزمة
افتح القفل للوصول البطاقات البالغ عددها 111 في هذه المجموعة.
فتح الحزمة
k this deck
80
Use the following information for questions:
In the General Social Survey, respondents were asked, "Do you agree with the following statement? "In spite of what some people say, the lot (situation/condition) of the average man is getting worse, not better." The results, for 989 respondents by gender, are shown below.
-If the null hypothesis were true, what is the expected number of men in the sample who agree that the lot of the average man is getting worse?
فتح الحزمة
افتح القفل للوصول البطاقات البالغ عددها 111 في هذه المجموعة.
فتح الحزمة
k this deck
فتح الحزمة
افتح القفل للوصول البطاقات البالغ عددها 111 في هذه المجموعة.


