Deck 4: Basic Estimation Techniques
ملء الشاشة (f)
سؤال
سؤال
سؤال
In the linear model
, a test of the hypothesis that parameter c equals zero is
A) an F-test.
B) an R2-test.
C) a zero-statistic.
D) a t-test.
E) a Z-test.
, a test of the hypothesis that parameter c equals zero is
A) an F-test.
B) an R2-test.
C) a zero-statistic.
D) a t-test.
E) a Z-test.
سؤال
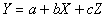
refer to the following:
The linear regression equation, Y = a + bX, was estimated. The following computer printout was
obtained:
?
-What is the critical value of t at the 1% level of significance?
A) 1.746
B) 2.120
C) 2.878
D) 2.921
The linear regression equation, Y = a + bX, was estimated. The following computer printout was
obtained:
?
-What is the critical value of t at the 1% level of significance?
A) 1.746
B) 2.120
C) 2.878
D) 2.921
سؤال
refer to the following:
The linear regression equation, Y = a + bX, was estimated. The following computer printout was
obtained:
?
-Which of the following statements is correct at the 1% level of significance?
A) Both

And

Are statistically significant.
B) Neither

Nor

Is statistically significant.
C)

Is statistically significant, but

Is not.
D)

Is statistically significant, but

Is not.
The linear regression equation, Y = a + bX, was estimated. The following computer printout was
obtained:
?
-Which of the following statements is correct at the 1% level of significance?
A) Both
And
Are statistically significant.
B) Neither
Nor
Is statistically significant.
C)
Is statistically significant, but
Is not.
D)
Is statistically significant, but
Is not.
سؤال
refer to the following:
The linear regression equation, Y = a + bX, was estimated. The following computer printout was
obtained:
?
-The exact level of significance of

Is
A) 0.171 percent.
B) 1 percent.
C) 1.71 percent.
D) 2.66 percent.
E) 2.921 percent.
The linear regression equation, Y = a + bX, was estimated. The following computer printout was
obtained:
?
-The exact level of significance of
Is
A) 0.171 percent.
B) 1 percent.
C) 1.71 percent.
D) 2.66 percent.
E) 2.921 percent.
سؤال
refer to the following:
The linear regression equation, Y = a + bX, was estimated. The following computer printout was
obtained:
?
-If X equals 20, what is the predicted value of Y?
A) 186.42
B) 165.69
C) -186.42
D)-411.72
The linear regression equation, Y = a + bX, was estimated. The following computer printout was
obtained:
?
-If X equals 20, what is the predicted value of Y?
A) 186.42
B) 165.69
C) -186.42
D)-411.72
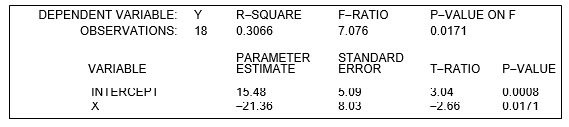
سؤال
refer to the following:
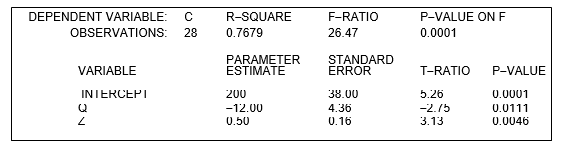
A firm is experiencing theft problems at its warehouse. A consultant to the firm believes that the dollar loss from theft each week (T) depends on the number of security guards (G) and on the unemployment rate in the county where the warehouse is located (U measured as a percent). In order to test this hypothesis, the consultant estimated the regression equation T = a + bG + cU and obtained the following results:
-Which of the following is correct at the 1% level of significance?
A) The regression equation as a whole is statistically significant because the p-value of F is smaller than 0.01.
B) The estimates of the parameters a, b, and c are all statistically significant because the absolute values of their t-ratios exceed 2.797.
C) The estimates of the parameters a, b, and c are all statistically significant because the p- values for,

,

And

Are all less than 0.01.
D) The critical value of t is 2.797.
E) all of the above
A firm is experiencing theft problems at its warehouse. A consultant to the firm believes that the dollar loss from theft each week (T) depends on the number of security guards (G) and on the unemployment rate in the county where the warehouse is located (U measured as a percent). In order to test this hypothesis, the consultant estimated the regression equation T = a + bG + cU and obtained the following results:
-Which of the following is correct at the 1% level of significance?
A) The regression equation as a whole is statistically significant because the p-value of F is smaller than 0.01.
B) The estimates of the parameters a, b, and c are all statistically significant because the absolute values of their t-ratios exceed 2.797.
C) The estimates of the parameters a, b, and c are all statistically significant because the p- values for,
,
And
Are all less than 0.01.
D) The critical value of t is 2.797.
E) all of the above
سؤال
In the nonlinear function

, the parameter c measures
A) Y / Z.
B) the percent change in Y for a 1 percent change in Z.
C) the elasticity of Y with respect to Z.
D) both a and c
E) both b and c
, the parameter c measures
A) Y / Z.
B) the percent change in Y for a 1 percent change in Z.
C) the elasticity of Y with respect to Z.
D) both a and c
E) both b and c
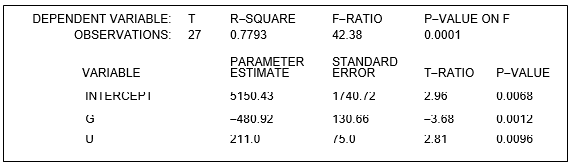
سؤال
refer to the following computer output from estimating the parameters of the nonlinear model
 The computer output from the regression analysis is:
-The nonlinear relation can be transformed into the following linear regression model:
A)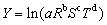
B)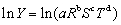
C)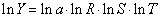
D)
The computer output from the regression analysis is:-The nonlinear relation can be transformed into the following linear regression model:
A)
B)
C)
D)
سؤال
refer to the following computer output from estimating the parameters of the nonlinear model
The computer output from the regression analysis is:
-The estimated value of a is
A) -0.6931
B) 0.50
C) -3.67
D) 2.66
The computer output from the regression analysis is:-The estimated value of a is
A) -0.6931
B) 0.50
C) -3.67
D) 2.66
سؤال
refer to the following computer output from estimating the parameters of the nonlinear model
The computer output from the regression analysis is:
-Which of the parameter estimates are statistically significant at the 90% level of confidence?
A) All the parameter estimates are statistically significant.
B) All parameter estimates except

And

Are statistically significant.
C)

Is not statistically significant, but all the rest of the parameter estimates are significant.
D)

Is not statistically significant, but all the rest of the parameter estimates are significant.
The computer output from the regression analysis is:-Which of the parameter estimates are statistically significant at the 90% level of confidence?
A) All the parameter estimates are statistically significant.
B) All parameter estimates except
And
Are statistically significant.
C)
Is not statistically significant, but all the rest of the parameter estimates are significant.
D)
Is not statistically significant, but all the rest of the parameter estimates are significant.
سؤال
refer to the following nonlinear model which relates W to P, Q, and R:

The computer output form the regression analysis is:
-The nonlinear relation can be transformed into the following linear regression model:
A)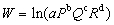
B)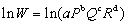
C)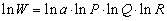
D)
The computer output form the regression analysis is:
-The nonlinear relation can be transformed into the following linear regression model:
A)
B)
C)
D)
سؤال
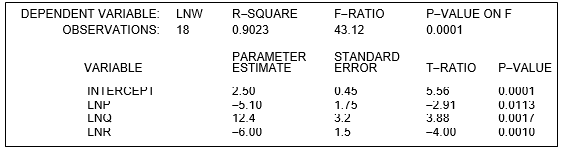
refer to the following nonlinear model which relates W to P, Q, and R:
The computer output form the regression analysis is:
-Which of the parameter estimates are statistically significant at the 5% level of significance?
A) All the parameter estimates are statistically significant.
B) All parameter estimates except and
and  are statistically significant.
C)

Is not statistically significant, but all the rest of the parameter estimates are significant.
D)

Is not statistically significant, but all the rest of the parameter estimates are significant.
The computer output form the regression analysis is:
-Which of the parameter estimates are statistically significant at the 5% level of significance?
A) All the parameter estimates are statistically significant.
B) All parameter estimates except
and are statistically significant.C)
Is not statistically significant, but all the rest of the parameter estimates are significant.
D)
Is not statistically significant, but all the rest of the parameter estimates are significant.
سؤال
refer to the following nonlinear model which relates W to P, Q, and R:
The computer output form the regression analysis is:
-The estimated value of a is
A) 0.916
B) 12.182
C) 2.50
D) 2.66
The computer output form the regression analysis is:
-The estimated value of a is
A) 0.916
B) 12.182
C) 2.50
D) 2.66
سؤال
سؤال
refer to the following:
A manager wishes to estimate an average cost equation of the following form:
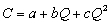
where Q is the level of output. Letting Z = Q2 and using least-squares estimation, the manager obtains the following computer output:
-Which of the parameter estimates are statistically significant at the 1% significance level?
A) All the parameter estimates are statistically significant.
B) All parameter estimates except are statistically significant.
C) is not statistically significant, but all the rest of the parameter estimates are significant.
D) is not statistically significant, but all the rest of the parameter estimates are significant.
A manager wishes to estimate an average cost equation of the following form:
where Q is the level of output. Letting Z = Q2 and using least-squares estimation, the manager obtains the following computer output:
-Which of the parameter estimates are statistically significant at the 1% significance level?
A) All the parameter estimates are statistically significant.
B) All parameter estimates except
are statistically significant.C)
is not statistically significant, but all the rest of the parameter estimates are significant.D)
is not statistically significant, but all the rest of the parameter estimates are significant. سؤال
refer to the following:
A manager wishes to estimate an average cost equation of the following form:
where Q is the level of output. Letting Z = Q2 and using least-squares estimation, the manager obtains the following computer output:
-When output is 40 units, what is average cost?
A) $200
B) $280
C) $360
D) $480
E) $520
A manager wishes to estimate an average cost equation of the following form:
where Q is the level of output. Letting Z = Q2 and using least-squares estimation, the manager obtains the following computer output:
-When output is 40 units, what is average cost?
A) $200
B) $280
C) $360
D) $480
E) $520
سؤال
refer to the following:
A manager wishes to estimate an average cost equation of the following form:
where Q is the level of output. Letting Z = Q2 and using least-squares estimation, the manager obtains the following computer output:
-When output is 20 units, what is average cost?
A) $160
B) $200
C) $280
D) $340
E) $360
A manager wishes to estimate an average cost equation of the following form:
where Q is the level of output. Letting Z = Q2 and using least-squares estimation, the manager obtains the following computer output:
-When output is 20 units, what is average cost?
A) $160
B) $200
C) $280
D) $340
E) $360
سؤال
سؤال
سؤال
سؤال
سؤال
The linear regression equation G = a + bD is estimated using 24 observations on R and W. The least-squares estimate of b is -22.5, and the standard error of the estimate is 8.36. Perform a t-test for statistical significance of
 at the 1% level of significance.
-There are _____ degrees of freedom for the t-test.
at the 1% level of significance.-There are _____ degrees of freedom for the t-test.
سؤال
The linear regression equation G = a + bD is estimated using 24 observations on R and W. The least-squares estimate of b is -22.5, and the standard error of the estimate is 8.36. Perform a t-test for statistical significance of
at the 1% level of significance.
-The value of the t-statistic is _________. The critical t-value for the test is _________.
at the 1% level of significance.-The value of the t-statistic is _________. The critical t-value for the test is _________.
سؤال
The linear regression equation G = a + bD is estimated using 24 observations on R and W. The least-squares estimate of b is -22.5, and the standard error of the estimate is 8.36. Perform a t-test for statistical significance of
at the 1% level of significance.
-The parameter estimate _________ (is, is not) statistically significant at the 1% level.
at the 1% level of significance.-The parameter estimate _________ (is, is not) statistically significant at the 1% level.
سؤال
Thirty-two data points on Y and X are employed to estimate the parameters in the linear relation Y = a + bX. The computer output from the regression analysis is
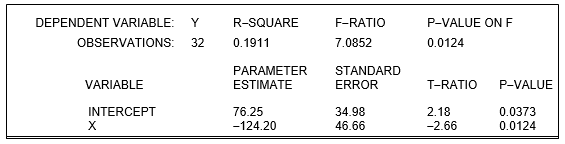
-The equation of the sample regression line is: = __________________________.
-The equation of the sample regression line is: = __________________________.
سؤال
Thirty-two data points on Y and X are employed to estimate the parameters in the linear relation Y = a + bX. The computer output from the regression analysis is
-There are ______ degrees of freedom for the t-test. At the 5% level of significance, the critical t-value for the test is ______________.
-There are ______ degrees of freedom for the t-test. At the 5% level of significance, the critical t-value for the test is ______________.
سؤال
Thirty-two data points on Y and X are employed to estimate the parameters in the linear relation Y = a + bX. The computer output from the regression analysis is
-At the 5% level of significance, __________ (is, not) significant, and ________ (is, is not) significant.
-At the 5% level of significance, __________ (is, not) significant, and ________ (is, is not) significant.
سؤال
Thirty-two data points on Y and X are employed to estimate the parameters in the linear relation Y = a + bX. The computer output from the regression analysis is
-At the 2% level of significance, the critical t-value for a t-test is ___________. At the 2% level of significance, _________ (is, is not) significant, and _________ (is, is not) significant.
-At the 2% level of significance, the critical t-value for a t-test is ___________. At the 2% level of significance, _________ (is, is not) significant, and _________ (is, is not) significant.
سؤال
Thirty-two data points on Y and X are employed to estimate the parameters in the linear relation Y = a + bX. The computer output from the regression analysis is
-The p-value for indicates that the exact level of significance is ______ percent, which is the probability of _________________________________________.
-The p-value for indicates that the exact level of significance is ______ percent, which is the probability of _________________________________________.
سؤال
Thirty-two data points on Y and X are employed to estimate the parameters in the linear relation Y = a + bX. The computer output from the regression analysis is
-At the 5% level of significance, the critical value of the F-statistic is _______. The model as a whole ___________(is, is not) significant at the 5% level.
-At the 5% level of significance, the critical value of the F-statistic is _______. The model as a whole ___________(is, is not) significant at the 5% level.
سؤال
Thirty-two data points on Y and X are employed to estimate the parameters in the linear relation Y = a + bX. The computer output from the regression analysis is
-If X equals 240, the fitted (or predicted) value of Y is ____________________________.
-If X equals 240, the fitted (or predicted) value of Y is ____________________________.
سؤال
Thirty-two data points on Y and X are employed to estimate the parameters in the linear relation Y = a + bX. The computer output from the regression analysis is
-The percentage of the total variation in Y that is NOT explained by the regression is ________.
-The percentage of the total variation in Y that is NOT explained by the regression is ________.
سؤال
4-4F Suppose Y is related to R and S in the following nonlinear way:

Twenty-six observations are used to obtain the following regression results:
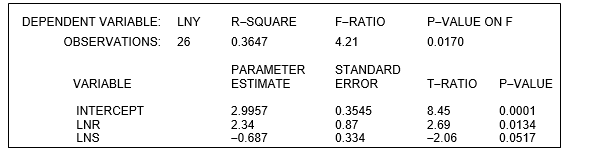
-In order to estimate the parameters a, b, and c, the equation must be transformed into the form: ___________________________________.
Twenty-six observations are used to obtain the following regression results:
-In order to estimate the parameters a, b, and c, the equation must be transformed into the form: ___________________________________.
سؤال
4-4F Suppose Y is related to R and S in the following nonlinear way:
Twenty-six observations are used to obtain the following regression results:
-There are _______ degrees of freedom for the t-test. At the 1% level of significance, the critical t-value for the test is __________.
Twenty-six observations are used to obtain the following regression results:
-There are _______ degrees of freedom for the t-test. At the 1% level of significance, the critical t-value for the test is __________.
سؤال
4-4F Suppose Y is related to R and S in the following nonlinear way:
Twenty-six observations are used to obtain the following regression results:
-At the 1% level of significance, _______ (is, is not) significant, _______ (is, is not) significant, and ________ (is, is not) significant.
Twenty-six observations are used to obtain the following regression results:
-At the 1% level of significance, _______ (is, is not) significant, _______ (is, is not) significant, and ________ (is, is not) significant.
سؤال
4-4F Suppose Y is related to R and S in the following nonlinear way:
Twenty-six observations are used to obtain the following regression results:
-The estimated value of a is ______________.
Twenty-six observations are used to obtain the following regression results:
-The estimated value of a is ______________.
سؤال
4-4F Suppose Y is related to R and S in the following nonlinear way:
Twenty-six observations are used to obtain the following regression results:
-The p-value for indicates that the exact level of significance is _________ percent, which is the probability of _________________.
Twenty-six observations are used to obtain the following regression results:
-The p-value for indicates that the exact level of significance is _________ percent, which is the probability of _________________.
سؤال
4-4F Suppose Y is related to R and S in the following nonlinear way:
Twenty-six observations are used to obtain the following regression results:
-At the 1% level of significance, the critical value of the F-statistic is _________. The model as a whole _________ (is, is not) significant at the 1% level.
Twenty-six observations are used to obtain the following regression results:
-At the 1% level of significance, the critical value of the F-statistic is _________. The model as a whole _________ (is, is not) significant at the 1% level.
سؤال
4-4F Suppose Y is related to R and S in the following nonlinear way:
Twenty-six observations are used to obtain the following regression results:
-If R equals 12 and S equals 30, the fitted (or predicted) value of Y is _____________.
Twenty-six observations are used to obtain the following regression results:
-If R equals 12 and S equals 30, the fitted (or predicted) value of Y is _____________.
سؤال
4-4F Suppose Y is related to R and S in the following nonlinear way:
Twenty-six observations are used to obtain the following regression results:
-The percentage of the total variation in the dependent variable NOT explained by the regression is _______________.
Twenty-six observations are used to obtain the following regression results:
-The percentage of the total variation in the dependent variable NOT explained by the regression is _______________.
سؤال
4-4F Suppose Y is related to R and S in the following nonlinear way:
Twenty-six observations are used to obtain the following regression results:
-If R increases by 14%, Y will increase by ________ percent.
Twenty-six observations are used to obtain the following regression results:
-If R increases by 14%, Y will increase by ________ percent.
سؤال
4-4F Suppose Y is related to R and S in the following nonlinear way:
Twenty-six observations are used to obtain the following regression results:
-A 6.87% increase in Y will occur if S ________________ (increases, decreases) by _______ percent.
Twenty-six observations are used to obtain the following regression results:
-A 6.87% increase in Y will occur if S ________________ (increases, decreases) by _______ percent.
سؤال
4-5F Seventy-five data point on H, U, V, and W are employed to estimate the parameters in the linear relation
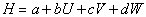 . The computer output from the regression analysis is shown below:
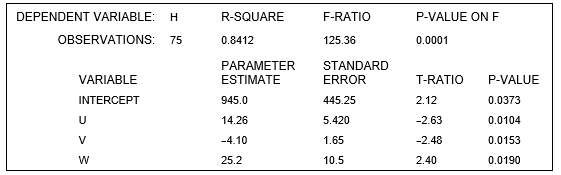
-The estimated sample regression line is _________________________________.
. The computer output from the regression analysis is shown below:-The estimated sample regression line is _________________________________.
سؤال
4-5F Seventy-five data point on H, U, V, and W are employed to estimate the parameters in the linear relation
. The computer output from the regression analysis is shown below:
-At the 2% level of significance,  _________ (is, is NOT) significant,
  _________ (is, is NOT) significant,
  _________ (is, is NOT) significant, and
  _________ (is, is NOT) significant.
. The computer output from the regression analysis is shown below:-At the 2% level of significance,
_________ (is, is NOT) significant, _________ (is, is NOT) significant, _________ (is, is NOT) significant, and _________ (is, is NOT) significant. سؤال
4-5F Seventy-five data point on H, U, V, and W are employed to estimate the parameters in the linear relation
. The computer output from the regression analysis is shown below:
-At the 4% level of significance, __________ (is, is not) significant,
  ________ (is, is not) significant,
  ________ (is, is not) significant, and
  ________ (is, is not) significant.
. The computer output from the regression analysis is shown below:-At the 4% level of significance,
__________ (is, is not) significant, ________ (is, is not) significant, ________ (is, is not) significant, and ________ (is, is not) significant. سؤال
4-5F Seventy-five data point on H, U, V, and W are employed to estimate the parameters in the linear relation
. The computer output from the regression analysis is shown below:
-The p-value for indicates that the exact level of significance is ______ percent, which is the probability of _______________________________.
. The computer output from the regression analysis is shown below:-The p-value for indicates that the exact level of significance is ______ percent, which is the probability of _______________________________.
سؤال
4-5F Seventy-five data point on H, U, V, and W are employed to estimate the parameters in the linear relation
. The computer output from the regression analysis is shown below:
-If U equals 4, V equals 8, and W equals 10, the fitted (or predicted) value of H is ____________.
. The computer output from the regression analysis is shown below:-If U equals 4, V equals 8, and W equals 10, the fitted (or predicted) value of H is ____________.
سؤال
4-5F Seventy-five data point on H, U, V, and W are employed to estimate the parameters in the linear relation
. The computer output from the regression analysis is shown below:
-The percentage of the total variation in H explained by the regression is ________ percent.
. The computer output from the regression analysis is shown below:-The percentage of the total variation in H explained by the regression is ________ percent.

فتح الحزمة
قم بالتسجيل لفتح البطاقات في هذه المجموعة!
Unlock Deck
Unlock Deck
1/50
العب
ملء الشاشة (f)
Deck 4: Basic Estimation Techniques
1
In a linear regression equation of the form Y = a + bX, the slope parameter b shows
A) X / Y.
B) Y / X.
C) Y / b.
D) X / b.
E) none of the above
A) X / Y.
B) Y / X.
C) Y / b.
D) X / b.
E) none of the above
Y / X.
2
Which of the following is an example of a time-series data set?
A) amount of labor employed in each factory in the U.S. in 2007.
B) amount of labor employed yearly in a specific factory from 1987 through 2007.
C) average amount of labor employed at specific times of the day at a specific factory in 2007.
D) All of the above are time-series data sets.
A) amount of labor employed in each factory in the U.S. in 2007.
B) amount of labor employed yearly in a specific factory from 1987 through 2007.
C) average amount of labor employed at specific times of the day at a specific factory in 2007.
D) All of the above are time-series data sets.
amount of labor employed yearly in a specific factory from 1987 through 2007.
3
In the linear model
, a test of the hypothesis that parameter c equals zero is
A) an F-test.
B) an R2-test.
C) a zero-statistic.
D) a t-test.
E) a Z-test.
, a test of the hypothesis that parameter c equals zero is
A) an F-test.
B) an R2-test.
C) a zero-statistic.
D) a t-test.
E) a Z-test.
a t-test.
4
refer to the following:
The linear regression equation, Y = a + bX, was estimated. The following computer printout was
obtained:
?
-What is the critical value of t at the 1% level of significance?
A) 1.746
B) 2.120
C) 2.878
D) 2.921
The linear regression equation, Y = a + bX, was estimated. The following computer printout was
obtained:
?
-What is the critical value of t at the 1% level of significance?
A) 1.746
B) 2.120
C) 2.878
D) 2.921
فتح الحزمة
افتح القفل للوصول البطاقات البالغ عددها 50 في هذه المجموعة.
فتح الحزمة
k this deck
5
refer to the following:
The linear regression equation, Y = a + bX, was estimated. The following computer printout was
obtained:
?
-Which of the following statements is correct at the 1% level of significance?
A) Both
And
Are statistically significant.
B) Neither
Nor
Is statistically significant.
C)
Is statistically significant, but
Is not.
D)
Is statistically significant, but
Is not.
فتح الحزمة
افتح القفل للوصول البطاقات البالغ عددها 50 في هذه المجموعة.
فتح الحزمة
k this deck
6
refer to the following:
The linear regression equation, Y = a + bX, was estimated. The following computer printout was
obtained:
?
-The exact level of significance of
Is
A) 0.171 percent.
B) 1 percent.
C) 1.71 percent.
D) 2.66 percent.
E) 2.921 percent.
The linear regression equation, Y = a + bX, was estimated. The following computer printout was
obtained:
?
-The exact level of significance of
Is
A) 0.171 percent.
B) 1 percent.
C) 1.71 percent.
D) 2.66 percent.
E) 2.921 percent.
فتح الحزمة
افتح القفل للوصول البطاقات البالغ عددها 50 في هذه المجموعة.
فتح الحزمة
k this deck
7
refer to the following:
The linear regression equation, Y = a + bX, was estimated. The following computer printout was
obtained:
?
-If X equals 20, what is the predicted value of Y?
A) 186.42
B) 165.69
C) -186.42
D)-411.72
The linear regression equation, Y = a + bX, was estimated. The following computer printout was
obtained:
?
-If X equals 20, what is the predicted value of Y?
A) 186.42
B) 165.69
C) -186.42
D)-411.72
فتح الحزمة
افتح القفل للوصول البطاقات البالغ عددها 50 في هذه المجموعة.
فتح الحزمة
k this deck
8
refer to the following:
A firm is experiencing theft problems at its warehouse. A consultant to the firm believes that the dollar loss from theft each week (T) depends on the number of security guards (G) and on the unemployment rate in the county where the warehouse is located (U measured as a percent). In order to test this hypothesis, the consultant estimated the regression equation T = a + bG + cU and obtained the following results:
-Which of the following is correct at the 1% level of significance?
A) The regression equation as a whole is statistically significant because the p-value of F is smaller than 0.01.
B) The estimates of the parameters a, b, and c are all statistically significant because the absolute values of their t-ratios exceed 2.797.
C) The estimates of the parameters a, b, and c are all statistically significant because the p- values for,
,
And
Are all less than 0.01.
D) The critical value of t is 2.797.
E) all of the above
فتح الحزمة
افتح القفل للوصول البطاقات البالغ عددها 50 في هذه المجموعة.
فتح الحزمة
k this deck
9
In the nonlinear function
, the parameter c measures
A) Y / Z.
B) the percent change in Y for a 1 percent change in Z.
C) the elasticity of Y with respect to Z.
D) both a and c
E) both b and c
, the parameter c measures
A) Y / Z.
B) the percent change in Y for a 1 percent change in Z.
C) the elasticity of Y with respect to Z.
D) both a and c
E) both b and c
فتح الحزمة
افتح القفل للوصول البطاقات البالغ عددها 50 في هذه المجموعة.
فتح الحزمة
k this deck
10
refer to the following computer output from estimating the parameters of the nonlinear model
The computer output from the regression analysis is:
-The nonlinear relation can be transformed into the following linear regression model:
A)
B)
C)
D)
The computer output from the regression analysis is:-The nonlinear relation can be transformed into the following linear regression model:
A)
B)
C)
D)
فتح الحزمة
افتح القفل للوصول البطاقات البالغ عددها 50 في هذه المجموعة.
فتح الحزمة
k this deck
11
refer to the following computer output from estimating the parameters of the nonlinear model
The computer output from the regression analysis is:
-The estimated value of a is
A) -0.6931
B) 0.50
C) -3.67
D) 2.66
The computer output from the regression analysis is:-The estimated value of a is
A) -0.6931
B) 0.50
C) -3.67
D) 2.66
فتح الحزمة
افتح القفل للوصول البطاقات البالغ عددها 50 في هذه المجموعة.
فتح الحزمة
k this deck
12
refer to the following computer output from estimating the parameters of the nonlinear model
The computer output from the regression analysis is:
-Which of the parameter estimates are statistically significant at the 90% level of confidence?
A) All the parameter estimates are statistically significant.
B) All parameter estimates except
And
Are statistically significant.
C)
Is not statistically significant, but all the rest of the parameter estimates are significant.
D)
Is not statistically significant, but all the rest of the parameter estimates are significant.
The computer output from the regression analysis is:-Which of the parameter estimates are statistically significant at the 90% level of confidence?
A) All the parameter estimates are statistically significant.
B) All parameter estimates except
And
Are statistically significant.
C)
Is not statistically significant, but all the rest of the parameter estimates are significant.
D)
Is not statistically significant, but all the rest of the parameter estimates are significant.
فتح الحزمة
افتح القفل للوصول البطاقات البالغ عددها 50 في هذه المجموعة.
فتح الحزمة
k this deck
13
refer to the following nonlinear model which relates W to P, Q, and R:
The computer output form the regression analysis is:
-The nonlinear relation can be transformed into the following linear regression model:
A)
B)
C)
D)
The computer output form the regression analysis is:
-The nonlinear relation can be transformed into the following linear regression model:
A)
B)
C)
D)
فتح الحزمة
افتح القفل للوصول البطاقات البالغ عددها 50 في هذه المجموعة.
فتح الحزمة
k this deck
14
refer to the following nonlinear model which relates W to P, Q, and R:
The computer output form the regression analysis is:
-Which of the parameter estimates are statistically significant at the 5% level of significance?
A) All the parameter estimates are statistically significant.
B) All parameter estimates except and are statistically significant.
C)
Is not statistically significant, but all the rest of the parameter estimates are significant.
D)
Is not statistically significant, but all the rest of the parameter estimates are significant.
The computer output form the regression analysis is:
-Which of the parameter estimates are statistically significant at the 5% level of significance?
A) All the parameter estimates are statistically significant.
B) All parameter estimates except
and are statistically significant.C)
Is not statistically significant, but all the rest of the parameter estimates are significant.
D)
Is not statistically significant, but all the rest of the parameter estimates are significant.
فتح الحزمة
افتح القفل للوصول البطاقات البالغ عددها 50 في هذه المجموعة.
فتح الحزمة
k this deck
15
refer to the following nonlinear model which relates W to P, Q, and R:
The computer output form the regression analysis is:
-The estimated value of a is
A) 0.916
B) 12.182
C) 2.50
D) 2.66
The computer output form the regression analysis is:
-The estimated value of a is
A) 0.916
B) 12.182
C) 2.50
D) 2.66
فتح الحزمة
افتح القفل للوصول البطاقات البالغ عددها 50 في هذه المجموعة.
فتح الحزمة
k this deck
16
In a multiple regression model, the coefficients on the independent variables measure
A) the percent of the variation in the dependent variable explained by a change in that independent variable, all other influences held constant.
B) the change in the dependent variable from a one-unit change in that independent variable, all other influences held constant.
C) the change in that independent variable from a one-unit change in the dependent variable, all other influences held constant.
D) the change in the dependent variable explained by the random error, all other influences held constant.
فتح الحزمة
افتح القفل للوصول البطاقات البالغ عددها 50 في هذه المجموعة.
فتح الحزمة
k this deck
17
refer to the following:
A manager wishes to estimate an average cost equation of the following form:
where Q is the level of output. Letting Z = Q2 and using least-squares estimation, the manager obtains the following computer output:
-Which of the parameter estimates are statistically significant at the 1% significance level?
A) All the parameter estimates are statistically significant.
B) All parameter estimates except are statistically significant.
C) is not statistically significant, but all the rest of the parameter estimates are significant.
D) is not statistically significant, but all the rest of the parameter estimates are significant.
A manager wishes to estimate an average cost equation of the following form:
where Q is the level of output. Letting Z = Q2 and using least-squares estimation, the manager obtains the following computer output:
-Which of the parameter estimates are statistically significant at the 1% significance level?
A) All the parameter estimates are statistically significant.
B) All parameter estimates except
are statistically significant.C)
is not statistically significant, but all the rest of the parameter estimates are significant.D)
is not statistically significant, but all the rest of the parameter estimates are significant. فتح الحزمة
افتح القفل للوصول البطاقات البالغ عددها 50 في هذه المجموعة.
فتح الحزمة
k this deck
18
refer to the following:
A manager wishes to estimate an average cost equation of the following form:
where Q is the level of output. Letting Z = Q2 and using least-squares estimation, the manager obtains the following computer output:
-When output is 40 units, what is average cost?
A) $200
B) $280
C) $360
D) $480
E) $520
A manager wishes to estimate an average cost equation of the following form:
where Q is the level of output. Letting Z = Q2 and using least-squares estimation, the manager obtains the following computer output:
-When output is 40 units, what is average cost?
A) $200
B) $280
C) $360
D) $480
E) $520
فتح الحزمة
افتح القفل للوصول البطاقات البالغ عددها 50 في هذه المجموعة.
فتح الحزمة
k this deck
19
refer to the following:
A manager wishes to estimate an average cost equation of the following form:
where Q is the level of output. Letting Z = Q2 and using least-squares estimation, the manager obtains the following computer output:
-When output is 20 units, what is average cost?
A) $160
B) $200
C) $280
D) $340
E) $360
A manager wishes to estimate an average cost equation of the following form:
where Q is the level of output. Letting Z = Q2 and using least-squares estimation, the manager obtains the following computer output:
-When output is 20 units, what is average cost?
A) $160
B) $200
C) $280
D) $340
E) $360
فتح الحزمة
افتح القفل للوصول البطاقات البالغ عددها 50 في هذه المجموعة.
فتح الحزمة
k this deck
20
A simple linear regression equation relates G and D as follows:
G = a + bD
-The explanatory variable is _______, and the dependent variable is ________.
G = a + bD
-The explanatory variable is _______, and the dependent variable is ________.
فتح الحزمة
افتح القفل للوصول البطاقات البالغ عددها 50 في هذه المجموعة.
فتح الحزمة
k this deck
21
A simple linear regression equation relates G and D as follows:
G = a + bD
-The slope parameter is ______, and the intercept parameter _______.
G = a + bD
-The slope parameter is ______, and the intercept parameter _______.
فتح الحزمة
افتح القفل للوصول البطاقات البالغ عددها 50 في هذه المجموعة.
فتح الحزمة
k this deck
22
A simple linear regression equation relates G and D as follows:
G = a + bD
-When D is zero, G equals _______.
G = a + bD
-When D is zero, G equals _______.
فتح الحزمة
افتح القفل للوصول البطاقات البالغ عددها 50 في هذه المجموعة.
فتح الحزمة
k this deck
23
A simple linear regression equation relates G and D as follows:
G = a + bD
-For each one-unit increase in D, the change in R is ______ units.
G = a + bD
-For each one-unit increase in D, the change in R is ______ units.
فتح الحزمة
افتح القفل للوصول البطاقات البالغ عددها 50 في هذه المجموعة.
فتح الحزمة
k this deck
24
The linear regression equation G = a + bD is estimated using 24 observations on R and W. The least-squares estimate of b is -22.5, and the standard error of the estimate is 8.36. Perform a t-test for statistical significance of
at the 1% level of significance.
-There are _____ degrees of freedom for the t-test.
at the 1% level of significance.-There are _____ degrees of freedom for the t-test.
فتح الحزمة
افتح القفل للوصول البطاقات البالغ عددها 50 في هذه المجموعة.
فتح الحزمة
k this deck
25
The linear regression equation G = a + bD is estimated using 24 observations on R and W. The least-squares estimate of b is -22.5, and the standard error of the estimate is 8.36. Perform a t-test for statistical significance of
at the 1% level of significance.
-The value of the t-statistic is _________. The critical t-value for the test is _________.
at the 1% level of significance.-The value of the t-statistic is _________. The critical t-value for the test is _________.
فتح الحزمة
افتح القفل للوصول البطاقات البالغ عددها 50 في هذه المجموعة.
فتح الحزمة
k this deck
26
The linear regression equation G = a + bD is estimated using 24 observations on R and W. The least-squares estimate of b is -22.5, and the standard error of the estimate is 8.36. Perform a t-test for statistical significance of
at the 1% level of significance.
-The parameter estimate _________ (is, is not) statistically significant at the 1% level.
at the 1% level of significance.-The parameter estimate _________ (is, is not) statistically significant at the 1% level.
فتح الحزمة
افتح القفل للوصول البطاقات البالغ عددها 50 في هذه المجموعة.
فتح الحزمة
k this deck
27
Thirty-two data points on Y and X are employed to estimate the parameters in the linear relation Y = a + bX. The computer output from the regression analysis is
-The equation of the sample regression line is: = __________________________.
-The equation of the sample regression line is: = __________________________.
فتح الحزمة
افتح القفل للوصول البطاقات البالغ عددها 50 في هذه المجموعة.
فتح الحزمة
k this deck
28
Thirty-two data points on Y and X are employed to estimate the parameters in the linear relation Y = a + bX. The computer output from the regression analysis is
-There are ______ degrees of freedom for the t-test. At the 5% level of significance, the critical t-value for the test is ______________.
-There are ______ degrees of freedom for the t-test. At the 5% level of significance, the critical t-value for the test is ______________.
فتح الحزمة
افتح القفل للوصول البطاقات البالغ عددها 50 في هذه المجموعة.
فتح الحزمة
k this deck
29
Thirty-two data points on Y and X are employed to estimate the parameters in the linear relation Y = a + bX. The computer output from the regression analysis is
-At the 5% level of significance, __________ (is, not) significant, and ________ (is, is not) significant.
-At the 5% level of significance, __________ (is, not) significant, and ________ (is, is not) significant.
فتح الحزمة
افتح القفل للوصول البطاقات البالغ عددها 50 في هذه المجموعة.
فتح الحزمة
k this deck
30
Thirty-two data points on Y and X are employed to estimate the parameters in the linear relation Y = a + bX. The computer output from the regression analysis is
-At the 2% level of significance, the critical t-value for a t-test is ___________. At the 2% level of significance, _________ (is, is not) significant, and _________ (is, is not) significant.
-At the 2% level of significance, the critical t-value for a t-test is ___________. At the 2% level of significance, _________ (is, is not) significant, and _________ (is, is not) significant.
فتح الحزمة
افتح القفل للوصول البطاقات البالغ عددها 50 في هذه المجموعة.
فتح الحزمة
k this deck
31
Thirty-two data points on Y and X are employed to estimate the parameters in the linear relation Y = a + bX. The computer output from the regression analysis is
-The p-value for indicates that the exact level of significance is ______ percent, which is the probability of _________________________________________.
-The p-value for indicates that the exact level of significance is ______ percent, which is the probability of _________________________________________.
فتح الحزمة
افتح القفل للوصول البطاقات البالغ عددها 50 في هذه المجموعة.
فتح الحزمة
k this deck
32
Thirty-two data points on Y and X are employed to estimate the parameters in the linear relation Y = a + bX. The computer output from the regression analysis is
-At the 5% level of significance, the critical value of the F-statistic is _______. The model as a whole ___________(is, is not) significant at the 5% level.
-At the 5% level of significance, the critical value of the F-statistic is _______. The model as a whole ___________(is, is not) significant at the 5% level.
فتح الحزمة
افتح القفل للوصول البطاقات البالغ عددها 50 في هذه المجموعة.
فتح الحزمة
k this deck
33
Thirty-two data points on Y and X are employed to estimate the parameters in the linear relation Y = a + bX. The computer output from the regression analysis is
-If X equals 240, the fitted (or predicted) value of Y is ____________________________.
-If X equals 240, the fitted (or predicted) value of Y is ____________________________.
فتح الحزمة
افتح القفل للوصول البطاقات البالغ عددها 50 في هذه المجموعة.
فتح الحزمة
k this deck
34
Thirty-two data points on Y and X are employed to estimate the parameters in the linear relation Y = a + bX. The computer output from the regression analysis is
-The percentage of the total variation in Y that is NOT explained by the regression is ________.
-The percentage of the total variation in Y that is NOT explained by the regression is ________.
فتح الحزمة
افتح القفل للوصول البطاقات البالغ عددها 50 في هذه المجموعة.
فتح الحزمة
k this deck
35
4-4F Suppose Y is related to R and S in the following nonlinear way:
Twenty-six observations are used to obtain the following regression results:
-In order to estimate the parameters a, b, and c, the equation must be transformed into the form: ___________________________________.
Twenty-six observations are used to obtain the following regression results:
-In order to estimate the parameters a, b, and c, the equation must be transformed into the form: ___________________________________.
فتح الحزمة
افتح القفل للوصول البطاقات البالغ عددها 50 في هذه المجموعة.
فتح الحزمة
k this deck
36
4-4F Suppose Y is related to R and S in the following nonlinear way:
Twenty-six observations are used to obtain the following regression results:
-There are _______ degrees of freedom for the t-test. At the 1% level of significance, the critical t-value for the test is __________.
Twenty-six observations are used to obtain the following regression results:
-There are _______ degrees of freedom for the t-test. At the 1% level of significance, the critical t-value for the test is __________.
فتح الحزمة
افتح القفل للوصول البطاقات البالغ عددها 50 في هذه المجموعة.
فتح الحزمة
k this deck
37
4-4F Suppose Y is related to R and S in the following nonlinear way:
Twenty-six observations are used to obtain the following regression results:
-At the 1% level of significance, _______ (is, is not) significant, _______ (is, is not) significant, and ________ (is, is not) significant.
Twenty-six observations are used to obtain the following regression results:
-At the 1% level of significance, _______ (is, is not) significant, _______ (is, is not) significant, and ________ (is, is not) significant.
فتح الحزمة
افتح القفل للوصول البطاقات البالغ عددها 50 في هذه المجموعة.
فتح الحزمة
k this deck
38
4-4F Suppose Y is related to R and S in the following nonlinear way:
Twenty-six observations are used to obtain the following regression results:
-The estimated value of a is ______________.
Twenty-six observations are used to obtain the following regression results:
-The estimated value of a is ______________.
فتح الحزمة
افتح القفل للوصول البطاقات البالغ عددها 50 في هذه المجموعة.
فتح الحزمة
k this deck
39
4-4F Suppose Y is related to R and S in the following nonlinear way:
Twenty-six observations are used to obtain the following regression results:
-The p-value for indicates that the exact level of significance is _________ percent, which is the probability of _________________.
Twenty-six observations are used to obtain the following regression results:
-The p-value for indicates that the exact level of significance is _________ percent, which is the probability of _________________.
فتح الحزمة
افتح القفل للوصول البطاقات البالغ عددها 50 في هذه المجموعة.
فتح الحزمة
k this deck
40
4-4F Suppose Y is related to R and S in the following nonlinear way:
Twenty-six observations are used to obtain the following regression results:
-At the 1% level of significance, the critical value of the F-statistic is _________. The model as a whole _________ (is, is not) significant at the 1% level.
Twenty-six observations are used to obtain the following regression results:
-At the 1% level of significance, the critical value of the F-statistic is _________. The model as a whole _________ (is, is not) significant at the 1% level.
فتح الحزمة
افتح القفل للوصول البطاقات البالغ عددها 50 في هذه المجموعة.
فتح الحزمة
k this deck
41
4-4F Suppose Y is related to R and S in the following nonlinear way:
Twenty-six observations are used to obtain the following regression results:
-If R equals 12 and S equals 30, the fitted (or predicted) value of Y is _____________.
Twenty-six observations are used to obtain the following regression results:
-If R equals 12 and S equals 30, the fitted (or predicted) value of Y is _____________.
فتح الحزمة
افتح القفل للوصول البطاقات البالغ عددها 50 في هذه المجموعة.
فتح الحزمة
k this deck
42
4-4F Suppose Y is related to R and S in the following nonlinear way:
Twenty-six observations are used to obtain the following regression results:
-The percentage of the total variation in the dependent variable NOT explained by the regression is _______________.
Twenty-six observations are used to obtain the following regression results:
-The percentage of the total variation in the dependent variable NOT explained by the regression is _______________.
فتح الحزمة
افتح القفل للوصول البطاقات البالغ عددها 50 في هذه المجموعة.
فتح الحزمة
k this deck
43
4-4F Suppose Y is related to R and S in the following nonlinear way:
Twenty-six observations are used to obtain the following regression results:
-If R increases by 14%, Y will increase by ________ percent.
Twenty-six observations are used to obtain the following regression results:
-If R increases by 14%, Y will increase by ________ percent.
فتح الحزمة
افتح القفل للوصول البطاقات البالغ عددها 50 في هذه المجموعة.
فتح الحزمة
k this deck
44
4-4F Suppose Y is related to R and S in the following nonlinear way:
Twenty-six observations are used to obtain the following regression results:
-A 6.87% increase in Y will occur if S ________________ (increases, decreases) by _______ percent.
Twenty-six observations are used to obtain the following regression results:
-A 6.87% increase in Y will occur if S ________________ (increases, decreases) by _______ percent.
فتح الحزمة
افتح القفل للوصول البطاقات البالغ عددها 50 في هذه المجموعة.
فتح الحزمة
k this deck
45
4-5F Seventy-five data point on H, U, V, and W are employed to estimate the parameters in the linear relation
. The computer output from the regression analysis is shown below:
-The estimated sample regression line is _________________________________.
. The computer output from the regression analysis is shown below:-The estimated sample regression line is _________________________________.
فتح الحزمة
افتح القفل للوصول البطاقات البالغ عددها 50 في هذه المجموعة.
فتح الحزمة
k this deck
46
4-5F Seventy-five data point on H, U, V, and W are employed to estimate the parameters in the linear relation
. The computer output from the regression analysis is shown below:
-At the 2% level of significance, _________ (is, is NOT) significant, _________ (is, is NOT) significant, _________ (is, is NOT) significant, and _________ (is, is NOT) significant.
. The computer output from the regression analysis is shown below:-At the 2% level of significance,
_________ (is, is NOT) significant, _________ (is, is NOT) significant, _________ (is, is NOT) significant, and _________ (is, is NOT) significant. فتح الحزمة
افتح القفل للوصول البطاقات البالغ عددها 50 في هذه المجموعة.
فتح الحزمة
k this deck
47
4-5F Seventy-five data point on H, U, V, and W are employed to estimate the parameters in the linear relation
. The computer output from the regression analysis is shown below:
-At the 4% level of significance, __________ (is, is not) significant, ________ (is, is not) significant, ________ (is, is not) significant, and ________ (is, is not) significant.
. The computer output from the regression analysis is shown below:-At the 4% level of significance,
__________ (is, is not) significant, ________ (is, is not) significant, ________ (is, is not) significant, and ________ (is, is not) significant. فتح الحزمة
افتح القفل للوصول البطاقات البالغ عددها 50 في هذه المجموعة.
فتح الحزمة
k this deck
48
4-5F Seventy-five data point on H, U, V, and W are employed to estimate the parameters in the linear relation
. The computer output from the regression analysis is shown below:
-The p-value for indicates that the exact level of significance is ______ percent, which is the probability of _______________________________.
. The computer output from the regression analysis is shown below:-The p-value for indicates that the exact level of significance is ______ percent, which is the probability of _______________________________.
فتح الحزمة
افتح القفل للوصول البطاقات البالغ عددها 50 في هذه المجموعة.
فتح الحزمة
k this deck
49
4-5F Seventy-five data point on H, U, V, and W are employed to estimate the parameters in the linear relation
. The computer output from the regression analysis is shown below:
-If U equals 4, V equals 8, and W equals 10, the fitted (or predicted) value of H is ____________.
. The computer output from the regression analysis is shown below:-If U equals 4, V equals 8, and W equals 10, the fitted (or predicted) value of H is ____________.
فتح الحزمة
افتح القفل للوصول البطاقات البالغ عددها 50 في هذه المجموعة.
فتح الحزمة
k this deck
50
4-5F Seventy-five data point on H, U, V, and W are employed to estimate the parameters in the linear relation
. The computer output from the regression analysis is shown below:
-The percentage of the total variation in H explained by the regression is ________ percent.
. The computer output from the regression analysis is shown below:-The percentage of the total variation in H explained by the regression is ________ percent.
فتح الحزمة
افتح القفل للوصول البطاقات البالغ عددها 50 في هذه المجموعة.
فتح الحزمة
k this deck
فتح الحزمة
افتح القفل للوصول البطاقات البالغ عددها 50 في هذه المجموعة.


