Deck 2: Organizing and Summarizing Data
ملء الشاشة (f)
سؤال
Provide an appropriate response. Round relative frequencies to thousandths.
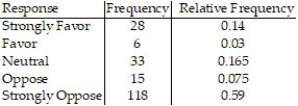
-The results of a survey about a recent judicial appointment are given in the table below. Construct a relative frequency distribution.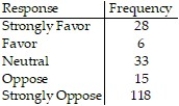
-The results of a survey about a recent judicial appointment are given in the table below. Construct a relative frequency distribution.
سؤال
Provide an appropriate response. Round relative frequencies to thousandths.
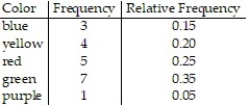
-The preschool children at Elmwood Elementary School were asked to name their favorite color. The results are listed below. Construct a frequency distribution and a relative frequency distribution.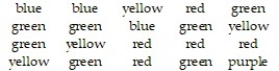
-The preschool children at Elmwood Elementary School were asked to name their favorite color. The results are listed below. Construct a frequency distribution and a relative frequency distribution.
سؤال
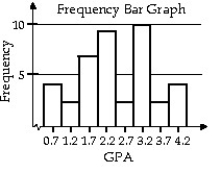
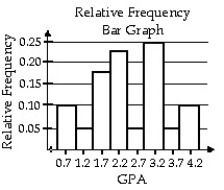
The grade point averages for 40 evening students are listed below. Construct a frequency bar graph and a relative frequency bar graph. 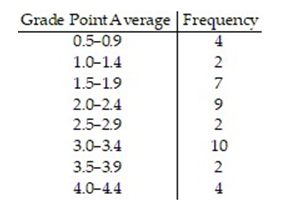
سؤال
Listed below are the ACT scores of 40 randomly selected students at a major university. 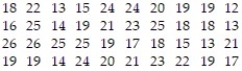 a) Construct a relative frequency bar graph of the data, using eight classes.
b) If the university wants to accept the top 90% of the applicants, what should the minimum score be?
c) If the university sets the minimum score at 17, what percent of the applicants will be accepted?
a) Construct a relative frequency bar graph of the data, using eight classes.b) If the university wants to accept the top 90% of the applicants, what should the minimum score be?
c) If the university sets the minimum score at 17, what percent of the applicants will be accepted?
سؤال
The pie chart shows the percentage of votes received by each candidate in the student council presidential election. Use the pie chart to answer the question.
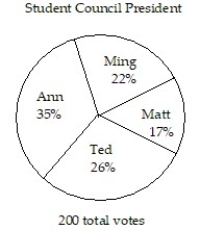
-Who got the most votes?
A) Matt
B) Ming
C) Ted
D) Ann
-Who got the most votes?
A) Matt
B) Ming
C) Ted
D) Ann
سؤال
The pie chart shows the percentage of votes received by each candidate in the student council presidential election. Use the pie chart to answer the question.
- Who got the fewest votes?
A) Lili
B) Ted
C) Gina
D) Ben
- Who got the fewest votes?
A) Lili
B) Ted
C) Gina
D) Ben
سؤال
The pie chart shows the percentage of votes received by each candidate in the student council presidential election. Use the pie chart to answer the question.
- What percent of the votes did Ann and Ted receive together?
A) 40%
B) 60%
C) 22%
D) 18%
- What percent of the votes did Ann and Ted receive together?
A) 40%
B) 60%
C) 22%
D) 18%
سؤال
Determine the number of classes in the frequency table below. 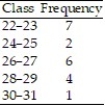
A) 5
B) 2
C) 20
D) 6
A) 5
B) 2
C) 20
D) 6
سؤال
Find the class width for the frequency table below. 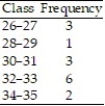
A) 1
B) 2
C) 2.5
D) 1.5
A) 1
B) 2
C) 2.5
D) 1.5
سؤال
A researcher records the number of employees of each of the IT companies in the town of Westmoore. The results are summarized in the table. 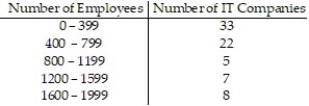 Find the class limits of the third class.
A) lower limit: 799.5; upper limit: 1199.5
B) lower limit: 800; upper limit: 1199
C) lower limit: 799; upper limit: 1200
D) lower limit: 800; upper limit: 1200
Find the class limits of the third class.A) lower limit: 799.5; upper limit: 1199.5
B) lower limit: 800; upper limit: 1199
C) lower limit: 799; upper limit: 1200
D) lower limit: 800; upper limit: 1200
سؤال
The weights (in pounds) of babies born at St Mary's hospital last month are summarized in the table. 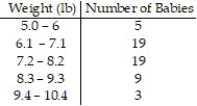 Find the class width.
A) 1.05 lb
B) 1.15 lb
C) 1.1 lb
D) 1 lb
Find the class width.A) 1.05 lb
B) 1.15 lb
C) 1.1 lb
D) 1 lb
سؤال
The weights (in pounds) of babies born at St Mary's hospital last month are summarized in the table. 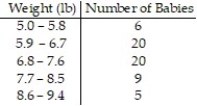 Find the class limits for the second class.
A) lower limit: 5.9; upper limit: 6.7
B) lower limit: 5.8; upper limit: 6.8
C) lower limit: 5.85; upper limit: 6.75
D) lower limit: 5.9; upper limit: 6.8
Find the class limits for the second class.A) lower limit: 5.9; upper limit: 6.7
B) lower limit: 5.8; upper limit: 6.8
C) lower limit: 5.85; upper limit: 6.75
D) lower limit: 5.9; upper limit: 6.8
سؤال
The table below summarizes the weights of the almonds (in grams) in a one-pound bag. What is the class width? 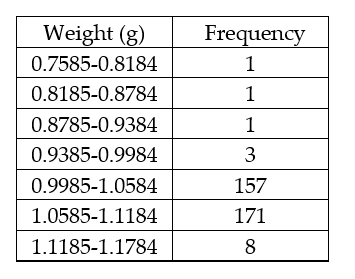
A) 0.06
B) 0.408
C) 0.4
D) 0.059
A) 0.06
B) 0.408
C) 0.4
D) 0.059
سؤال
A sample of 15 Boy Scouts was selected and their weights (in pounds) were recorded as follows: 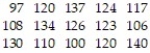 a. Using a class width of 10, give the upper and lower limits for five classes, starting with a lower limit of 95 for the first class.
b. Construct a frequency distribution for the data
a. Using a class width of 10, give the upper and lower limits for five classes, starting with a lower limit of 95 for the first class.b. Construct a frequency distribution for the data
سؤال
Construct the specified histogram.
-For the data below, construct a frequency distribution and a relative frequency distribution.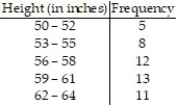
-For the data below, construct a frequency distribution and a relative frequency distribution.
سؤال
Construct the specified histogram.
-For the data below, construct a frequency histogram and a relative frequency histogram.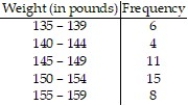
-For the data below, construct a frequency histogram and a relative frequency histogram.
سؤال
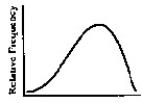
Describe the shape of the distribution.
-
A) bell shaped
B) skewed to the right
C) uniform
D) skewed to the left
-
A) bell shaped
B) skewed to the right
C) uniform
D) skewed to the left
سؤال
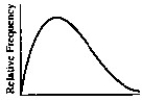
Describe the shape of the distribution.
-
A) uniform
B) bell shaped
C) skewed to the right
D) skewed to the left
-
A) uniform
B) bell shaped
C) skewed to the right
D) skewed to the left
سؤال
Describe the shape of the distribution.
-A sample of 15 Little League players was selected and their weights (in pounds) were recorded as follows: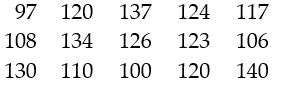
-A sample of 15 Little League players was selected and their weights (in pounds) were recorded as follows:
سؤال
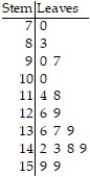
Determine the original set of data.
- Legend:
  0 represents 5 0
-
Legend: 0 represents 5 0 سؤال
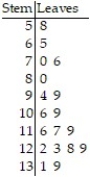
Determine the original set of data.
- Legend:
  8 represents 5. 8
-
Legend: 8 represents 5. 8 سؤال
Construct a frequency polygon for the data.
-
-
سؤال
Construct a frequency polygon for the data.
-
-
سؤال
Construct a frequency polygon for the data.
-The grade point averages for 40 evening students are listed below. Construct a frequency polygon using eight classes.
-The grade point averages for 40 evening students are listed below. Construct a frequency polygon using eight classes.
سؤال
Construct the requested ogive.
-The grade point averages for 40 evening students are listed below. Construct a frequency ogive usingeight classes.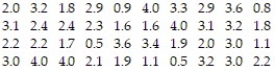
-The grade point averages for 40 evening students are listed below. Construct a frequency ogive usingeight classes.
سؤال
Construct the requested ogive.
-The heights (in inches) of 30 lawyers are listed below. Construct a frequency ogive using five classes.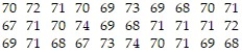
-The heights (in inches) of 30 lawyers are listed below. Construct a frequency ogive using five classes.
سؤال
Construct the requested ogive.
-The grade point averages for 40 evening students are listed below. Construct a relative frequency ogive using eight classes.
-The grade point averages for 40 evening students are listed below. Construct a relative frequency ogive using eight classes.
سؤال
Construct the requested ogive.
-The heights (in inches) of 30 lawyers are listed below. Construct a relative frequency ogive using five classes.
-The heights (in inches) of 30 lawyers are listed below. Construct a relative frequency ogive using five classes.
سؤال
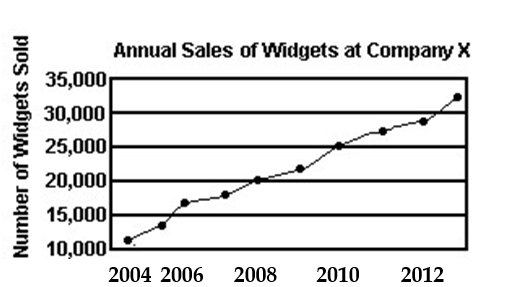
Explain what is misleading about the graphic.
-
A) The trend is depicted in the wrong direction.
B) The graphic is not misleading.
C) The vertical scale does not begin at zero.
D) The horizontal label is incomplete.
-
A) The trend is depicted in the wrong direction.
B) The graphic is not misleading.
C) The vertical scale does not begin at zero.
D) The horizontal label is incomplete.
سؤال
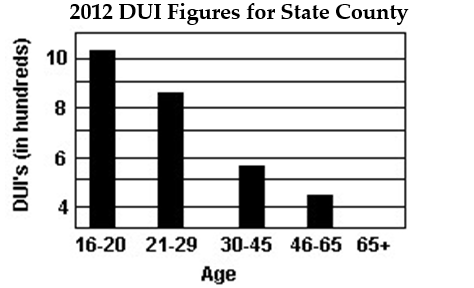
Explain what is misleading about the graphic.
-
A) The graphic is not misleading.
B) The graphic only includes information for one year.
C) The horizontal scale does not begin at zero.
D) The graphic may give the impression that drivers over age 65 had no DUI's in 2012.
-
A) The graphic is not misleading.
B) The graphic only includes information for one year.
C) The horizontal scale does not begin at zero.
D) The graphic may give the impression that drivers over age 65 had no DUI's in 2012.

فتح الحزمة
قم بالتسجيل لفتح البطاقات في هذه المجموعة!
Unlock Deck
Unlock Deck
1/30
العب
ملء الشاشة (f)
Deck 2: Organizing and Summarizing Data
1
Provide an appropriate response. Round relative frequencies to thousandths.
-The results of a survey about a recent judicial appointment are given in the table below. Construct a relative frequency distribution.
-The results of a survey about a recent judicial appointment are given in the table below. Construct a relative frequency distribution.
2
Provide an appropriate response. Round relative frequencies to thousandths.
-The preschool children at Elmwood Elementary School were asked to name their favorite color. The results are listed below. Construct a frequency distribution and a relative frequency distribution.
-The preschool children at Elmwood Elementary School were asked to name their favorite color. The results are listed below. Construct a frequency distribution and a relative frequency distribution.
3
The grade point averages for 40 evening students are listed below. Construct a frequency bar graph and a relative frequency bar graph.
4
Listed below are the ACT scores of 40 randomly selected students at a major university. a) Construct a relative frequency bar graph of the data, using eight classes.
b) If the university wants to accept the top 90% of the applicants, what should the minimum score be?
c) If the university sets the minimum score at 17, what percent of the applicants will be accepted?
a) Construct a relative frequency bar graph of the data, using eight classes.b) If the university wants to accept the top 90% of the applicants, what should the minimum score be?
c) If the university sets the minimum score at 17, what percent of the applicants will be accepted?
فتح الحزمة
افتح القفل للوصول البطاقات البالغ عددها 30 في هذه المجموعة.
فتح الحزمة
k this deck
5
The pie chart shows the percentage of votes received by each candidate in the student council presidential election. Use the pie chart to answer the question.
-Who got the most votes?
A) Matt
B) Ming
C) Ted
D) Ann
-Who got the most votes?
A) Matt
B) Ming
C) Ted
D) Ann
فتح الحزمة
افتح القفل للوصول البطاقات البالغ عددها 30 في هذه المجموعة.
فتح الحزمة
k this deck
6
The pie chart shows the percentage of votes received by each candidate in the student council presidential election. Use the pie chart to answer the question.
- Who got the fewest votes?
A) Lili
B) Ted
C) Gina
D) Ben
- Who got the fewest votes?
A) Lili
B) Ted
C) Gina
D) Ben
فتح الحزمة
افتح القفل للوصول البطاقات البالغ عددها 30 في هذه المجموعة.
فتح الحزمة
k this deck
7
The pie chart shows the percentage of votes received by each candidate in the student council presidential election. Use the pie chart to answer the question.
- What percent of the votes did Ann and Ted receive together?
A) 40%
B) 60%
C) 22%
D) 18%
- What percent of the votes did Ann and Ted receive together?
A) 40%
B) 60%
C) 22%
D) 18%
فتح الحزمة
افتح القفل للوصول البطاقات البالغ عددها 30 في هذه المجموعة.
فتح الحزمة
k this deck
8
Determine the number of classes in the frequency table below.
A) 5
B) 2
C) 20
D) 6
A) 5
B) 2
C) 20
D) 6
فتح الحزمة
افتح القفل للوصول البطاقات البالغ عددها 30 في هذه المجموعة.
فتح الحزمة
k this deck
9
Find the class width for the frequency table below.
A) 1
B) 2
C) 2.5
D) 1.5
A) 1
B) 2
C) 2.5
D) 1.5
فتح الحزمة
افتح القفل للوصول البطاقات البالغ عددها 30 في هذه المجموعة.
فتح الحزمة
k this deck
10
A researcher records the number of employees of each of the IT companies in the town of Westmoore. The results are summarized in the table. Find the class limits of the third class.
A) lower limit: 799.5; upper limit: 1199.5
B) lower limit: 800; upper limit: 1199
C) lower limit: 799; upper limit: 1200
D) lower limit: 800; upper limit: 1200
Find the class limits of the third class.A) lower limit: 799.5; upper limit: 1199.5
B) lower limit: 800; upper limit: 1199
C) lower limit: 799; upper limit: 1200
D) lower limit: 800; upper limit: 1200
فتح الحزمة
افتح القفل للوصول البطاقات البالغ عددها 30 في هذه المجموعة.
فتح الحزمة
k this deck
11
The weights (in pounds) of babies born at St Mary's hospital last month are summarized in the table. Find the class width.
A) 1.05 lb
B) 1.15 lb
C) 1.1 lb
D) 1 lb
Find the class width.A) 1.05 lb
B) 1.15 lb
C) 1.1 lb
D) 1 lb
فتح الحزمة
افتح القفل للوصول البطاقات البالغ عددها 30 في هذه المجموعة.
فتح الحزمة
k this deck
12
The weights (in pounds) of babies born at St Mary's hospital last month are summarized in the table. Find the class limits for the second class.
A) lower limit: 5.9; upper limit: 6.7
B) lower limit: 5.8; upper limit: 6.8
C) lower limit: 5.85; upper limit: 6.75
D) lower limit: 5.9; upper limit: 6.8
Find the class limits for the second class.A) lower limit: 5.9; upper limit: 6.7
B) lower limit: 5.8; upper limit: 6.8
C) lower limit: 5.85; upper limit: 6.75
D) lower limit: 5.9; upper limit: 6.8
فتح الحزمة
افتح القفل للوصول البطاقات البالغ عددها 30 في هذه المجموعة.
فتح الحزمة
k this deck
13
The table below summarizes the weights of the almonds (in grams) in a one-pound bag. What is the class width?
A) 0.06
B) 0.408
C) 0.4
D) 0.059
A) 0.06
B) 0.408
C) 0.4
D) 0.059
فتح الحزمة
افتح القفل للوصول البطاقات البالغ عددها 30 في هذه المجموعة.
فتح الحزمة
k this deck
14
A sample of 15 Boy Scouts was selected and their weights (in pounds) were recorded as follows: a. Using a class width of 10, give the upper and lower limits for five classes, starting with a lower limit of 95 for the first class.
b. Construct a frequency distribution for the data
a. Using a class width of 10, give the upper and lower limits for five classes, starting with a lower limit of 95 for the first class.b. Construct a frequency distribution for the data
فتح الحزمة
افتح القفل للوصول البطاقات البالغ عددها 30 في هذه المجموعة.
فتح الحزمة
k this deck
15
Construct the specified histogram.
-For the data below, construct a frequency distribution and a relative frequency distribution.
-For the data below, construct a frequency distribution and a relative frequency distribution.
فتح الحزمة
افتح القفل للوصول البطاقات البالغ عددها 30 في هذه المجموعة.
فتح الحزمة
k this deck
16
Construct the specified histogram.
-For the data below, construct a frequency histogram and a relative frequency histogram.
-For the data below, construct a frequency histogram and a relative frequency histogram.
فتح الحزمة
افتح القفل للوصول البطاقات البالغ عددها 30 في هذه المجموعة.
فتح الحزمة
k this deck
17
Describe the shape of the distribution.
-
A) bell shaped
B) skewed to the right
C) uniform
D) skewed to the left
-
A) bell shaped
B) skewed to the right
C) uniform
D) skewed to the left
فتح الحزمة
افتح القفل للوصول البطاقات البالغ عددها 30 في هذه المجموعة.
فتح الحزمة
k this deck
18
Describe the shape of the distribution.
-
A) uniform
B) bell shaped
C) skewed to the right
D) skewed to the left
-
A) uniform
B) bell shaped
C) skewed to the right
D) skewed to the left
فتح الحزمة
افتح القفل للوصول البطاقات البالغ عددها 30 في هذه المجموعة.
فتح الحزمة
k this deck
19
Describe the shape of the distribution.
-A sample of 15 Little League players was selected and their weights (in pounds) were recorded as follows:
-A sample of 15 Little League players was selected and their weights (in pounds) were recorded as follows:
فتح الحزمة
افتح القفل للوصول البطاقات البالغ عددها 30 في هذه المجموعة.
فتح الحزمة
k this deck
20
Determine the original set of data.
- Legend: 0 represents 5 0
-
Legend: 0 represents 5 0 فتح الحزمة
افتح القفل للوصول البطاقات البالغ عددها 30 في هذه المجموعة.
فتح الحزمة
k this deck
21
Determine the original set of data.
- Legend: 8 represents 5. 8
-
Legend: 8 represents 5. 8 فتح الحزمة
افتح القفل للوصول البطاقات البالغ عددها 30 في هذه المجموعة.
فتح الحزمة
k this deck
22
Construct a frequency polygon for the data.
-
-
فتح الحزمة
افتح القفل للوصول البطاقات البالغ عددها 30 في هذه المجموعة.
فتح الحزمة
k this deck
23
Construct a frequency polygon for the data.
-
-
فتح الحزمة
افتح القفل للوصول البطاقات البالغ عددها 30 في هذه المجموعة.
فتح الحزمة
k this deck
24
Construct a frequency polygon for the data.
-The grade point averages for 40 evening students are listed below. Construct a frequency polygon using eight classes.
-The grade point averages for 40 evening students are listed below. Construct a frequency polygon using eight classes.
فتح الحزمة
افتح القفل للوصول البطاقات البالغ عددها 30 في هذه المجموعة.
فتح الحزمة
k this deck
25
Construct the requested ogive.
-The grade point averages for 40 evening students are listed below. Construct a frequency ogive usingeight classes.
-The grade point averages for 40 evening students are listed below. Construct a frequency ogive usingeight classes.
فتح الحزمة
افتح القفل للوصول البطاقات البالغ عددها 30 في هذه المجموعة.
فتح الحزمة
k this deck
26
Construct the requested ogive.
-The heights (in inches) of 30 lawyers are listed below. Construct a frequency ogive using five classes.
-The heights (in inches) of 30 lawyers are listed below. Construct a frequency ogive using five classes.
فتح الحزمة
افتح القفل للوصول البطاقات البالغ عددها 30 في هذه المجموعة.
فتح الحزمة
k this deck
27
Construct the requested ogive.
-The grade point averages for 40 evening students are listed below. Construct a relative frequency ogive using eight classes.
-The grade point averages for 40 evening students are listed below. Construct a relative frequency ogive using eight classes.
فتح الحزمة
افتح القفل للوصول البطاقات البالغ عددها 30 في هذه المجموعة.
فتح الحزمة
k this deck
28
Construct the requested ogive.
-The heights (in inches) of 30 lawyers are listed below. Construct a relative frequency ogive using five classes.
-The heights (in inches) of 30 lawyers are listed below. Construct a relative frequency ogive using five classes.
فتح الحزمة
افتح القفل للوصول البطاقات البالغ عددها 30 في هذه المجموعة.
فتح الحزمة
k this deck
29
Explain what is misleading about the graphic.
-
A) The trend is depicted in the wrong direction.
B) The graphic is not misleading.
C) The vertical scale does not begin at zero.
D) The horizontal label is incomplete.
-
A) The trend is depicted in the wrong direction.
B) The graphic is not misleading.
C) The vertical scale does not begin at zero.
D) The horizontal label is incomplete.
فتح الحزمة
افتح القفل للوصول البطاقات البالغ عددها 30 في هذه المجموعة.
فتح الحزمة
k this deck
30
Explain what is misleading about the graphic.
-
A) The graphic is not misleading.
B) The graphic only includes information for one year.
C) The horizontal scale does not begin at zero.
D) The graphic may give the impression that drivers over age 65 had no DUI's in 2012.
-
A) The graphic is not misleading.
B) The graphic only includes information for one year.
C) The horizontal scale does not begin at zero.
D) The graphic may give the impression that drivers over age 65 had no DUI's in 2012.
فتح الحزمة
افتح القفل للوصول البطاقات البالغ عددها 30 في هذه المجموعة.
فتح الحزمة
k this deck
فتح الحزمة
افتح القفل للوصول البطاقات البالغ عددها 30 في هذه المجموعة.


