Deck 14: Analysis and Interpretation of Financial Statements
ملء الشاشة (f)
سؤال
سؤال
سؤال
سؤال
سؤال
سؤال
سؤال
سؤال
سؤال
سؤال
سؤال
سؤال
سؤال
سؤال
سؤال
سؤال
سؤال
سؤال
سؤال
سؤال
سؤال
سؤال
سؤال
سؤال
سؤال
سؤال
سؤال
سؤال
سؤال
سؤال
سؤال
سؤال
سؤال
سؤال
سؤال
سؤال
سؤال
سؤال
سؤال
سؤال
سؤال
سؤال
سؤال
سؤال
سؤال
سؤال
سؤال
سؤال
سؤال
سؤال
سؤال
سؤال
سؤال
سؤال
سؤال
سؤال
سؤال
سؤال
سؤال
سؤال
سؤال
سؤال
سؤال
سؤال
سؤال
سؤال
سؤال
سؤال
سؤال
The following information relates to Reed, Inc.:
 a. Compute Cordova's 2019 earnings per share.
b. Compute Cordova's price-earnings ratio at December 31, 2019.
a. Compute Cordova's 2019 earnings per share.b. Compute Cordova's price-earnings ratio at December 31, 2019.
سؤال
سؤال
سؤال
The balance sheets and income statements for Star Morning Communications follow:

 a. Compute the company's current ratio for 2019 and 2018. Comment on any observed trend.
b. Compute the debt-to-equity ratio for 2019 and 2018. Comment on any observed trend.
a. Compute the company's current ratio for 2019 and 2018. Comment on any observed trend.b. Compute the debt-to-equity ratio for 2019 and 2018. Comment on any observed trend.
سؤال
The partial balance sheets and income statements for Weasley's, Inc., for fiscal years ending June 30, 2019 and 2018 follow:
 a. Calculate accounts receivable turnover for 2019 and 2018. Accounts receivable in 2017 totaled $29,831 million. Has accounts receivable turnover improved during the year or worsened?
b. Calculate inventory turnover for 2019 and 2018. Inventories in 2017 were $30,686 million. Has inventory turnover improved during the year or worsened?
c. Calculate asset turnover for 2019 and 2085 considering that 2017 total assets are $434,214 million.
a. Calculate accounts receivable turnover for 2019 and 2018. Accounts receivable in 2017 totaled $29,831 million. Has accounts receivable turnover improved during the year or worsened?b. Calculate inventory turnover for 2019 and 2018. Inventories in 2017 were $30,686 million. Has inventory turnover improved during the year or worsened?
c. Calculate asset turnover for 2019 and 2085 considering that 2017 total assets are $434,214 million.
سؤال
The income statements for Springdale Corporation for fiscal year 2019 (year ended January 30, 2019) follow:
 a. Prepare a common-size income statement for 2019 and 2018. Round to one decimal place.
b. Comment on the most significant changes.
a. Prepare a common-size income statement for 2019 and 2018. Round to one decimal place.b. Comment on the most significant changes.
سؤال
The asset section of Fullerton Corporation's 2019 balance sheet follows:
 a. Prepare a common-size statements for the asset section of Belmont's balance sheet for 2019 and 2018. Round to one decimal place.
b. Comment on the most significant changes.
a. Prepare a common-size statements for the asset section of Belmont's balance sheet for 2019 and 2018. Round to one decimal place.b. Comment on the most significant changes.
سؤال
Consider the following results for Camire Brothers:
 Prepare the income statement for this company assuming a 35% income tax rate. Omit the statement heading.
Prepare the income statement for this company assuming a 35% income tax rate. Omit the statement heading.
فتح الحزمة
قم بالتسجيل لفتح البطاقات في هذه المجموعة!
Unlock Deck
Unlock Deck
1/76
العب
ملء الشاشة (f)
Deck 14: Analysis and Interpretation of Financial Statements
1
Asset turnover measures a company's solvency.
False
2
Vertical analysis examines changes in financial data across time.
False
3
Return on assets can be disaggregated into return on sales and return on common stockholders' equity ratio.
False
4
Austin Plumbing Supplies has a return on assets of 25%, while the industry average of similar companies is 15%. This means that Austin Plumbing Supplies' asset turnover is higher than the industry average.
فتح الحزمة
افتح القفل للوصول البطاقات البالغ عددها 76 في هذه المجموعة.
فتح الحزمة
k this deck
5
One benefit of using ratio analysis to compare two firms in the same industry is that ratios are immune to size and current accounting rules.
فتح الحزمة
افتح القفل للوصول البطاقات البالغ عددها 76 في هذه المجموعة.
فتح الحزمة
k this deck
6
One key measure of profitability is the debt-to-equity ratio.
فتح الحزمة
افتح القفل للوصول البطاقات البالغ عددها 76 في هذه المجموعة.
فتح الحزمة
k this deck
7
A debt-to-equity ratio of greater than 1.0 means that a firm's liabilities exceed its owners' equity.
فتح الحزمة
افتح القفل للوصول البطاقات البالغ عددها 76 في هذه المجموعة.
فتح الحزمة
k this deck
8
Earnings per share is the amount a company earns and pays out as dividends for each share of common stock outstanding.
فتح الحزمة
افتح القفل للوصول البطاقات البالغ عددها 76 في هذه المجموعة.
فتح الحزمة
k this deck
9
A change in an accounting principle is reflected through adjustments to future financial statements and, therefore, requires no retroactive or present adjustments to financial statements.
فتح الحزمة
افتح القفل للوصول البطاقات البالغ عددها 76 في هذه المجموعة.
فتح الحزمة
k this deck
10
Changing from straight-line depreciation to double declining-balance depreciation is an example of a change in an accounting principle.
فتح الحزمة
افتح القفل للوصول البطاقات البالغ عددها 76 في هذه المجموعة.
فتح الحزمة
k this deck
11
Determining gross profit is the first step in a multiple-step income statement for a merchandising firm.
فتح الحزمة
افتح القفل للوصول البطاقات البالغ عددها 76 في هذه المجموعة.
فتح الحزمة
k this deck
12
The price-earnings ratio indicates how much an investor would have to earn to be able to purchase the stock.
فتح الحزمة
افتح القفل للوصول البطاقات البالغ عددها 76 في هذه المجموعة.
فتح الحزمة
k this deck
13
Revenues from discontinued operations of a company are reported separately from revenues from continuing operations on the income statement.
فتح الحزمة
افتح القفل للوصول البطاقات البالغ عددها 76 في هذه المجموعة.
فتح الحزمة
k this deck
14
Income effects of discontinued operations are reported separately from continuing operations on the income statement.
فتح الحزمة
افتح القفل للوصول البطاقات البالغ عددها 76 في هذه المجموعة.
فتح الحزمة
k this deck
15
Which one of the following ratios does not involve assets?
A) Account receivable turnover
B) Current ratio
C) Return on sales
D) Inventory turnover
A) Account receivable turnover
B) Current ratio
C) Return on sales
D) Inventory turnover
فتح الحزمة
افتح القفل للوصول البطاقات البالغ عددها 76 في هذه المجموعة.
فتح الحزمة
k this deck
16
Which ratio can provide an indication of the salability of the company's products?
A) Account receivable turnover
B) Current ratio
C) Inventory turnover
D) Gross profit margin
A) Account receivable turnover
B) Current ratio
C) Inventory turnover
D) Gross profit margin
فتح الحزمة
افتح القفل للوصول البطاقات البالغ عددها 76 في هذه المجموعة.
فتح الحزمة
k this deck
17
Which of the following is one measure of liquidity?
A) Debt-to-equity ratio
B) Times-interest-earned ratio
C) Quick ratio
D) None of the above
A) Debt-to-equity ratio
B) Times-interest-earned ratio
C) Quick ratio
D) None of the above
فتح الحزمة
افتح القفل للوصول البطاقات البالغ عددها 76 في هذه المجموعة.
فتح الحزمة
k this deck
18
Return on assets is computed as:
A) Net income / Average stockholders' equity
B) Net income / Average total assets
C) Return on sales × Asset turnover
D) B or C
A) Net income / Average stockholders' equity
B) Net income / Average total assets
C) Return on sales × Asset turnover
D) B or C
فتح الحزمة
افتح القفل للوصول البطاقات البالغ عددها 76 في هذه المجموعة.
فتح الحزمة
k this deck
19
Aladdin Grocer's 2019 balance sheet shows average stockholders' equity of $18,000 million, net operating profit after tax of $1,710 million, net income of $665 million, and common shares issued of $2,874 million.
The company has no preferred shares issued. Aladdin Grocer's return on common stockholders' equity for the year is:
A) 18.61%
B) 3.69%
C) 7.37%
D) 11.07%
The company has no preferred shares issued. Aladdin Grocer's return on common stockholders' equity for the year is:
A) 18.61%
B) 3.69%
C) 7.37%
D) 11.07%
فتح الحزمة
افتح القفل للوصول البطاقات البالغ عددها 76 في هذه المجموعة.
فتح الحزمة
k this deck
20
Dils Brothers' 2019 balance sheet shows average stockholders' equity of $36,000 million, net operating profit after tax of $2,280 million, net income of $760 million, and common shares issued of $3,832 million.
The company has no preferred shares issued. Dils Brothers' return on common stockholders' equity for the year is:
A) 19.83%
B) 2.11%
C) 6.33%
D) 7.30%
The company has no preferred shares issued. Dils Brothers' return on common stockholders' equity for the year is:
A) 19.83%
B) 2.11%
C) 6.33%
D) 7.30%
فتح الحزمة
افتح القفل للوصول البطاقات البالغ عددها 76 في هذه المجموعة.
فتح الحزمة
k this deck
21
Aladdin Grocer's 2019 financial statements show average shareholders' equity of $15,309 million, net income of $2,940 million, and average total assets of $65,025 million.
How much is Aladdin Grocer's return on assets for the year?
A) 27.42%
B) 4.52%
C) 19.18%
D) 5.56%
How much is Aladdin Grocer's return on assets for the year?
A) 27.42%
B) 4.52%
C) 19.18%
D) 5.56%
فتح الحزمة
افتح القفل للوصول البطاقات البالغ عددها 76 في هذه المجموعة.
فتح الحزمة
k this deck
22
Dils Brothers' 2019 financial statements show average shareholders' equity of $20,412 million, net income of $5,040 million, and average total assets of $86,700 million.
How much is Dils Brothers' return on assets for the year?
A) 11.42%
B) 5.81%
C) 24.69%
D) 4.77%
How much is Dils Brothers' return on assets for the year?
A) 11.42%
B) 5.81%
C) 24.69%
D) 4.77%
فتح الحزمة
افتح القفل للوصول البطاقات البالغ عددها 76 في هذه المجموعة.
فتح الحزمة
k this deck
23
Aladdin Grocer's 2019 financial statements show net income of $2,940 million, sales of $230,199 million, and average total assets of $69,525 million.
How much is Aladdin Grocer's return on sales for the year?
A) 4.24%
B) 1.28%
C) 35.39%
D) 7.52%
How much is Aladdin Grocer's return on sales for the year?
A) 4.24%
B) 1.28%
C) 35.39%
D) 7.52%
فتح الحزمة
افتح القفل للوصول البطاقات البالغ عددها 76 في هذه المجموعة.
فتح الحزمة
k this deck
24
Dils Brothers' 2019 financial statements show net income of $5,040 million, sales of $306,932 million, and average total assets of $86,700 million.
How much is Dils Brothers' return on sales for the year?
A) 4.71%
B) 1.64%
C) 10.20%
D) 5.81%
How much is Dils Brothers' return on sales for the year?
A) 4.71%
B) 1.64%
C) 10.20%
D) 5.81%
فتح الحزمة
افتح القفل للوصول البطاقات البالغ عددها 76 في هذه المجموعة.
فتح الحزمة
k this deck
25
Use the following selected 2019 balance sheet and income statement information for Homer Glen Supply Co. (in millions) to compute the gross profit percentage to the nearest hundredth of a percent.
A) 4.42%
B) 8.56%
C) 28.76%
D) 44.26%
A) 4.42%
B) 8.56%
C) 28.76%
D) 44.26%
فتح الحزمة
افتح القفل للوصول البطاقات البالغ عددها 76 في هذه المجموعة.
فتح الحزمة
k this deck
26
Use the following selected 2019 balance sheet and income statement information for Life Improvements Co. (in millions) to compute the gross profit percentage to the nearest hundredth of a percent.
A) 50.34%
B) 77.45%
C) 10.31%
D) 51.63%
A) 50.34%
B) 77.45%
C) 10.31%
D) 51.63%
فتح الحزمة
افتح القفل للوصول البطاقات البالغ عددها 76 في هذه المجموعة.
فتح الحزمة
k this deck
27
Use the following selected 2019 balance sheet and income statement information for Homer Glen Supply Co. (in millions) to compute the return on assets to the nearest hundredth.
A) 14.83%
B) 22.78%
C) 4.42%
D) 16.63%
A) 14.83%
B) 22.78%
C) 4.42%
D) 16.63%
فتح الحزمة
افتح القفل للوصول البطاقات البالغ عددها 76 في هذه المجموعة.
فتح الحزمة
k this deck
28
Use the following selected 2019 balance sheet and income statement information for Homer Glen Supply Co. (in millions) to compute asset turnover (AT) to the nearest hundredth of a percent.
A) 0.27
B) 3.76
C) 17.30
D) 5.17
A) 0.27
B) 3.76
C) 17.30
D) 5.17
فتح الحزمة
افتح القفل للوصول البطاقات البالغ عددها 76 في هذه المجموعة.
فتح الحزمة
k this deck
29
In trend analysis, of what amount is each item expressed as a percentage?
A) Net income
B) Average total assets
C) Sales revenue
D) A base year amount
A) Net income
B) Average total assets
C) Sales revenue
D) A base year amount
فتح الحزمة
افتح القفل للوصول البطاقات البالغ عددها 76 في هذه المجموعة.
فتح الحزمة
k this deck
30
Brown Enterprises reported sales revenue totaling $1,008,000, $1,002,000, and $1,239,000 in the years, 2018, 2019, and 2020, respectively.
Performing trend analysis, with 2018 serving as the base year, what is the percentage for 2020?
A) 123.69%
B) 22.27%
C) 122.92%
D) 32.91%
Performing trend analysis, with 2018 serving as the base year, what is the percentage for 2020?
A) 123.69%
B) 22.27%
C) 122.92%
D) 32.91%
فتح الحزمة
افتح القفل للوصول البطاقات البالغ عددها 76 في هذه المجموعة.
فتح الحزمة
k this deck
31
Ben Enterprises reported sales revenue totaling $1,344,000, $1,340,000, and $3,525,000 in the years, 2018, 2019, and 2020, respectively.
Performing trend analysis, with 2018 serving as the base year, what is the percentage for 2020?
A) 123.58%
B) 262.28%
C) 105.36%
D) 28.21%
Performing trend analysis, with 2018 serving as the base year, what is the percentage for 2020?
A) 123.58%
B) 262.28%
C) 105.36%
D) 28.21%
فتح الحزمة
افتح القفل للوصول البطاقات البالغ عددها 76 في هذه المجموعة.
فتح الحزمة
k this deck
32
At December 31, 2019, David Bash Company has total assets of $1,000,000, total liabilities of $720,000, and total owner's equity of $280,000.
At December 31, 2019, David Bash Company's debt-to-equity ratio is:
A) 0.28
B) 5.00
C) 0.72
D) 2.57
At December 31, 2019, David Bash Company's debt-to-equity ratio is:
A) 0.28
B) 5.00
C) 0.72
D) 2.57
فتح الحزمة
افتح القفل للوصول البطاقات البالغ عددها 76 في هذه المجموعة.
فتح الحزمة
k this deck
33
At December 31, 2019, Gevas Company has total assets of $3,000,000, total liabilities of $450,000, and total owner's equity of $2,550,000.
At December 31, 2019, Gevas debt-to-equity ratio is:
A) 0.18
B) 4.09
C) 0.65
D) 2.10
At December 31, 2019, Gevas debt-to-equity ratio is:
A) 0.18
B) 4.09
C) 0.65
D) 2.10
فتح الحزمة
افتح القفل للوصول البطاقات البالغ عددها 76 في هذه المجموعة.
فتح الحزمة
k this deck
34
At December 31, 2019, Jose Company has total assets of $1,800,000, total liabilities of $480,000, and total owner's equity of $1,320,000.
At December 31, 2019, Jose Company's debt-to-equity ratio is:
A) 0.36
B) 1.20
C) 2.75
D) 0.27
At December 31, 2019, Jose Company's debt-to-equity ratio is:
A) 0.36
B) 1.20
C) 2.75
D) 0.27
فتح الحزمة
افتح القفل للوصول البطاقات البالغ عددها 76 في هذه المجموعة.
فتح الحزمة
k this deck
35
The operating-cash-flow-to-current-liabilities ratio is computed by dividing a firm's a net cash flow from operating activities by:
A) Current liabilities at the end of the period
B) Current liabilities at the beginning of the period
C) Total liabilities at the middle of the period
D) Average current liabilities for the period
A) Current liabilities at the end of the period
B) Current liabilities at the beginning of the period
C) Total liabilities at the middle of the period
D) Average current liabilities for the period
فتح الحزمة
افتح القفل للوصول البطاقات البالغ عددها 76 في هذه المجموعة.
فتح الحزمة
k this deck
36
Chinchilla Company is preparing trend percentages for its service fees earned for the period 2016 through 2020.
The base year is 2016. The 2019 trend percentage is computed as:
A) 2019 service fees earned divided by 2018 service fees earned
B) 2019 service fees earned divided by 2016 service fees earned
C) 2016 service fees earned divided by 2019 service fees earned
D) 2018 service fees earned divided by 2019 service fees earned
فتح الحزمة
افتح القفل للوصول البطاقات البالغ عددها 76 في هذه المجموعة.
فتح الحزمة
k this deck
37
Begeman Company's net income was $225,000 for 2018, $243,750 for 2019, and $293,160 for 2020. Assume trend percentages for net income over the three-year period are computed with 2018 serving as the base year.
The trend percentage for 2020's net income is:
A) 117.30%
B) 120.92%
C) 130.29%
D) 86.36%
The trend percentage for 2020's net income is:
A) 117.30%
B) 120.92%
C) 130.29%
D) 86.36%
فتح الحزمة
افتح القفل للوصول البطاقات البالغ عددها 76 في هذه المجموعة.
فتح الحزمة
k this deck
38
Javier Company reported net income of $4,550 million in 2019. The weighted average number of common shares outstanding during 2019 was 1,662 million shares. Javier paid $135 million in dividends on preferred stock.
How much is basic earnings per share amount for 2019?
A) $2.61
B) $2.55
C) $2.66
D) $2.75
How much is basic earnings per share amount for 2019?
A) $2.61
B) $2.55
C) $2.66
D) $2.75
فتح الحزمة
افتح القفل للوصول البطاقات البالغ عددها 76 في هذه المجموعة.
فتح الحزمة
k this deck
39
Zebra Company sells a segment of its operations at a loss. Zebra has not previously experienced such an event and does not expect to again.
The loss from the disposal of the segment should be reported in the income statement as:
A) A separate amount in comprehensive income
B) A separate amount in a discontinued operations section
C) A separate amount in net income from continuing operations
D) As part of cost of goods sold
The loss from the disposal of the segment should be reported in the income statement as:
A) A separate amount in comprehensive income
B) A separate amount in a discontinued operations section
C) A separate amount in net income from continuing operations
D) As part of cost of goods sold
فتح الحزمة
افتح القفل للوصول البطاقات البالغ عددها 76 في هذه المجموعة.
فتح الحزمة
k this deck
40
Information about a segment of the business that a company sells, abandons, or otherwise disposes of is reported in the:
A) Retained earnings statement
B) Comprehensive income of the income statement
C) Discontinued operations section of the income statement
D) Balance sheet
A) Retained earnings statement
B) Comprehensive income of the income statement
C) Discontinued operations section of the income statement
D) Balance sheet
فتح الحزمة
افتح القفل للوصول البطاقات البالغ عددها 76 في هذه المجموعة.
فتح الحزمة
k this deck
41
A single-step income statement for a merchandising firm:
A) Shows a different net income amount than a multiple-step income statement
B) May not be used because it is an unacceptable reporting format
C) Does not show a gross profit on sales amount
D) None of the above
A) Shows a different net income amount than a multiple-step income statement
B) May not be used because it is an unacceptable reporting format
C) Does not show a gross profit on sales amount
D) None of the above
فتح الحزمة
افتح القفل للوصول البطاقات البالغ عددها 76 في هذه المجموعة.
فتح الحزمة
k this deck
42
World Airlines has no preferred stock outstanding. The company had 50,000 shares of common stock outstanding on January 1, 2019 and issued 20,000 additional shares on April 1.
If World's net income was $1,077,000, the company should report earnings per share of (to the nearest cent):
A) $12.81
B) $13.80
C) $16.57
D) $15.39
If World's net income was $1,077,000, the company should report earnings per share of (to the nearest cent):
A) $12.81
B) $13.80
C) $16.57
D) $15.39
فتح الحزمة
افتح القفل للوصول البطاقات البالغ عددها 76 في هذه المجموعة.
فتح الحزمة
k this deck
43
Party, Inc. has no preferred stock outstanding. The company had 40,000 shares of common stock outstanding on January 1, 2019 and issued 12,000 additional shares on May 1.
If Party's net income was $200,000, the company should report earnings per share of (to the nearest cent):
A) $3.85
B) $4.44
C) $4.17
D) $5.24
If Party's net income was $200,000, the company should report earnings per share of (to the nearest cent):
A) $3.85
B) $4.44
C) $4.17
D) $5.24
فتح الحزمة
افتح القفل للوصول البطاقات البالغ عددها 76 في هذه المجموعة.
فتح الحزمة
k this deck
44
Texas, Inc. has net income for 2019 of $555,000. At January 1, 2019, the company had outstanding 54,000 shares of $75 par value common stock and 10,000 shares of 6%, $150 par value cumulative preferred stock. On September 1, 2019, an additional 18,000 shares of common stock were issued.
What is the earnings per share for 2019 (to the nearest cent)?
A) $6.66
B) $7.75
C) $6.47
D) $9.26
What is the earnings per share for 2019 (to the nearest cent)?
A) $6.66
B) $7.75
C) $6.47
D) $9.26
فتح الحزمة
افتح القفل للوصول البطاقات البالغ عددها 76 في هذه المجموعة.
فتح الحزمة
k this deck
45
Coconut Inc. has net income for 2019 of $272,000. At January 1, 2019, the company had outstanding 37,000 shares of $20 par value common stock and 5,000 shares of 8%, $100 par value cumulative preferred stock. On October 1, 2019, an additional 12,000 shares of common stock were issued.
What is the earnings per share for 2019 (to the nearest cent)?
A) $4.74
B) $5.80
C) $6.80
D) $5.40
What is the earnings per share for 2019 (to the nearest cent)?
A) $4.74
B) $5.80
C) $6.80
D) $5.40
فتح الحزمة
افتح القفل للوصول البطاقات البالغ عددها 76 في هذه المجموعة.
فتح الحزمة
k this deck
46
At December 31, 2019, Jamie, Inc. had 500,000 shares of common stock issued and outstanding, 250,000 of which had been issued and outstanding throughout the year and 250,000 of which were issued on July 1, 2019. Net income for the year ended December 31, 2019, was $2,385,000.
What is Jamie's 2019 earnings per common share (to the nearest cent)?
A) $3.13
B) $3.81
C) $4.77
D) $6.36
What is Jamie's 2019 earnings per common share (to the nearest cent)?
A) $3.13
B) $3.81
C) $4.77
D) $6.36
فتح الحزمة
افتح القفل للوصول البطاقات البالغ عددها 76 في هذه المجموعة.
فتح الحزمة
k this deck
47
At December 31, 2019, Van Devender's price-earnings ratio was 13.4. For 2019, Van Devender's net income was $660,000, its earnings per share was $7.00, and its annual dividend per share was $4.00.
What was the per share market price of Van Devender's stock at December 31, 2019?
A) $93.80
B) $40.20
C) $65.60
D) $53.60
What was the per share market price of Van Devender's stock at December 31, 2019?
A) $93.80
B) $40.20
C) $65.60
D) $53.60
فتح الحزمة
افتح القفل للوصول البطاقات البالغ عددها 76 في هذه المجموعة.
فتح الحزمة
k this deck
48
At December 31, 2019, Van Beek's price-earnings ratio was 14.6. For 2019, Van Beek's net income was $1,980,000, its earnings per share was $21.00, and its annual dividend per share was $12.00.
What was the per share market price of Van Beek's stock at December 31, 2019?
A) $306.60
B) $199.20
C) $248.40
D) $175.20
What was the per share market price of Van Beek's stock at December 31, 2019?
A) $306.60
B) $199.20
C) $248.40
D) $175.20
فتح الحزمة
افتح القفل للوصول البطاقات البالغ عددها 76 في هذه المجموعة.
فتح الحزمة
k this deck
49
In computing the price-earnings ratio, the current per share market price of the firm's common stock is divided by the:
A) Par value per common share
B) Dividends per common share
C) Earnings per common share
D) Net income for the year
A) Par value per common share
B) Dividends per common share
C) Earnings per common share
D) Net income for the year
فتح الحزمة
افتح القفل للوصول البطاقات البالغ عددها 76 في هذه المجموعة.
فتح الحزمة
k this deck
50
On the income statement of a merchandising company, interest income and interest expense are reported:
A) By offsetting interest income and interest expense and showing the excess as an operating revenue or expense
B) As separate items of other income and expense below the net operating income or loss
C) As part of cost of goods sold
D) By showing interest income as additional sales revenue and interest expense as an operating expense
فتح الحزمة
افتح القفل للوصول البطاقات البالغ عددها 76 في هذه المجموعة.
فتح الحزمة
k this deck
51
Selected balance sheet and income statement information for Forester Company follows in millions:
a. Calculate the company's return on common stockholders' equity.
b. Explain what information this provides to management.
a. Calculate the company's return on common stockholders' equity.
b. Explain what information this provides to management.
فتح الحزمة
افتح القفل للوصول البطاقات البالغ عددها 76 في هذه المجموعة.
فتح الحزمة
k this deck
52
Selected balance sheet and income statement information from the Vegan's Company for fiscal years 2018 through 2020 follows (Amounts in millions):
a. Compute the times-interest-earned ratio for each year and discuss any trends.
b. What concerns about Vegan's ability to meet its interest obligations might creditors have? Explain.
a. Compute the times-interest-earned ratio for each year and discuss any trends.
b. What concerns about Vegan's ability to meet its interest obligations might creditors have? Explain.
فتح الحزمة
افتح القفل للوصول البطاقات البالغ عددها 76 في هذه المجموعة.
فتح الحزمة
k this deck
53
Selected recent balance sheet and income statement information for the clothing companies: Coffee Plus and Tea Circle Corporation follows:
a. Calculate the current ratio and quick ratio for both companies.
b. Which company is more liquid?
c. Calculate the times-interest-earned and debt-to-equity ratios for both companies.
d. Which company is more solvent? Explain.
a. Calculate the current ratio and quick ratio for both companies.
b. Which company is more liquid?
c. Calculate the times-interest-earned and debt-to-equity ratios for both companies.
d. Which company is more solvent? Explain.
فتح الحزمة
افتح القفل للوصول البطاقات البالغ عددها 76 في هذه المجموعة.
فتح الحزمة
k this deck
54
Selected balance sheet and income statement information for two manufacturing companies: Stripe, Inc. and Polka-dot Corporation follows:
a. Calculate the current ratio and quick ratio for both companies.
b. Which company is more liquid?
c. Calculate the times-interest-earned ratio and debt-to-equity ratio for both companies.
d. Which company is more solvent?
a. Calculate the current ratio and quick ratio for both companies.
b. Which company is more liquid?
c. Calculate the times-interest-earned ratio and debt-to-equity ratio for both companies.
d. Which company is more solvent?
فتح الحزمة
افتح القفل للوصول البطاقات البالغ عددها 76 في هذه المجموعة.
فتح الحزمة
k this deck
55
Selected recent balance sheet and income statement information for Frischmuth Systems, Inc. follows:
a. Calculate accounts receivable turnover for both years. Has accounts receivable turnover improved during the year or worsened?
b. Calculate inventory turnover for 2019 and 2018. Has inventory turnover improved during the year or worsened?
a. Calculate accounts receivable turnover for both years. Has accounts receivable turnover improved during the year or worsened?
b. Calculate inventory turnover for 2019 and 2018. Has inventory turnover improved during the year or worsened?
فتح الحزمة
افتح القفل للوصول البطاقات البالغ عددها 76 في هذه المجموعة.
فتح الحزمة
k this deck
56
Selected recent balance sheet and income statement information for Shannon & Sisters Corporation follows:
a. Calculate accounts receivable turnover for 2019 and 2018. Has it improved during the year or worsened?
b. Calculate inventory turnover for 2019 and 2018. Has it improved during the year or worsened?
a. Calculate accounts receivable turnover for 2019 and 2018. Has it improved during the year or worsened?
b. Calculate inventory turnover for 2019 and 2018. Has it improved during the year or worsened?
فتح الحزمة
افتح القفل للوصول البطاقات البالغ عددها 76 في هذه المجموعة.
فتح الحزمة
k this deck
57
Selected recent balance sheet and income statement information for Summersun, Inc. follows:
a. Calculate accounts receivable turnover for 2019 and 2018. Has it improved during the year or worsened?
b. Calculate inventory turnover for 2019 and 2018. Has it improved during the year or worsened?
a. Calculate accounts receivable turnover for 2019 and 2018. Has it improved during the year or worsened?
b. Calculate inventory turnover for 2019 and 2018. Has it improved during the year or worsened?
فتح الحزمة
افتح القفل للوصول البطاقات البالغ عددها 76 في هذه المجموعة.
فتح الحزمة
k this deck
58
Selected recent balance sheet and income statement information for the computer software companies, Valley Enterprises and Mountain Industries follow:
a. Compute accounts receivable turnover for Valley Enterprises and Mountain Industries.
b. Interpret and comment on the differences between the receivables turnover rates between each company assuming the industry average is 6.0 times.
a. Compute accounts receivable turnover for Valley Enterprises and Mountain Industries.
b. Interpret and comment on the differences between the receivables turnover rates between each company assuming the industry average is 6.0 times.
فتح الحزمة
افتح القفل للوصول البطاقات البالغ عددها 76 في هذه المجموعة.
فتح الحزمة
k this deck
59
Selected recent balance sheet and income statement information for Book Products, Inc. follows (in $ millions):
Compute accounts receivable turnover and inventory turnover.
Compute accounts receivable turnover and inventory turnover.
فتح الحزمة
افتح القفل للوصول البطاقات البالغ عددها 76 في هذه المجموعة.
فتح الحزمة
k this deck
60
The following is selected balance sheet and income statement information for Mario Company.
Compute the following ratios:
a. Gross profit percentage
b. Return on sales
c. Asset turnover
d. Return on assets
e. Return on common stockholders' equity (Mario Company has no preferred stock)
Compute the following ratios:
a. Gross profit percentage
b. Return on sales
c. Asset turnover
d. Return on assets
e. Return on common stockholders' equity (Mario Company has no preferred stock)
فتح الحزمة
افتح القفل للوصول البطاقات البالغ عددها 76 في هذه المجموعة.
فتح الحزمة
k this deck
61
During 2019, Homewood Company had 50,000 shares of $30 par value common stock and 7,000 shares of 8%, $90 par value convertible preferred stock outstanding. Homewood Company's 2019 net income was $1,350,000.
Compute earnings per share for 2019.
Compute earnings per share for 2019.
فتح الحزمة
افتح القفل للوصول البطاقات البالغ عددها 76 في هذه المجموعة.
فتح الحزمة
k this deck
62
Listed below are five items or sections that may be found in a multiple-step income statement. Place the numbers 1 through 5 in to indicate the sequence of these items or sections in the income statement (with 1 assigned to the first item or section, and so on).
-Discontinued operations
A) 1
B) 2
C) 3
D) 4
E) 5
-Discontinued operations
A) 1
B) 2
C) 3
D) 4
E) 5
فتح الحزمة
افتح القفل للوصول البطاقات البالغ عددها 76 في هذه المجموعة.
فتح الحزمة
k this deck
63
Listed below are five items or sections that may be found in a multiple-step income statement. Place the numbers 1 through 5 in to indicate the sequence of these items or sections in the income statement (with 1 assigned to the first item or section, and so on).
-Net operating income
A) 2
B) 3
C) 4
D) 5
E) 6
-Net operating income
A) 2
B) 3
C) 4
D) 5
E) 6
فتح الحزمة
افتح القفل للوصول البطاقات البالغ عددها 76 في هذه المجموعة.
فتح الحزمة
k this deck
64
Listed below are five items or sections that may be found in a multiple-step income statement. Place the numbers 1 through 5 in to indicate the sequence of these items or sections in the income statement (with 1 assigned to the first item or section, and so on).
-Net income
A) 3
B) 4
C) 5
D) 6
E) 7
-Net income
A) 3
B) 4
C) 5
D) 6
E) 7
فتح الحزمة
افتح القفل للوصول البطاقات البالغ عددها 76 في هذه المجموعة.
فتح الحزمة
k this deck
65
Listed below are five items or sections that may be found in a multiple-step income statement. Place the numbers 1 through 5 in to indicate the sequence of these items or sections in the income statement (with 1 assigned to the first item or section, and so on).
-Net income from continuing operations
A) 4
B) 5
C) 6
D) 7
E) 8
-Net income from continuing operations
A) 4
B) 5
C) 6
D) 7
E) 8
فتح الحزمة
افتح القفل للوصول البطاقات البالغ عددها 76 في هذه المجموعة.
فتح الحزمة
k this deck
66
Listed below are five items or sections that may be found in a multiple-step income statement. Place the numbers 1 through 5 in to indicate the sequence of these items or sections in the income statement (with 1 assigned to the first item or section, and so on).
-Gross profit
A) 5
B) 6
C) 7
D) 8
E) 9
-Gross profit
A) 5
B) 6
C) 7
D) 8
E) 9
فتح الحزمة
افتح القفل للوصول البطاقات البالغ عددها 76 في هذه المجموعة.
فتح الحزمة
k this deck
67
During 2019, Fabulous Shoe Corporation had 75,000 shares of $10 par value common stock and 10,000 shares of 6%, $50 par value preferred stock outstanding. Fabulous Shoe Corporation's 2019 net income is $798,000.
Compute the earnings per share for 2019.
Compute the earnings per share for 2019.
فتح الحزمة
افتح القفل للوصول البطاقات البالغ عددها 76 في هذه المجموعة.
فتح الحزمة
k this deck
68
During 2019, Koala Corporation had 160,000 shares of $15 par value common stock and 30,000 shares of 5%, $60 par value preferred stock outstanding. Koala Corporation's 2019 net income is $1,440,000.
Compute the primary earnings per share for 2019.
Compute the primary earnings per share for 2019.
فتح الحزمة
افتح القفل للوصول البطاقات البالغ عددها 76 في هذه المجموعة.
فتح الحزمة
k this deck
69
The following information relates to Reed, Inc.:
a. Compute Cordova's 2019 earnings per share.
b. Compute Cordova's price-earnings ratio at December 31, 2019.
a. Compute Cordova's 2019 earnings per share.b. Compute Cordova's price-earnings ratio at December 31, 2019.
فتح الحزمة
افتح القفل للوصول البطاقات البالغ عددها 76 في هذه المجموعة.
فتح الحزمة
k this deck
70
Twin Lakes Company has the following values taken from its 2019 annual report (in thousands):
a. Calculate Twin Lakes Company's times-interest-earned ratio.
b. Calculate Twin Lakes Company's debt-to-equity ratio.
a. Calculate Twin Lakes Company's times-interest-earned ratio.
b. Calculate Twin Lakes Company's debt-to-equity ratio.
فتح الحزمة
افتح القفل للوصول البطاقات البالغ عددها 76 في هذه المجموعة.
فتح الحزمة
k this deck
71
Selected recent balance sheet and income statement information from Hats Co. and Gloves, Inc. follows:
a. Compute the following turnover rates for each company:
1. Accounts receivable turnover
2. Inventory turnover
3. Asset turnover
b. Interpret and comment on any differences you observe between the turnover rates for these two companies
a. Compute the following turnover rates for each company:
1. Accounts receivable turnover
2. Inventory turnover
3. Asset turnover
b. Interpret and comment on any differences you observe between the turnover rates for these two companies
فتح الحزمة
افتح القفل للوصول البطاقات البالغ عددها 76 في هذه المجموعة.
فتح الحزمة
k this deck
72
The balance sheets and income statements for Star Morning Communications follow:
a. Compute the company's current ratio for 2019 and 2018. Comment on any observed trend.
b. Compute the debt-to-equity ratio for 2019 and 2018. Comment on any observed trend.
a. Compute the company's current ratio for 2019 and 2018. Comment on any observed trend.b. Compute the debt-to-equity ratio for 2019 and 2018. Comment on any observed trend.
فتح الحزمة
افتح القفل للوصول البطاقات البالغ عددها 76 في هذه المجموعة.
فتح الحزمة
k this deck
73
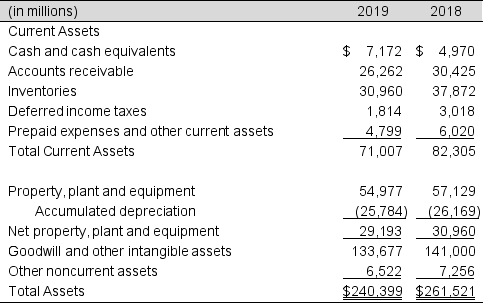
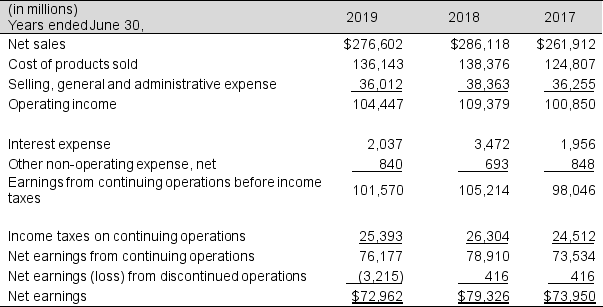
The partial balance sheets and income statements for Weasley's, Inc., for fiscal years ending June 30, 2019 and 2018 follow:
a. Calculate accounts receivable turnover for 2019 and 2018. Accounts receivable in 2017 totaled $29,831 million. Has accounts receivable turnover improved during the year or worsened?
b. Calculate inventory turnover for 2019 and 2018. Inventories in 2017 were $30,686 million. Has inventory turnover improved during the year or worsened?
c. Calculate asset turnover for 2019 and 2085 considering that 2017 total assets are $434,214 million.
a. Calculate accounts receivable turnover for 2019 and 2018. Accounts receivable in 2017 totaled $29,831 million. Has accounts receivable turnover improved during the year or worsened?b. Calculate inventory turnover for 2019 and 2018. Inventories in 2017 were $30,686 million. Has inventory turnover improved during the year or worsened?
c. Calculate asset turnover for 2019 and 2085 considering that 2017 total assets are $434,214 million.
فتح الحزمة
افتح القفل للوصول البطاقات البالغ عددها 76 في هذه المجموعة.
فتح الحزمة
k this deck
74
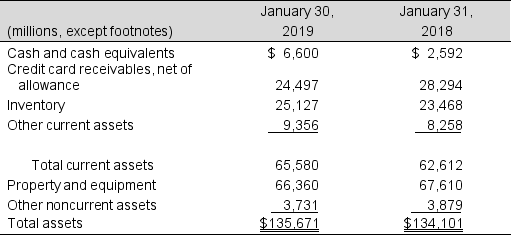
The income statements for Springdale Corporation for fiscal year 2019 (year ended January 30, 2019) follow:
a. Prepare a common-size income statement for 2019 and 2018. Round to one decimal place.
b. Comment on the most significant changes.
a. Prepare a common-size income statement for 2019 and 2018. Round to one decimal place.b. Comment on the most significant changes.
فتح الحزمة
افتح القفل للوصول البطاقات البالغ عددها 76 في هذه المجموعة.
فتح الحزمة
k this deck
75
The asset section of Fullerton Corporation's 2019 balance sheet follows:
a. Prepare a common-size statements for the asset section of Belmont's balance sheet for 2019 and 2018. Round to one decimal place.
b. Comment on the most significant changes.
a. Prepare a common-size statements for the asset section of Belmont's balance sheet for 2019 and 2018. Round to one decimal place.b. Comment on the most significant changes.
فتح الحزمة
افتح القفل للوصول البطاقات البالغ عددها 76 في هذه المجموعة.
فتح الحزمة
k this deck
76
Consider the following results for Camire Brothers:
Prepare the income statement for this company assuming a 35% income tax rate. Omit the statement heading.
Prepare the income statement for this company assuming a 35% income tax rate. Omit the statement heading. فتح الحزمة
افتح القفل للوصول البطاقات البالغ عددها 76 في هذه المجموعة.
فتح الحزمة
k this deck
فتح الحزمة
افتح القفل للوصول البطاقات البالغ عددها 76 في هذه المجموعة.


